Is Chairman Powell right?
During the FOMC Press Conference on September 21, U.S. Federal Reserve (Fed) Chair Powell pointed out that the housing price gains were not sustainable. He also suggested that the housing market may have to enter a correction or see a cooldown in housing prices to take the supply and demand back to equilibrium and to pull inflation back down to the Fed’s target level.1
In line with Chair Powell’s comment, we believe housing prices may see a correction, which is also indicated by our findings about cooling sales activity, lower affordability, relatively slower growth of rent and income, rising interest rates, and tightening lending conditions. However, we don’t expect the current housing market slowdown to mirror what happened during the housing market crash in 2008.
Current Price Gains May Not be Sustained
Sales and Affordability are Down
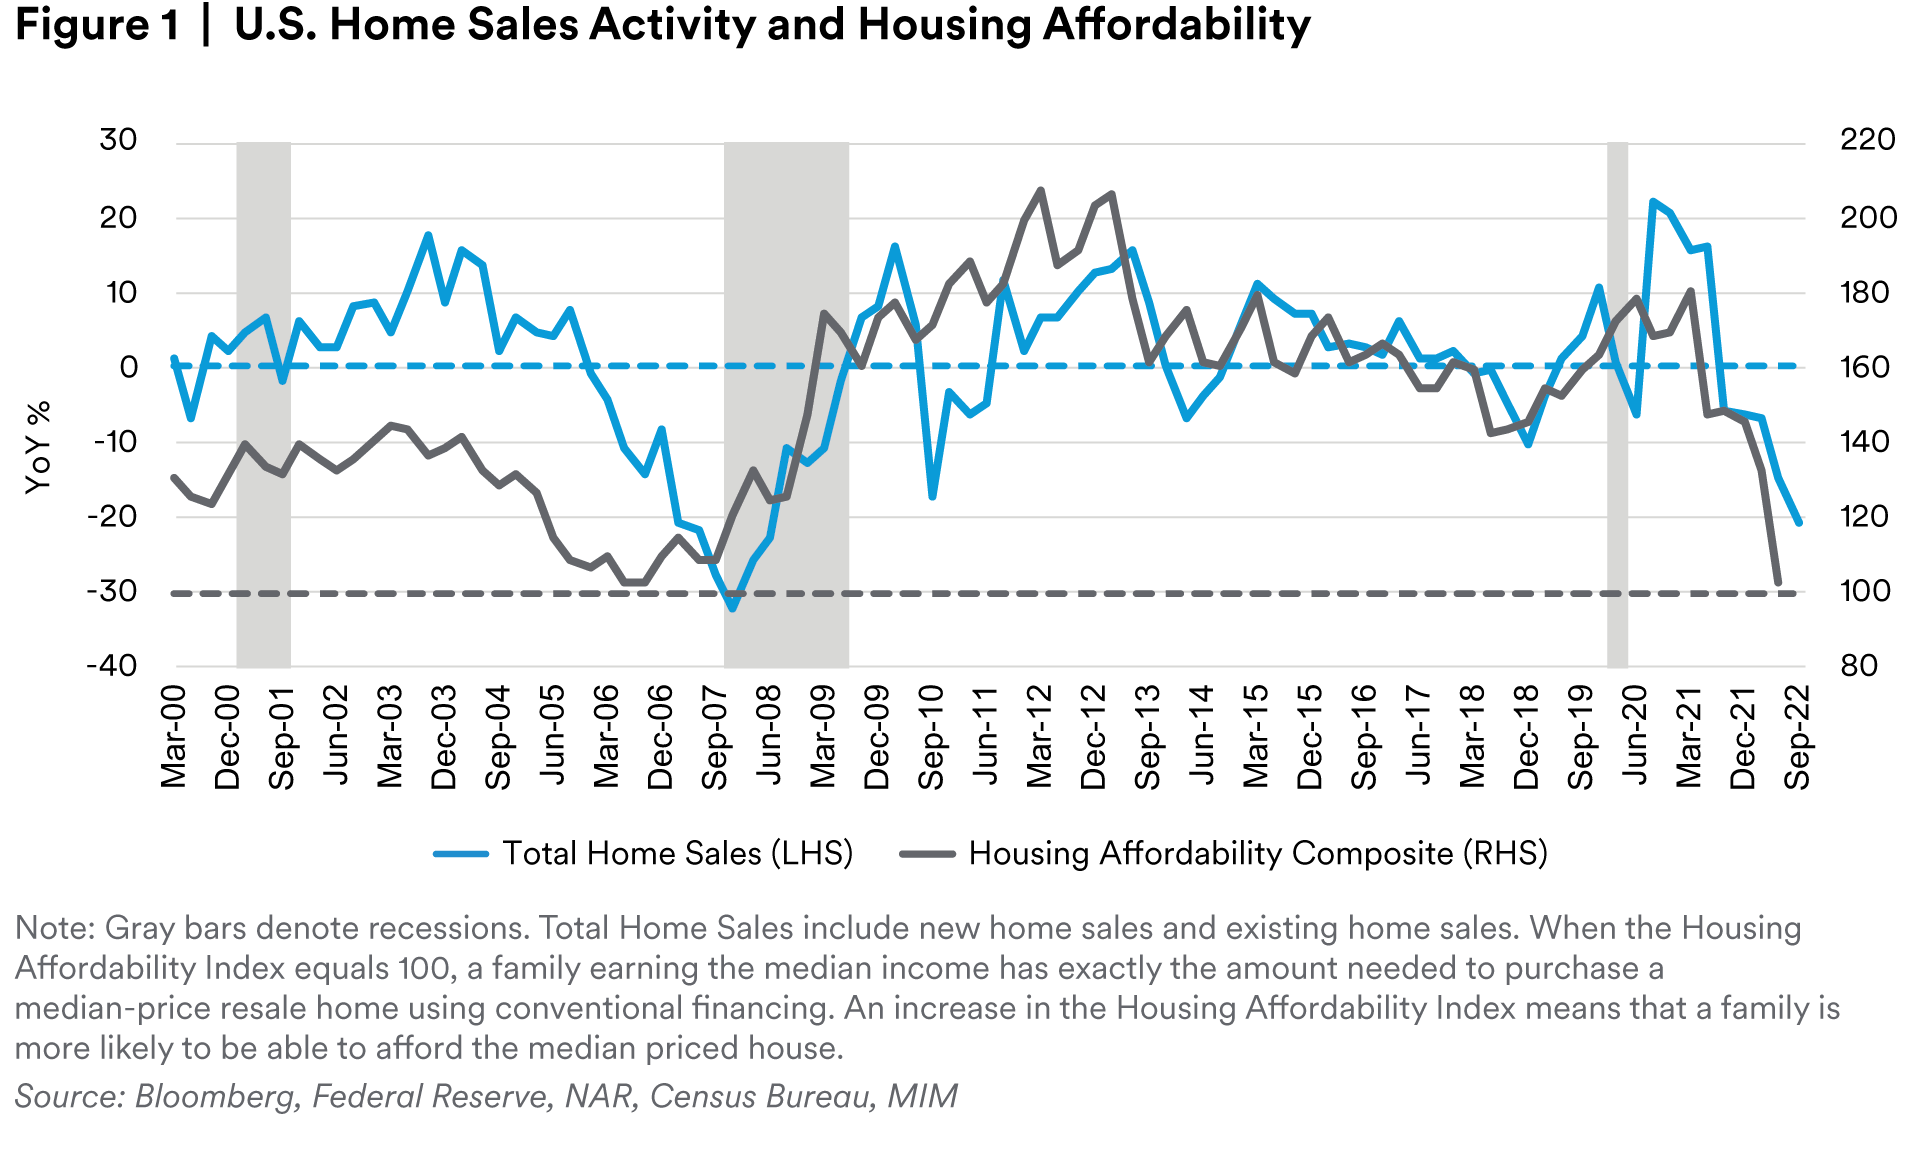
Home sales activity has been cooling, with home sales seeing negative, year-over-year (yoy) growth estimates since August 2021, and total home sales falling by 21% yoy in September—the largest contraction since the Global Financial Crisis (GFC) (when total home sales dropped by 32% yoy in 2007, Figure 1.) The Housing Affordability Index, which tracks the affordability of housing based on median home prices, median income, and mortgage rates, fell to 102.8 in June, the lowest since June 2006 (right before the GFC). This measure shows that fewer families will be able to afford the median-priced house based on their current incomes and mortgage rates. With continued rate hikes, we expect U.S. for-sale housing to become even less affordable.

Home Prices are Under Pressure
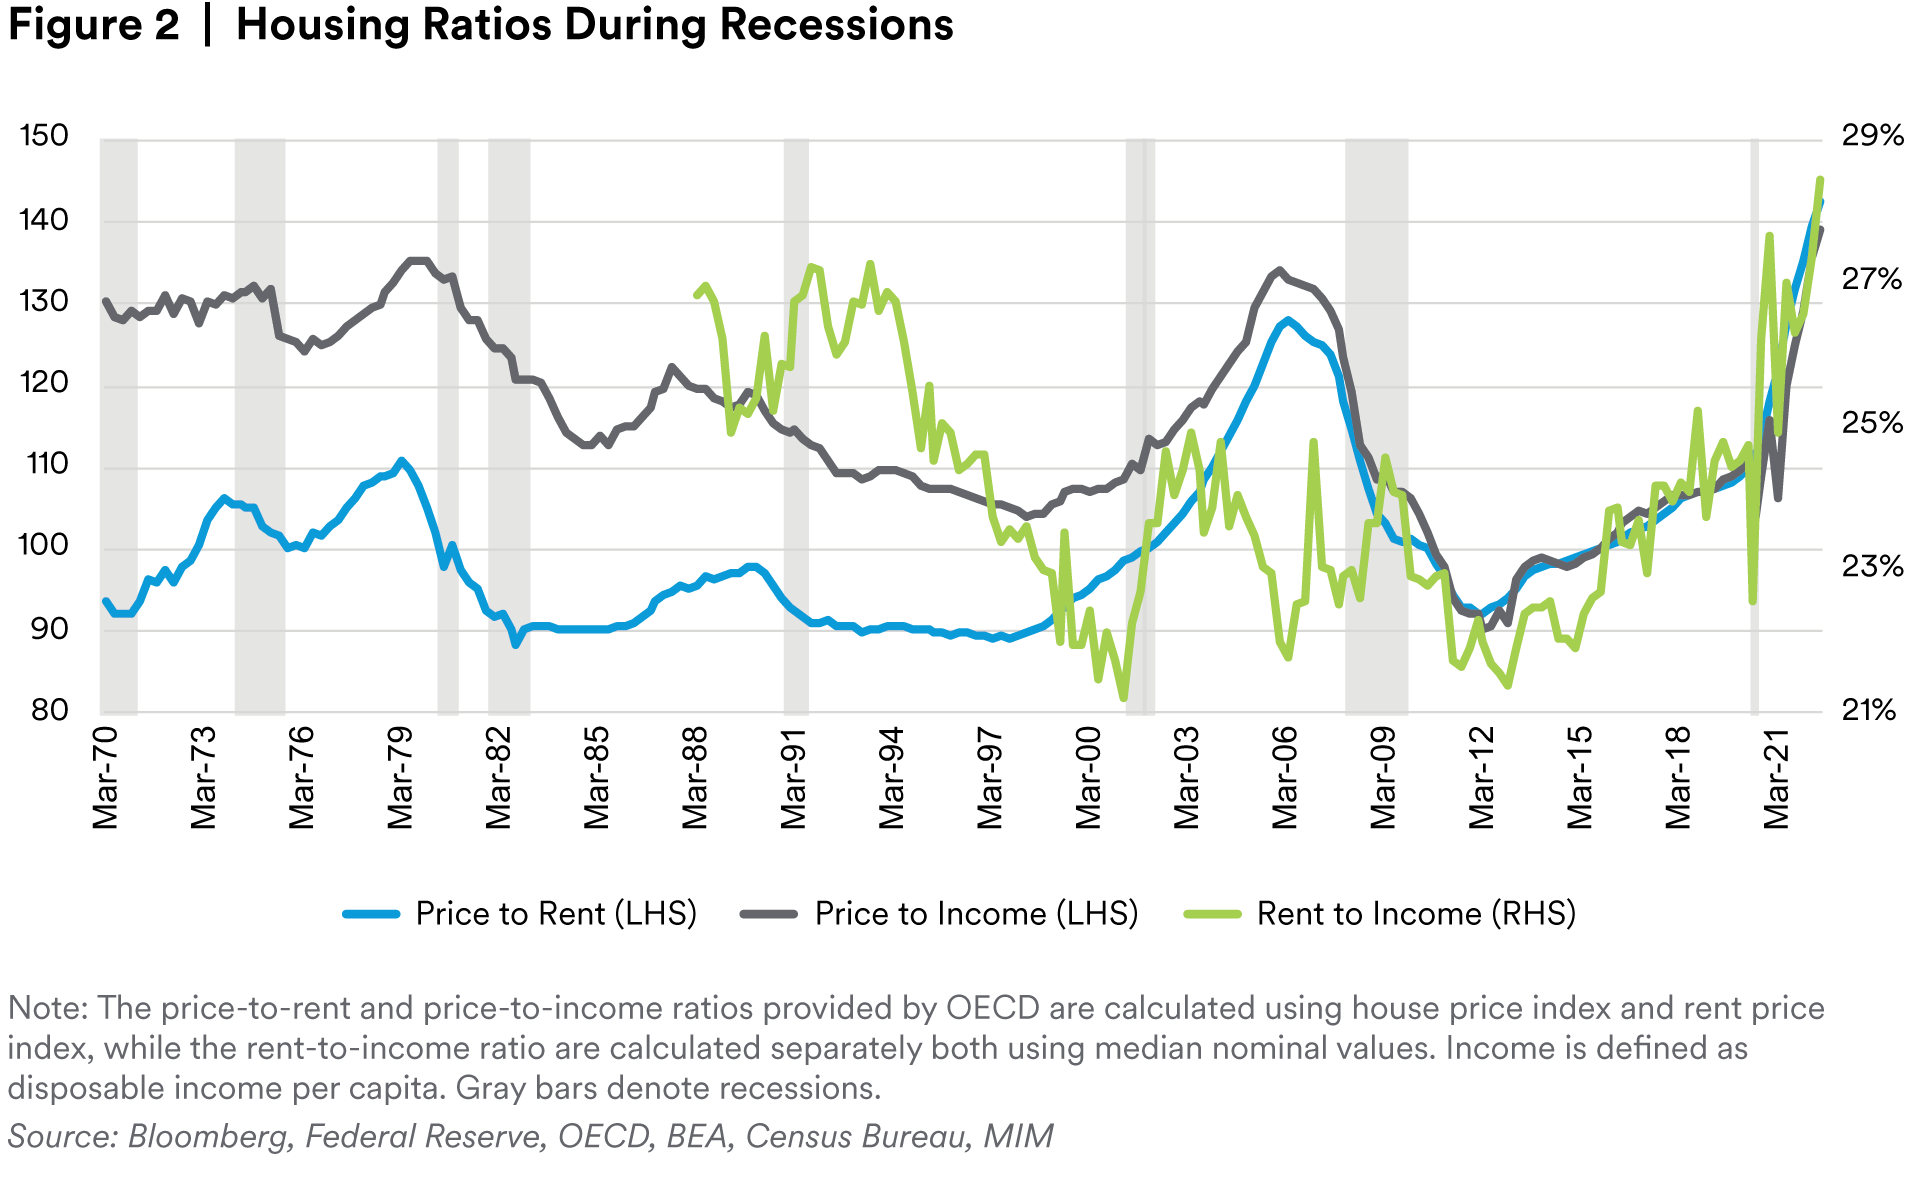
We observe (Figure 2) that during recessions, except for the 2001 dot-com bust and the 2020 pandemic recession, the price-to-rent ratio declined to between 90 and 100, suggesting that the ratio may be mean-reverting.
Housing price ratios have all risen to historic highs, also suggested by the z-scores2 in Table 1 that those ratios are significantly higher than the long-term average. Moreover, current z-scores are higher than they were before the housing bubble of 2008. Home prices have been outpacing income and rent in the past two years, suggesting that for the price-to-rent ratio to revert, the most likely way is via a decline in housing prices.3


The Tightening Cycle is Likely to Negatively Impact the Housing Market
Analyzing the behavior of the price-to-rent ratio, we find that the stronger and/or longer the tightening cycle, the more negative the impact on housing prices (Figure 3). Given that the rent-to-income ratio is already under pressure (Figure 2), rents may become even less affordable when the labor market starts to feel the impact of a hawkish Fed.

Bank Lending Standards Have Become Tighter
With continued interest rate hikes, lending conditions are likely to become tighter (Figure 4), and many potentials, first-time buyers are unlikely to qualify for a mortgage, further reducing for-sale housing demand.

2022 is Not 2007
Household Balance Sheets Have Improved Dramatically Since 2008Before the 2008
Before the 2008 housing crisis, household leverage was increasing continuously, with a historically high, household debt-to-disposable-income ratio of 134% and a household debt service ratio of 13% in 2007. Compared with 2008, household leverage is well below the peak of 2007, and the debt service ratio is below its long-term average (Figure 5). These ratios indicate that U.S. households are in a much better position to service their debt today than they were in 2007.

Mortgage delinquencies usually rise with an increasing unemployment rate (71% correlation of delinquencies as % of total mortgage loans to unemployment rate using quarterly data from 1979 to 2022). However, the unemployment and mortgage delinquency rates are both near historical lows. In the short term, based on their relationship, we do not expect to see a drastic jump in mortgage delinquency rates as was seen in 2007. This is due to the historically tight U.S. labor market, which continues to have almost two vacancies for every unemployed worker (Figure 6). This is much higher than the pre-pandemic level and higher than the recent historical norm of about 0.7 vacancies per unemployed worker since 2000.4

Moreover, household assets and net worth, relative to GDP, have increased significantly, compared to their peaks in 2007, while total liabilities continued to decline after the GFC and are at a much lower level than in 2007 (Figure 7).
Even though the Fed is expected to continue hiking interest rates, for-sale housing market may see a less severe price drop than in 2007. Given the tight labor market and robust household balance sheets today, we expect households to weather the storm of the housing market slowdown better than they did in 2007.

Mortgage Debt Credit Quality Is Much Better Today Than in 2007
Prior to the 2008 housing crisis, subprime mortgage originations (credit scores below 620)5 peaked in the first quarter of 2007, accounting for more than 15% of total mortgage originations, or $115 billion in volume, while super-prime loan originations with credit scores above 760 just represented 24% of total originations or $179 billion in volume during the same time period (Figure 8). Today (as of June 2022), subprime type originations have almost disappeared, with $22 billion in volume or only 3% of total originations, while super-prime originations dominate the mortgage market, soaring to $495 billion in volume or 65% of total originations.

In addition, the share of adjustable-rate mortgages (ARMs), which were one of the causes of the housing market crash,6 remains relatively small and below the long-term average, coming in at 10% in September 2022, compared to the peak of 37% before the housing market crash in 2007 (Figure 9). In contrast with a fixed-rate mortgage, an ARM is considered riskier. Borrowers with ARMs can become more financially fragile and face larger mortgage payments during tightening cycles that boost mortgage rates. Since both subprime mortgages and ARMs today are playing an insignificant role in the mortgage market, the overall mortgage market has become more stable and secure than was the case in 2007.

The Likelihood of Strategic Default Today is Low
Due to easing lending standards (Figure 4) and high household leverages (Figure 5) before 2008, the U.S. loan-to-value (LTV) ratio continued rising and peaked in June 2009 at 57%. Given the high LTV ratio at that point (Figure 10), strategic defaults7 by individual homeowners were common following the housing bubble bursting in 2007.8 After the COVID-19 pandemic, the U.S. housing market boomed dramatically, so someone who had purchased a house a year or more ago has likely seen a substantial increase in their equity. Today, the LTV ratio at 27% is close to its historical low and below the long-term average, suggesting that most mortgage borrowers would still have positive equity in their properties even if the housing market saw a significant correction. The value of home equity in the system paints a similar picture (Figure 11). Borrowers had consistently cashed out their homes right before the GFC, but that has not been the case in the current time period. With a lower LTV ratio and a lower leverage ratio, servicers see more value in working with stressed borrowers rather than moving to foreclose quickly as was the case in 2007. As a result, the likelihood of strategic default is lower today than in 2007.


Housing Has Been Underbuilt for Years
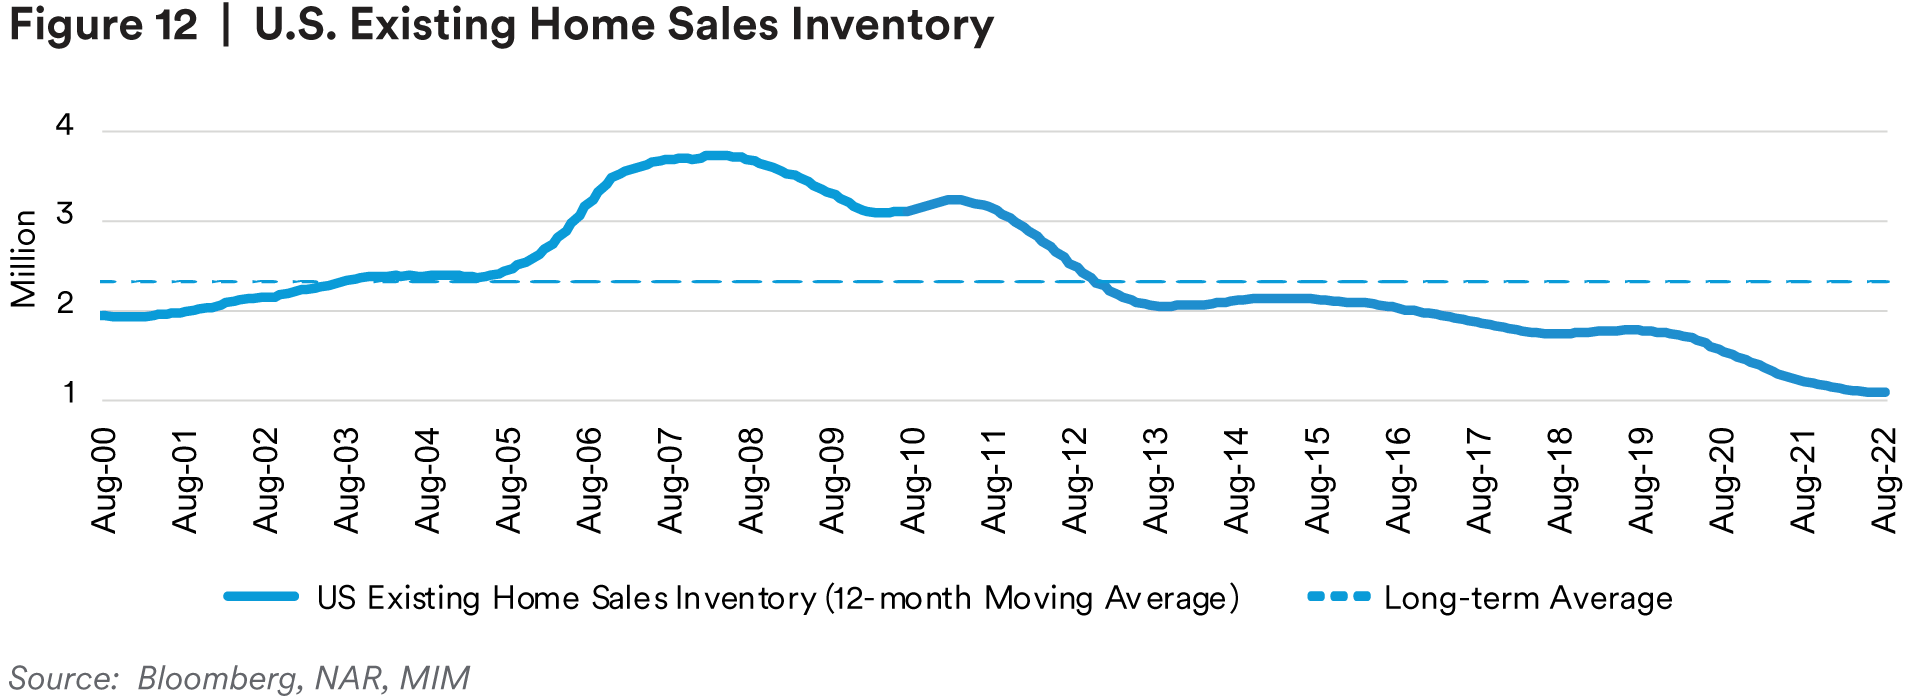
Housing inventory has been low for many years. Compared to peak inventories of 3.74 million in 2008, the most recent estimate barely came in at 1.1 million, much lower than the long-term average of 2.3 million (Figure 12). In the current U.S. housing market, the main factors behind a lack of building include a lack of building materials, labor shortages, and a lack of entitled land. The process of land entitlement usually is considered complicated, costly, and lengthy and can take anywhere from three to 12 months (at a minimum). Unlike the 2008 housing market, when overall supply grew excessively, today’s housing market is following a period of underbuilding and therefore may see a less severe supply/demand mismatch issue than in 2008.

Decline, Not Collapse
We believe that the U.S. housing market has passed its peak for this cycle due to rising interest rates, weakening demand, and tighter lending conditions. We thus expect to see a continued slowdown of price growth. However, we don’t believe the housing market today or in the near future will repeat the 2008 housing market crash. Household balance sheets are better, the overall credit quality of the mortgage loans in the market is better, strategic defaults are less likely, and housing has been underbuilt. Taking the factors mentioned above and our forecast of monetary policy into account,9 we anticipate the year-over-year growth of national home prices to slow to a positive single-digit rate at year-end 2022, turn negative in 1H23, and see a negative single-digit rate at year-end 2023. We remain optimistic about the housing market over the longer term.
Endnotes
1 FOMC Press Conference September 21, 2022.
2 Z-score is a metrics used to show how high or low the value relative to the average value using standard deviation as a unit. One z-score indicates that the current value is one standard deviation higher than the average value.
3 For example, to make the price-to-rent ratio lower, either price goes down or rent goes up. But the rent-to-income ratio is already under pressure. To make the price-to-income ratio lower, either price goes down or income goes up, but the tightening cycle is more like pulling down rather than pushing up income or GDP.
4 David Andolfatto and Serdar Birinci, “Is the Labor Market as Tight as It Seems?” Federal Reserve Bank of St. Louis, June 21, 2022.
5 According to FRBNY CCP/Equifax, credit scores below 620 are considered subprime. https://www.federalreserve.gov/econres/notes/feds-notes/the-role-of-credit-score-transitions-20190625.html
6 Colin McArthur and Sarah Edelman, “The 2008 Housing Crisis,” Center for American Progress, April 13, 2017.
7 A strategic default is a decision made by a borrower to stop repaying a mortgage. The decision is typically made when the price of a property has fallen below the amount due on the mortgage. Instead of waiting for conditions to change, the mortgage holder walks away from the property and the debt.
8 Julapa Jagtiani and William Lang, “Strategic Default on First and Second Lien Mortgages During the Financial Crisis,” Federal Reserve Bank of Philadelphia, December 9, 2010.
9 We continue to expect Fed Funds rate cuts in 2023, despite markets lowering their rate cuts expectations. We believe it relatively unlikely that the Fed will be able to maintain high rates for a long time. Moreover, the higher they hike over the next few quarters, the more likely they will have to cut moving forward in 2023.
Disclosure
This material is intended solely for Institutional Investors, Qualified Investors and Professional Investors. This analysis is not intended for distribution with Retail Investors.
This document has been prepared by MetLife Investment Management (“MIM”) solely for informational purposes and does not constitute a recommendation regarding any investments or the provision of any investment advice, or constitute or form part of any advertisement of, offer for sale or subscription of, solicitation or invitation of any offer or recommendation to purchase or subscribe for any securities or investment advisory services. The views expressed herein are solely those of MIM and do not necessarily reflect, nor are they necessarily consistent with, the views held by, or the forecasts utilized by, the entities within the MetLife enterprise that provide insurance products, annuities and employee benefit programs. The information and opinions presented or contained in this document are provided as of the date it was written. It should be understood that subsequent developments may materially affect the information contained in this document, which none of MIM, its affiliates, advisors or representatives are under an obligation to update, revise or affirm. It is not MIM’s intention to provide, and you may not rely on this document as providing, a recommendation with respect to any particular investment strategy or investment. Affiliates of MIM may perform services for, solicit business from, hold long or short positions in, or otherwise be interested in the investments (including derivatives) of any company mentioned herein. This document may contain forward-looking statements, as well as predictions, projections and forecasts of the economy or economic trends of the markets, which are not necessarily indicative of the future. Any or all forward-looking statements, as well as those included in any other material discussed at the presentation, may turn out to be wrong.
All investments involve risks including the potential for loss of principle and past performance does not guarantee similar future results.
In the U.S. this document is communicated by MetLife Investment Management, LLC (MIM, LLC), a U.S. Securities Exchange Commission registered investment adviser. MIM, LLC is a subsidiary of MetLife, Inc. and part of MetLife Investment Management. Registration with the SEC does not imply a certain level of skill or that the SEC has endorsed the investment advisor.
This document is being distributed by MetLife Investment Management Limited (“MIML”), authorised and regulated by the UK Financial Conduct Authority (FCA reference number 623761), registered address 1 Angel Lane, 8th Floor, London, EC4R 3AB, United Kingdom. This document is approved by MIML as a financial promotion for distribution in the UK. This document is only intended for, and may only be distributed to, investors in the UK and EEA who qualify as a “professional client” as defined under the Markets in Financial Instruments Directive (2014/65/EU), as implemented in the relevant EEA jurisdiction, and the retained EU law version of the same in the UK.
For investors in the Middle East: This document is directed at and intended for institutional investors (as such term is defined in the various jurisdictions) only. The recipient of this document acknowledges that (1) no regulator or governmental authority in the Gulf Cooperation Council (“GCC”) or the Middle East has reviewed or approved this document or the substance contained within it, (2) this document is not for general circulation in the GCC or the Middle East and is provided on a confidential basis to the addressee only, (3) MetLife Investment Management is not licensed or regulated by any regulatory or governmental authority in the Middle East or the GCC, and (4) this document does not constitute or form part of any investment advice or solicitation of investment products in the GCC or Middle East or in any jurisdiction in which the provision of investment advice or any solicitation would be unlawful under the securities laws of such jurisdiction (and this document is therefore not construed as such).
For investors in Japan: This document is being distributed by MetLife Asset Management Corp. (Japan) (“MAM”), 1-3 Kioicho, Chiyoda-ku, Tokyo 102-0094, Tokyo Garden Terrace KioiCho Kioi Tower 25F, a registered Financial Instruments Business Operator (“FIBO”) under the registration entry Director General of the Kanto Local Finance Bureau (FIBO) No. 2414.
For Investors in Hong Kong S.A.R.: This document is being issued by MetLife Investments Asia Limited (“MIAL”), a part of MIM, and it has not been reviewed by the Securities and Futures Commission of Hong Kong (“SFC”). MIAL is licensed by the Securities and Futures Commission for Type 1 (dealing in securities), Type 4 (advising on securities) and Type 9 (asset management) regulated activities.
For investors in Australia: This information is distributed by MIM LLC and is intended for “wholesale clients” as defined in section 761G of the Corporations Act 2001 (Cth) (the Act). MIM LLC exempt from the requirement to hold an Australian financial services license under the Act in respect of the financial services it provides to Australian clients. MIM LLC is regulated by the SEC under US law, which is different from Australian law.
MIMEL: For investors in the EEA, this document is being distributed by MetLife Investment Management Europe Limited (“MIMEL”), authorised and regulated by the Central Bank of Ireland (registered number: C451684), registered address 20 on Hatch, Lower Hatch Street, Dublin 2, Ireland. This document is approved by MIMEL as marketing communications for the purposes of the EU Directive 2014/65/EU on markets in financial instruments (“MiFID II”). Where MIMEL does not have an applicable cross-border licence, this document is only intended for, and may only be distributed on request to, investors in the EEA who qualify as a “professional client” as defined under MiFID II, as implemented in the relevant EEA jurisdiction.
1MetLife Investment Management (“MIM”) is MetLife, Inc.’s institutional management business and the marketing name for subsidiaries of MetLife that provide investment management services to MetLife’s general account, separate accounts and/ or unaffiliated/third party investors, including: Metropolitan Life Insurance Company, MetLife Investment Management, LLC, MetLife Investment Management Limited, MetLife Investments Limited, MetLife Investments Asia Limited, MetLife Latin America Asesorias e Inversiones Limitada, MetLife Asset Management Corp. (Japan), and MIM I LLC and MetLife Investment Management Europe Limited.


