The acute phase of the Middle East conflict appears to be passing. Headlines now point toward progress on an Iran–U.S. agreement following the ceasefire, and subsequent flare-ups have failed to move markets — a degree of “headline fatigue” that signals the FX and rates regime is rotating back toward relative rates, growth divergence and commodity dynamics rather than pure safe-haven flows. With the geopolitical premium fading, attention returns to two stubborn realities: Valuations are rich across nearly every spread sector, and inflation is proving sticky as the energy shock works through the system.
Our baseline is for 2026 U.S. growth to land broadly on par with 2025, as AI-related capital expenditure offsets a softening consumer and a still-disrupted housing market. Inflation is likely to remain elevated — near 3% at year end — keeping the Federal Reserve (Fed) patient, though we still expect a rate cut toward year end, as unemployment drifts higher, and the Fed looks through energy-driven inflation. We look for the 10-year Treasury yield to end 2026 near 4.25% (range 4.00–4.50%) with higher rate volatility, and for the fed funds rate to finish the year around 3.50% but potentially push a rate cut to 2027.
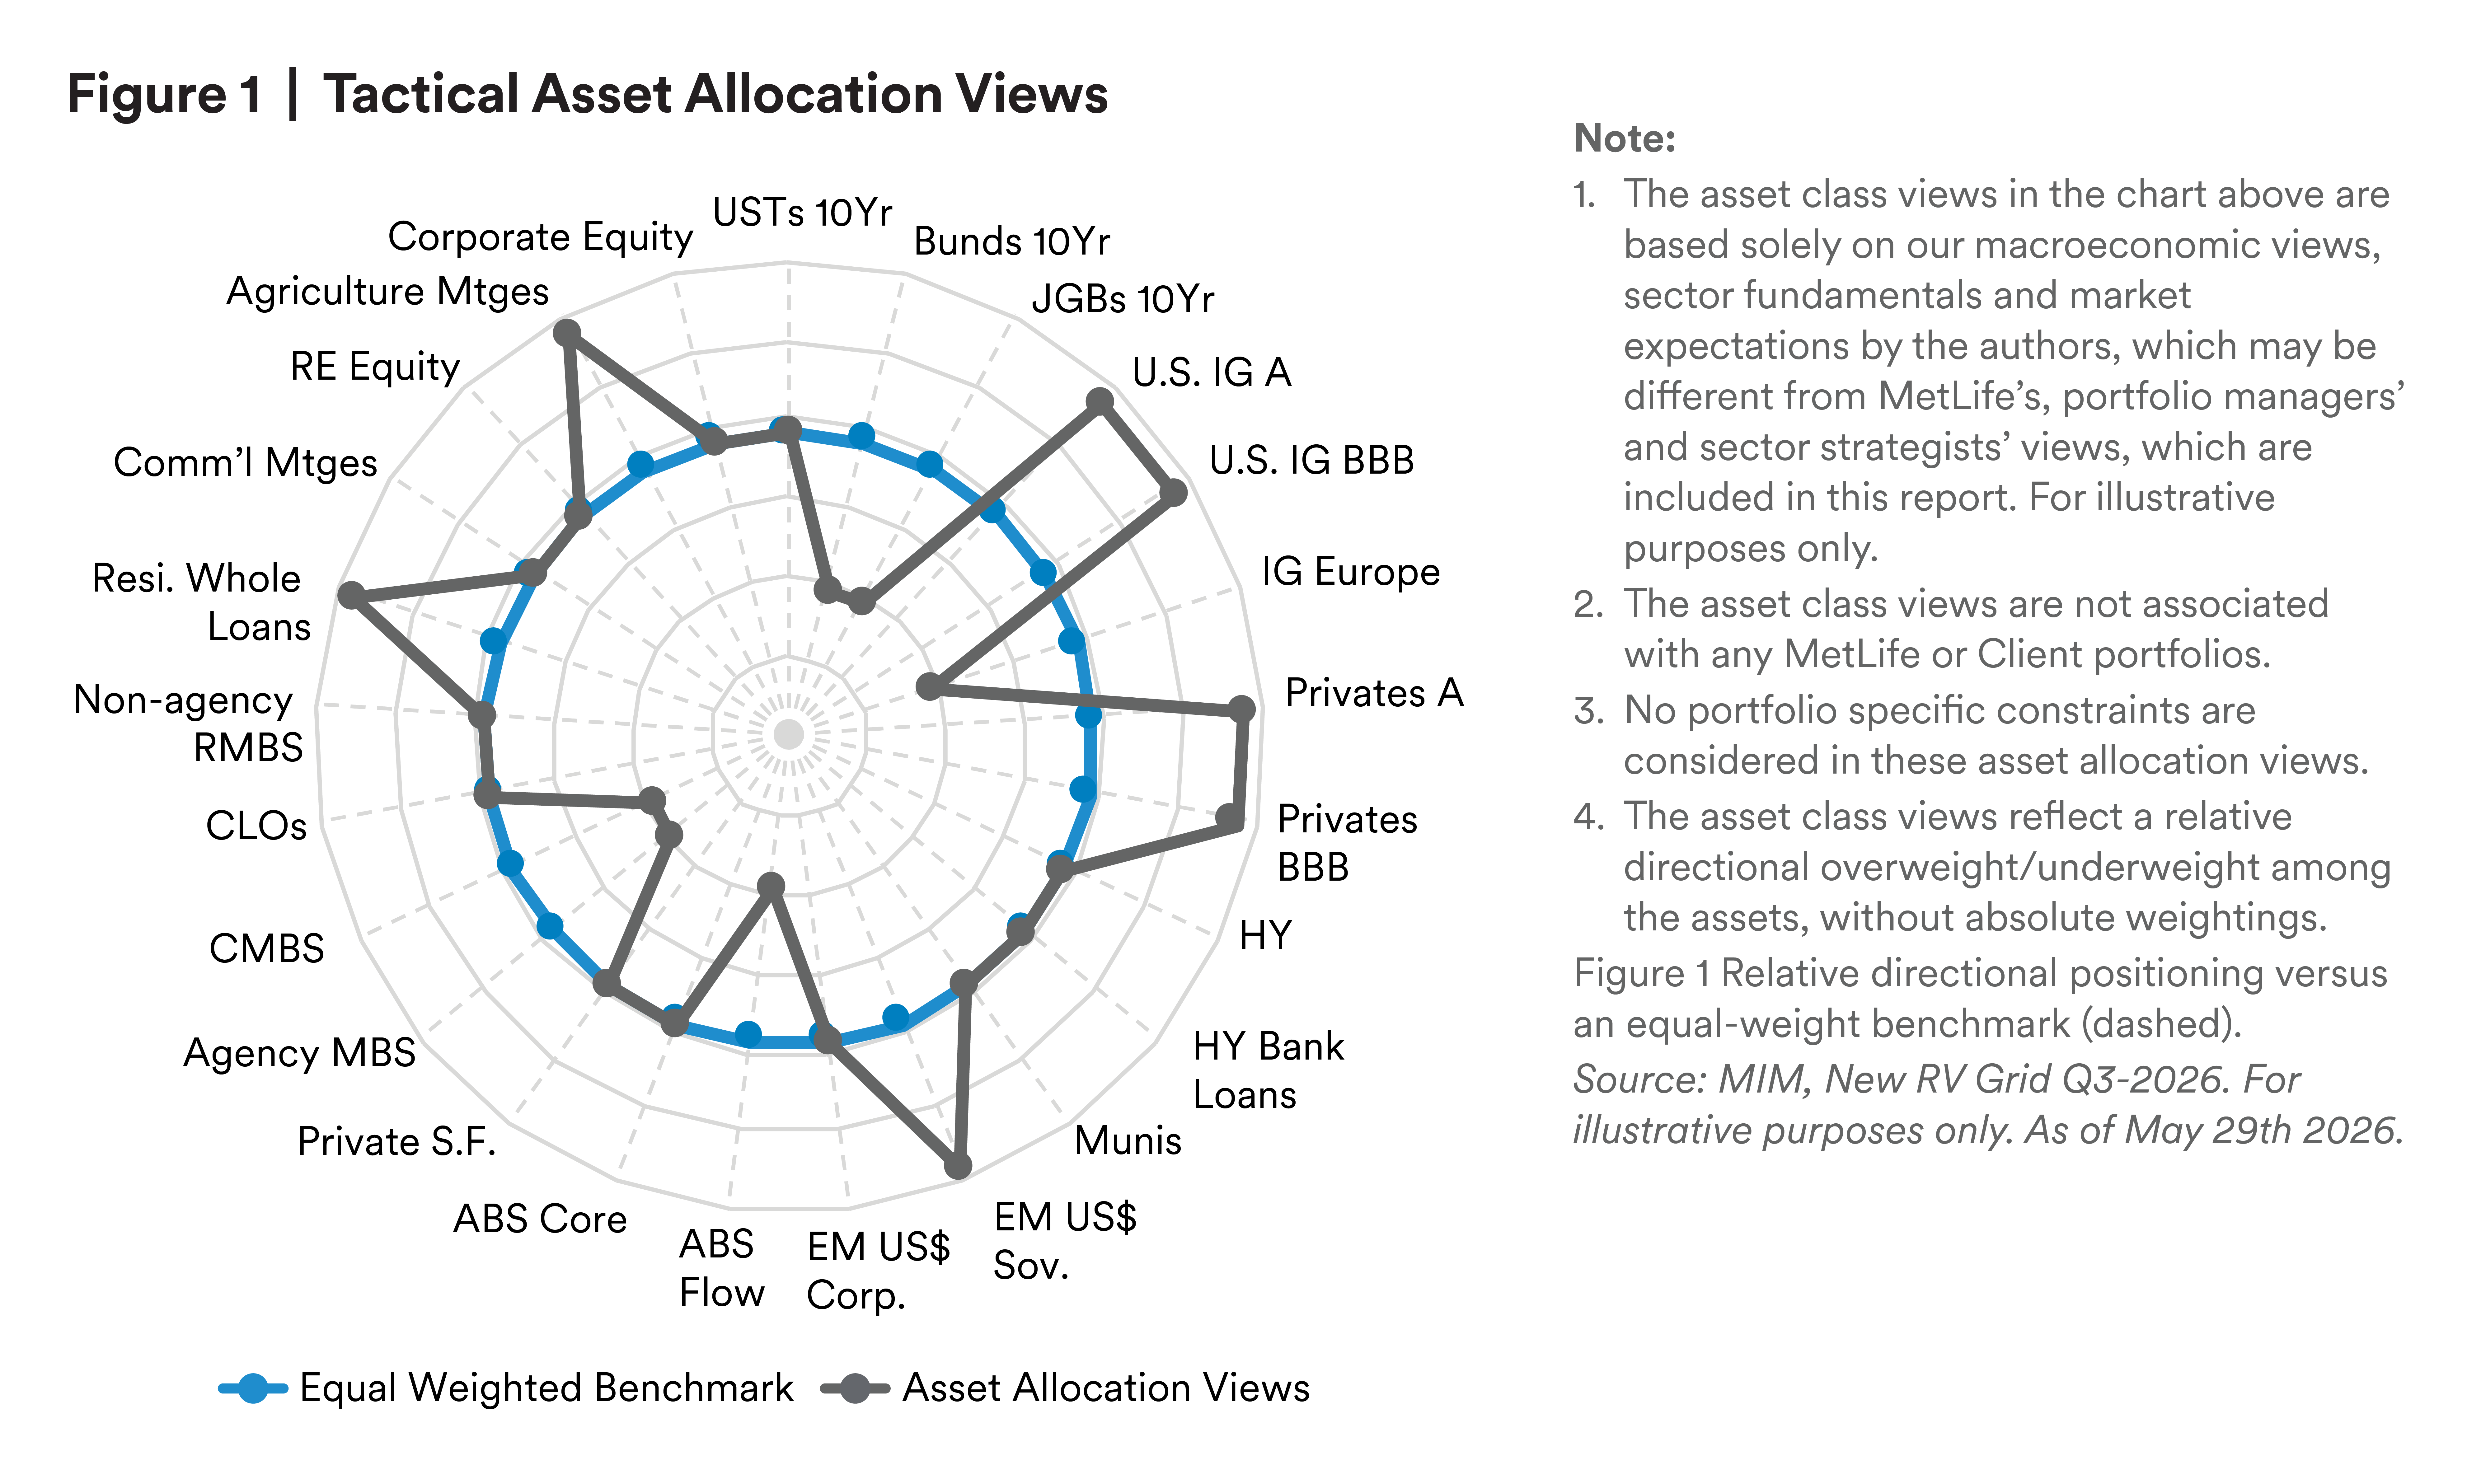
Against this backdrop, our tactical asset allocation views prioritize sectors where all-in yields and fundamentals still compensate for the risk — U.S. investment grade (public and private), emerging markets (EM) sovereigns, residential whole loans and agricultural mortgages — while underweighting low-spread, rate- and convexity-sensitive sectors with asymmetric downside: German Bunds, Japanese government bonds (JGB), European investment grade, agency mortgage-backed securities (MBS), commercial mortgage-backed securities (CMBS), asset-backed securities (ABS) and cash. The result is a barbell that leans into spread carry and security selection rather than duration or beta.
United States
Market Strategy expects 2026 growth to be on par with 2025, as AI-related CapEx expenditure offsets growing weakness in the consumer sector and a still-disrupted housing market. Inflation is likely to remain elevated as the situation in the Middle East lingers into the second half of the year. We see inflation near 3% at year end, look for the 10-year yield to end 2026 near 4.25%, and would not be surprised by a 4.00–4.50% range.
As the consumer slows, and unemployment ticks marginally higher, we continue to expect that a rate cut toward year end is possible, as the Fed looks through inflation that is likely to be drifting lower and focuses on the upward trajectory of unemployment and the potential downside risks to the economy, if the upper leg of the “K” economy begin to show signs of further stress.
Real income expectations indicate that even higher-income consumers are beginning to feel strained — results consistent with the sharp drop-off in the savings rate over the previous three months. The 1.7% drop in the savings rate has likely boosted growth by more than a percentage point and, at just 2.6%, this “support” for growth does not seem sustainable.
With income faltering, high-income consumers are increasingly reliant on equity market gains to sustain consumption. Here, the risk for disappointment in the AI-trade could have consequences far beyond the sector. CEOs already appear to be more cautious in their outlook for the speed of the investment flowing into higher productivity. If this translates into a rethinking of corporate investment into AI providers, it could undermine confidence in sustained equity market performance
Europe — Euro Area & U.K.
Euro Area: Real GDP contracted by 0.2% in Q1 2026 (third estimate, June 5) — a marked downward shift from Q4 2025 even after stripping out the unwind of Irish pharmaceutical exports — though still consistent with MIM’s 0.9% full-year 2026 forecast. With the Iran conflict dragging on longer than expected, MIM has raised its year-end inflation forecast to 3.0%, in line with market-based measures and the European Central Bank’s (ECB) own expectations. The ECB hiked in June for the first time since 2023, in response to the energy-led inflationary impulse, and lowered its full-year 2026 forecast. MIM expects a second 25-basis point (bp) hike in September — slightly below market — with potential reversals once indirect and second-round effects fade. Risks remain tilted to the downside as a durable, credible resolution to the conflict remains elusive.
U.K.: The U.K. continues to face adverse effects from the global energy-price shock. Inflation surprised to the downside in May (favorable base effects plus a reduction in the regulated household energy cap) but is expected to rise again by Q3 as those caps reset, reaching ~3.5%, year over year, by December. The Bank of England is still expected to hike by 50 bps toward year-end to counter these pressures. Growth has been revised up slightly to 0.9% (from 0.7%) but remains weaker than the prior two years, leaving a “stagflation-lite” scenario as the main near-term risk. We expect growth to pick up and inflation to decline in 2027.
Asia — China, Japan & the Region
China: China’s macro picture is one of uneven rather than broken growth — April activity was soft, with industrial production up a tad, fixed asset investment down 8%, and retail sales flat, tracking Q2 GDP toward the lower end of the 4.5–5% target range, though May trade data offered a brighter spot with exports surging 19.3% YoY (a three-month high) generating a record $105.4 billion trade surplus, even if the export strength largely reflects a favorable base effect from last year’s tariff war peak. Against this backdrop, the policy easing threshold remains high as growth is being supported by exports offsetting weak domestic demand. At the same time, oil-led reflation complicates the case for rate cuts, and so the most likely path is continued low-profile accommodation through ample interbank liquidity and a modest fiscal impulse, with no meaningful shift in language or broad easing unless exports deteriorate materially. For rates, the 10-year CGB yield has retraced roughly 20bps from its January peak to re-test 1.70%, underpinned structurally by weak credit demand and the PBOC’s explicit endorsement of bank bond investment, though three consecutive months of liquidity drainage has begun normalizing repo rates and reducing carry, arguing for a neutral stance until rate cut expectations re-emerge. Our baseline for end-year 10-year CGB yield remains unchanged at 1.70%. For FX, CNY has appreciated over 3% versus the USD YTD, driven in part by strong export conversion flows, PBOC comfort with orderly (but not excessive) appreciation, and AI-driven equity resilience. That said, CNY strength looks vulnerable to any export slowdown in coming months, with the USDCNY likely to hover around 6.75–6.80 near term and potentially drifting toward 6.80–6.90 on weaker data, though Xi’s expected September state visit to the US could provide an anchor for CNY as Beijing historically favors a stronger currency both to project geopolitical strength and to pre-empt US Treasury accusations of currency manipulation.
Japan: Tokyo and nationwide CPI data have softened at the headline level — BoJ core CPI slowed to 1.6%yoy in May from 1.9% in April, dragged down largely by institutional factors such as a water-charge waiver and easing food prices, while April nationwide core CPI fell to 1.4% from 1.8% on government anti-inflation measures including gasoline subsidies and free school tuition. That said, underlying inflation remains persistent, with food inflation holding near 4%, services above 2%, and 10-year inflation expectations hitting a record 2.35%, above the BoJ’s own target, as supply bottlenecks, JPY weakness, and fiscal expansion concerns entrench a re-acceleration narrative into summer. Against this backdrop, the BoJ has turned decisively more hawkish; growth has been revised down to around potential while inflation forecasts have been marked higher on energy, commodity, and FX pass-through. Meanwhile, at least four of nine Policy Board members already favor a hike at the June MPM meeting while Governor Ueda has voiced concerns about the BoJ falling behind the curve. Our baseline remains a 25-bp hike next week and again in Q4, supported by a domestic backdrop of strong corporate profits, ongoing wage gains supporting headline inflation and loose fiscal conditions (including a JPY3.1tr deficit-financed supplementary budget and an advancing food CT cut to 1% that will mechanically suppress headline CPI but leave core pressure intact ). The broader risk for the BoJ is that a failure to hike could further entrench inflation expectations, put renewed downward pressure on JPY, and ultimately force a more disruptive tightening cycle later. For rates, we revised up our end-year 10-year JGB yield to 2.80% (vs 2.3% previously).
Rest of Asia: Regional growth prospects are steadier as trade tensions ease, with central banks nearing the end of their cutting cycles, even as energy-importing economies remain exposed to sustained oil strength.
Latin America
Latin America’s backdrop has turned more challenging: The oil-price shock and El Niño-related agricultural risks have revived inflation pressures, while a heavy political calendar (elections in Peru, Colombia and Brazil, reforms in Chile and a United States-Mexico-Canada Agreement (USMCA) review for Mexico) adds policy uncertainty. Regional growth is set to run around ~2% in 2026, slightly weaker than earlier projected, after a soft Q1. Commodity exporters such as Brazil and Colombia benefit from improved terms of trade, while net oil importers (Mexico, Chile, Peru, Uruguay) face a tougher inflation-growth trade-off. Inflation is rebounding above many central-bank targets, though longer-term expectations remain largely anchored. Monetary policy has pivoted toward caution — many banks have paused or slowed cuts, and some may contemplate hikes — keeping local rates higher for longer and financial conditions relatively restrictive. The net result is a still-resilient but more risk-tempered regional outlook.
U.S. Treasuries (UST)
We continue to see 2026 resembling 2025, with some downside risks to growth and upside risks to inflation. We expect the Fed to lower rates, as the unemployment rate increases modestly over the year, but with nominal growth holding up we look for 10-year yields to remain above 4%, ending the year near 4.25% with elevated volatility. With the curve offering limited term premium and a possible year-end cut already partly discounted, we moved Treasuries to neutral — valuable for liquidity and resilience but offering less compelling carry than higher-quality spread product.
German Bunds
Bunds remain supported by strong fundamentals and continued demand for high-quality debt, but the balance of risks is to higher yields. MIM expects long-end yields to rise to around 3.10% by year-end, as accelerated defense spending toward year-end, combined with decelerating pension demand, shifts the supply/demand balance, while upward pressure from inflation is likely to persist following the ECB’s June hike. On a USD basis, the all-in yield remains unattractive relative to U.S. alternatives, underpinning our underweight.
Japanese Government Bonds (JGBs)
With the BoJ turning more hawkish and our end-year 10-year JGB forecast revised up to 2.80%, the asset class faces a clear rate-rise headwind. Persistent underlying inflation, record-high inflation expectations, and our baseline for two further hikes this year leave duration exposure asymmetrically skewed to losses, and the USD-hedged yield remains uncompetitive. We stay underweight.
Macro Credit Overview
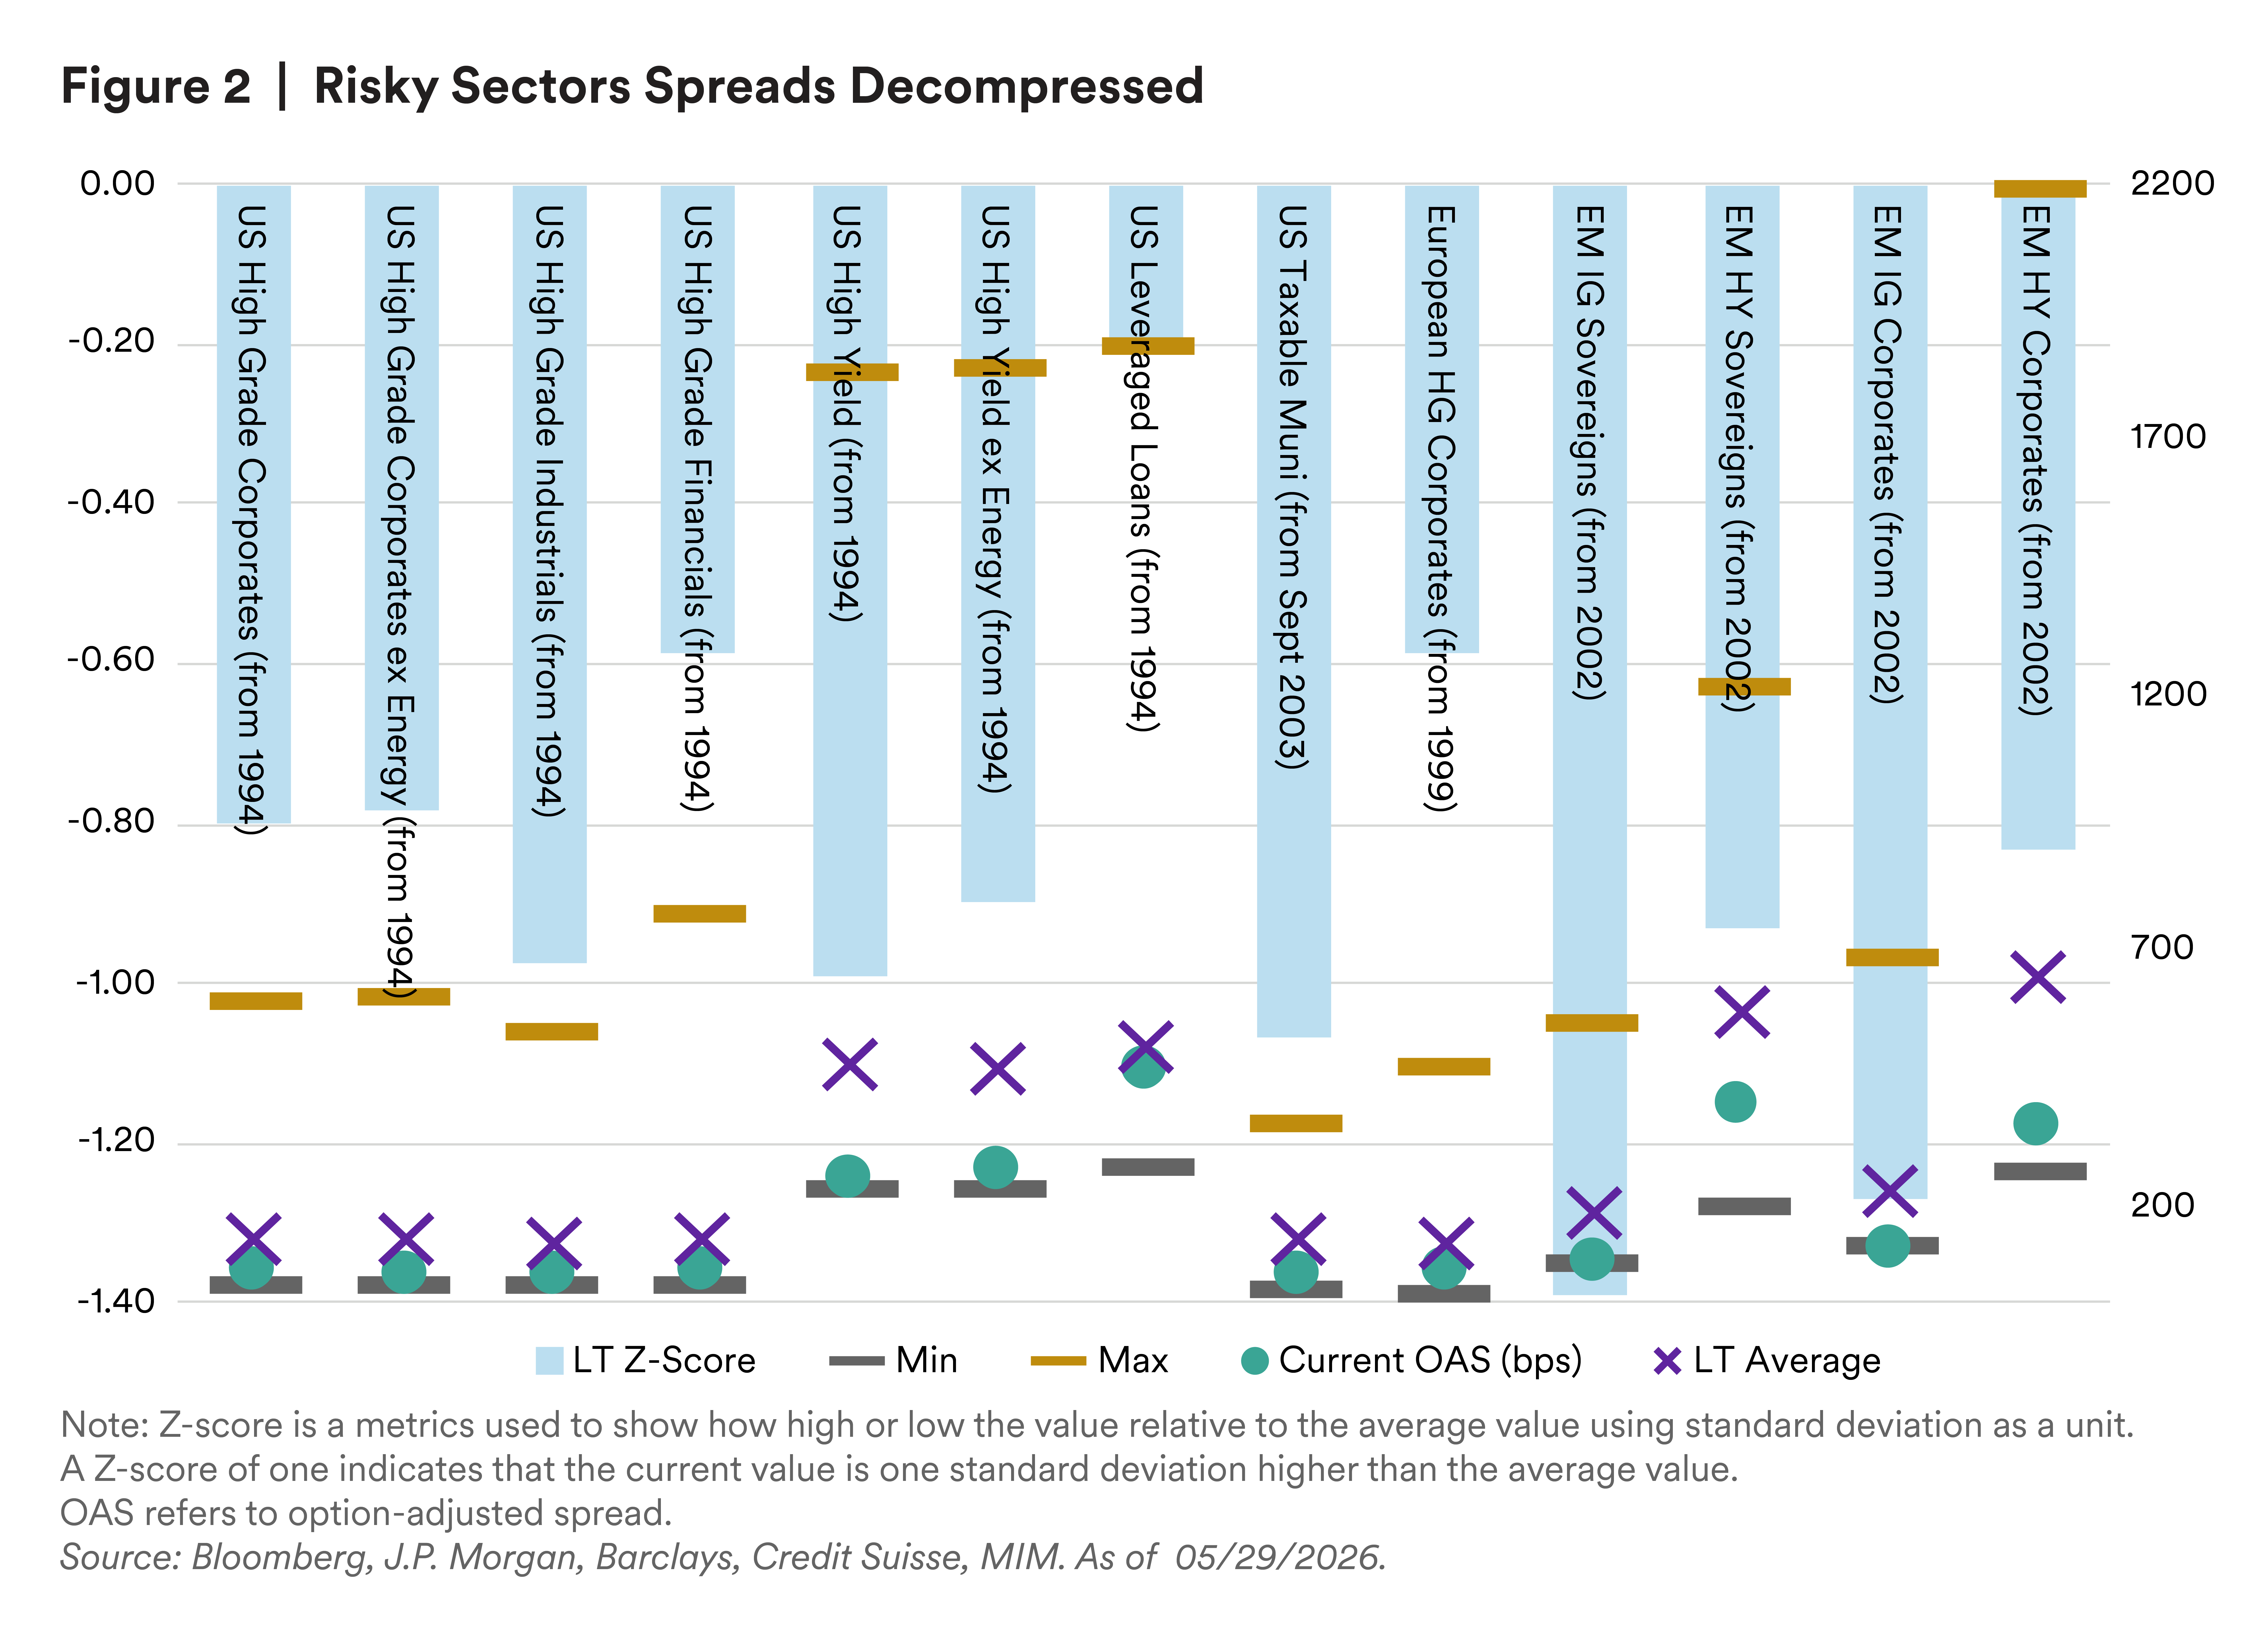
Credit-cycle conditions continued to improve from last quarter, with four of seven indicators advancing. The 3-month/10-year spread and Fed policy both improved, with Fed policy shifting from neutral to a more accommodative stance, while profit growth kept improving. U.S. investment grade and high yield fundamentals from Capital IQ remain resilient — coverage ratios improved for both, and Q1 earnings came in well above expectations (S&P 500 1Q26 EPS +29.4%, year over year, smashing the +11.0% estimate, with FY26 EPS growth now seen near +22.8%). The notable soft spot is investment grade, free-cash-flow-to-total-debt, which has declined for four consecutive quarters and now sits below its long-term average. The one alarming indicator is the U.S. default rate, which rose from 4.7% to 5.15% in April, passing above our 5% alert threshold. That said, J.P. Morgan notes there were no payment defaults or distressed exchanges in May — the first such shutout since August 2018 — pulling the trailing par-weighted, high yield bond default rate down to roughly 2.0%. J.P. Morgan forecasts a 2026 HY default rate of 1.75% and a leveraged-loan rate of 3.0%, while Moody’s sees the rate trending down toward 3.3% by year end. Crucially for positioning, spreads have resumed compressing, leaving leveraged loans more attractive than high yield on valuation and EM high yield having tightened materially (See figure 2).
U.S. Investment Grade (IG)
IG spreads remain near all-time tights despite heavy issuance (~$955 billion YTD), as strong demand for yield continues to absorb supply, while higher Treasury yields have flattened long-end spread curves back to early-year levels. Geopolitical risk has partially eased — subsequent flare-ups have failed to move markets — and hyperscaler capex and data center financing have re-emerged as the dominant supply themes. Although valuations are rich, and the setup is vulnerable to a catalyst, spreads have proven remarkably resilient over the past three years outside episodic shocks, and underlying fundamentals have broadly held in (improving EBITDA margins, declining net leverage) — the lone fragility being free cash flow to total debt. Given compelling all-in yields and resilient fundamentals, we are overweight U.S. IG — but emphatically up in quality, favoring a selective, defensive and opportunistic approach, with an emphasis on credit selection and curve positioning.
European Investment Grade (IG)
European Q1 EPS growth surprised modestly to the upside, with softness in cyclicals (materials, autos) more than offset by beats in financials and energy. Euro option-adjusted spreads (OAS) widened gradually through Q1 with some evidence of decompression (BBB +22 bps vs. AAA +6 bps) before closing back near post-global financial crisis (GFC) tights around 77 bps. Euro IG issuance set a record Q1 of €215 billion — highlighted by Amazon’s €14 billion jumbo — with the full-year forecast near €750 billion, driven by hyperscaler funding, reverse Yankees and M&A. Even adjusting for the USD pick-up after swapping, the euro all-in yield remains unappealing versus U.S. IG, and with spreads back to post-GFC tights against abundant macro and geopolitical risk, we recommend a cautious route — underweight — preferring to add only in quality names rather than chase spread or yield at current levels.
High Yield (HY)
We expect positive, carry-based total returns for the high yield bond market. The asset class remains supported by a resilient U.S. economy, adequate credit fundamentals and moderate default expectations, and the new-issue market is healthy, with 2026 volume expected to exceed last year’s strong issuance. However, with spreads re-compressing and dispersion set to increase through the year, security selection — and avoiding credit blow-ups — will drive performance. Given rich valuations relative to loans, we remain neutral, prioritizing downside management over reaching for beta.
Leveraged/Bank Loans
Bank loans look more attractive than HY on valuation this quarter. We maintain a preference for an up-in-quality approach, as macro moderation should remain supportive of loans in 2026, absent further Middle East escalation and prolonged oil-supply disruption. The secured overnight financing rate (SOFR) forward curve has drifted higher on inflation concerns, benefiting the asset class from a return perspective, while the loan market has rallied alongside equities on strong technicals and robust collateralized loan obligation (CLO) demand. Strategists call for carry-type returns in 2026, as robust refinancing activity and a revival of corporate animal spirits — supported by deregulation and lower corporate taxes — set the stage for renewed M&A and balance-sheet activity, which an up-in-quality posture is designed to navigate. On balance, we remain neutral on bank loans.
Municipals
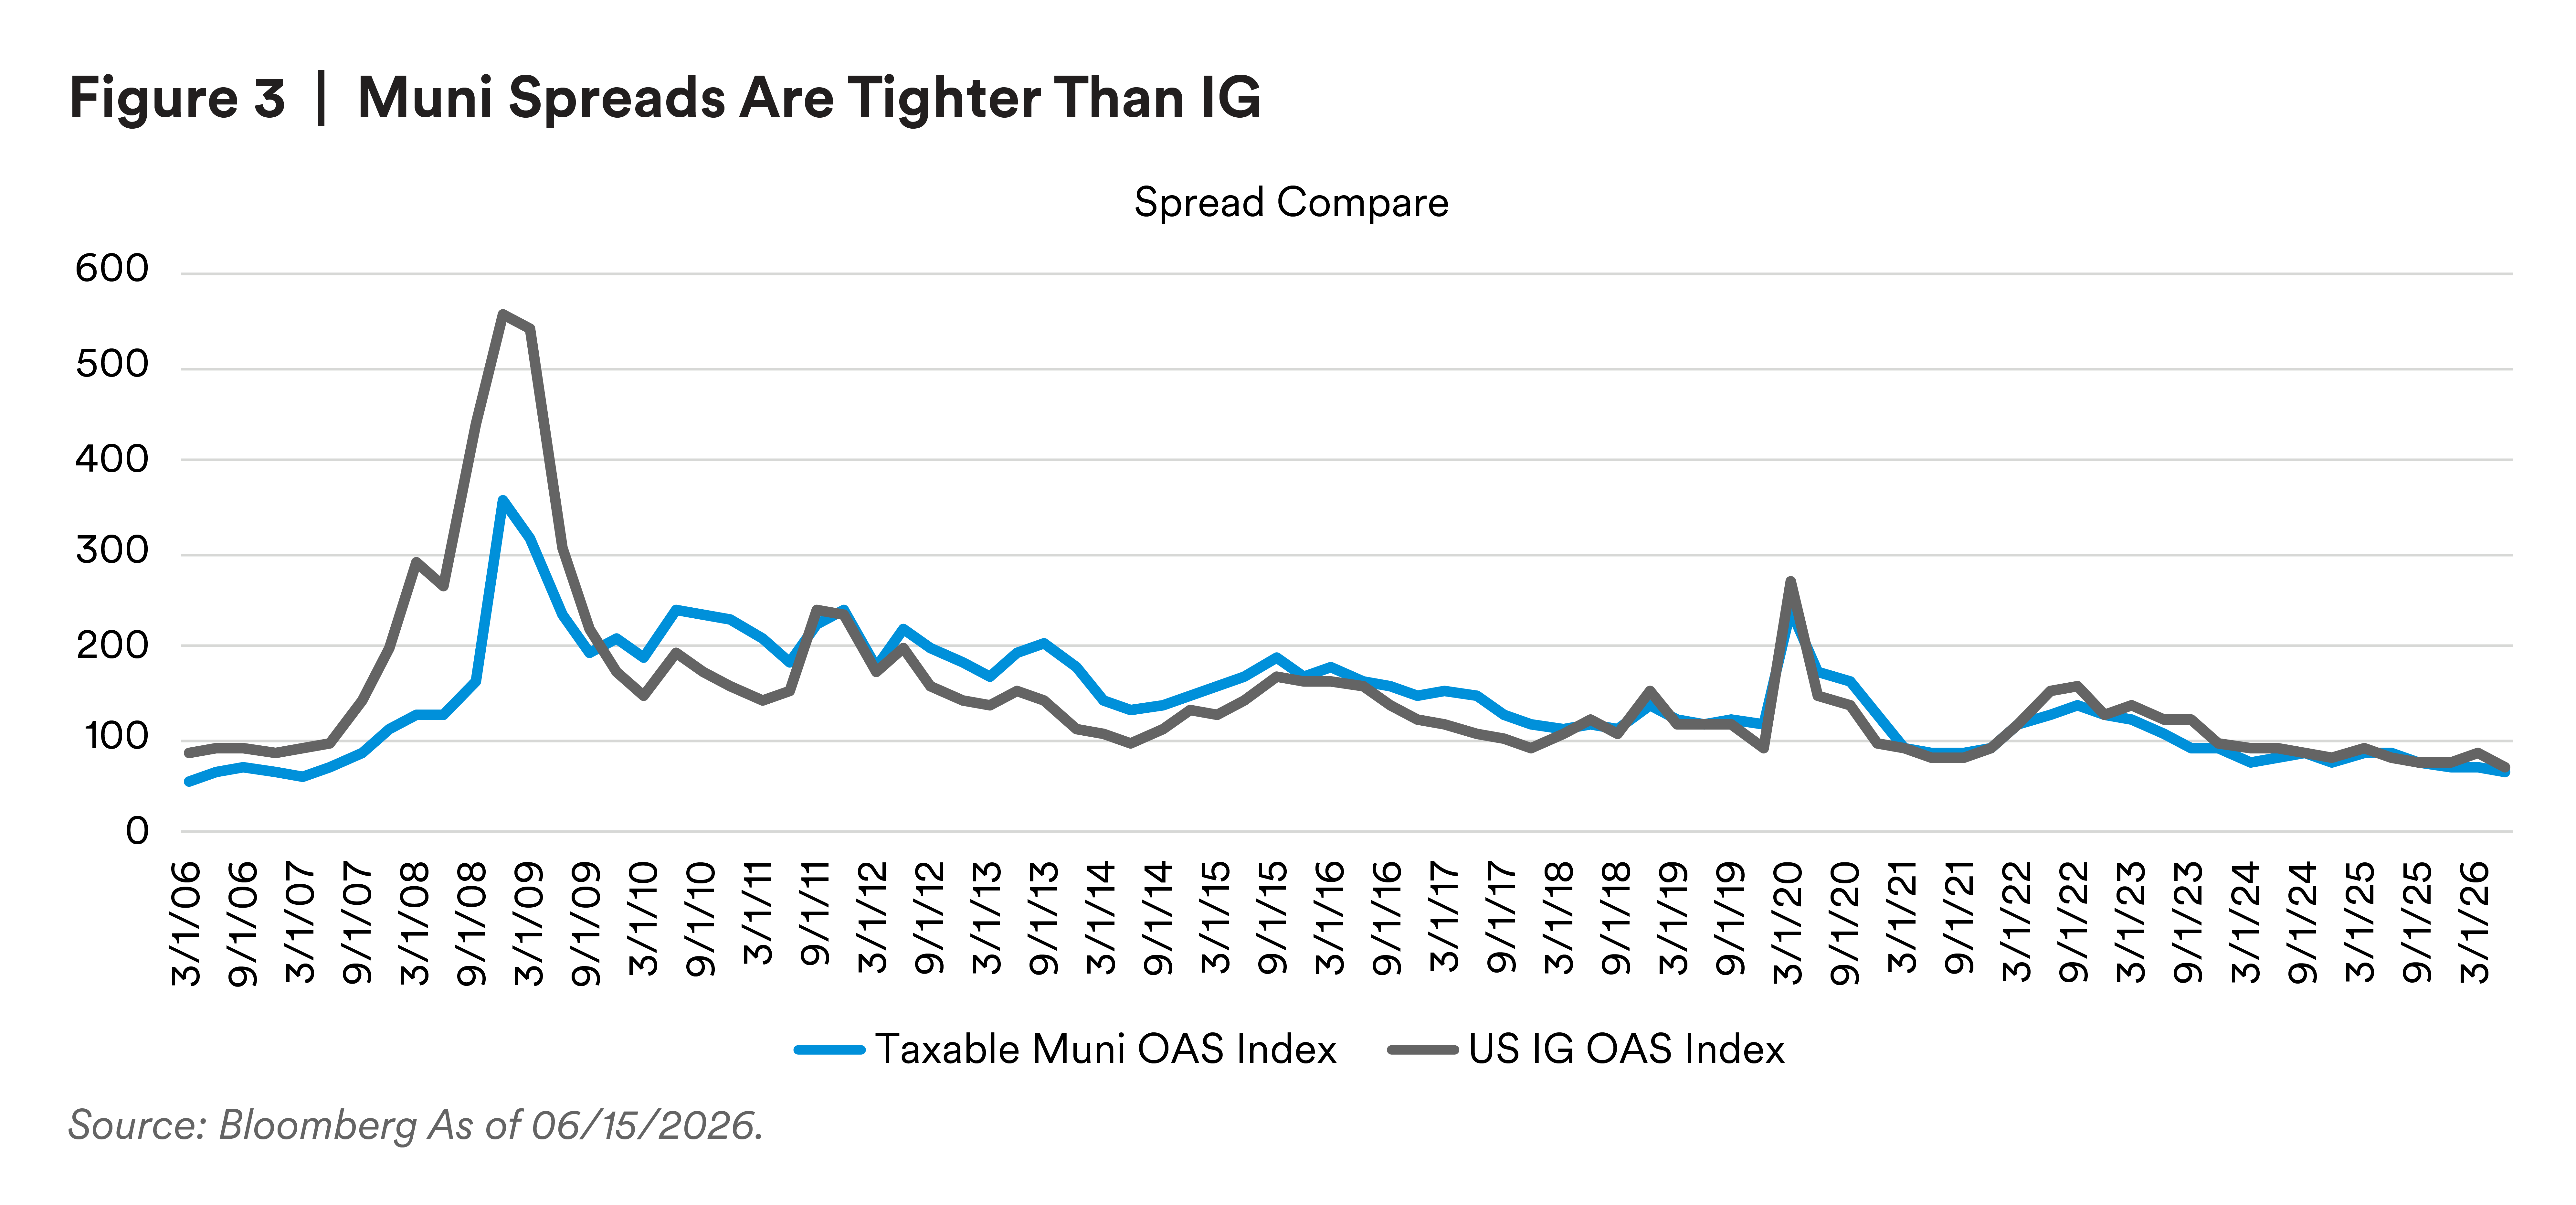
The narrow trading range in taxable municipal spreads is likely to persist as long as the balance between yields, supply and fundamentals holds — in Q1, the entire range from tightest to widest OAS for the Bloomberg Aggregate Eligible Taxable Municipal index was just five bps. Our baseline is for the index OAS to remain in a narrow band around 70 bps, only a few basis points off all-time tights, supported by limited supply, elevated yields and solid municipal fundamentals. The two most likely vectors for volatility are (a) rates — particularly how the Iran situation feeds through to oil, inflation and growth — and (b) heavy IG issuance, namely sustained hyperscaler supply to fund the AI build-out. Notably, hyperscaler new-issue spreads have priced considerably wider than similarly-rated taxable munis, and a large taxable-muni new issue could force a market-clearing repricing wider (see figure 3). In this compressed-spread environment, we favor minimizing downside risk over reaching down the credit structure, and liquidity spectrum — focusing on larger deals from issuers with sound fundamentals, predictable cash flows and limited optionality — and look to carry as the path to excess returns. We moved municipals from underweight to neutral.
 Emerging Markets (EM) — Sovereigns & Corporates
The macro environment remains the key driver of EM credit, but EM assets have shown resilience following the conflict, supported by stable-to-improving sovereign fundamentals. We are overweight EM sovereigns for their relatively long duration compared to EM corporates and our view of lower benchmark rates from a short-term technical mean reversion. Fiscal discipline, improved monetary frameworks and multilateral engagement underpin macro stability, and additional rising stars are expected over the medium term on positive fiscal and policy momentum. Political risk has been relatively contained, with broadly market-friendly election developments across Hungary, Colombia, Peru and Brazil. Regarding EM corporates, we downgraded to neutral: Balance sheets are healthy with manageable leverage and adequate margins; valuations are attractive on a spread-per-turn-of-leverage basis versus U.S. credit; and EM high yield has outperformed — but EM high yield spreads have tightened materially this quarter, tempering the relative-value case. A potential continuation of USD weakness, as conditions stabilize, could ultimately bolster flows into local-currency strategies.
Asset-Backed Securities (ABS) — Flow & Core
ABS issuance remains at record pace — roughly $103 billion in Q1 (about 110% of last year’s pace) — with fiber and data center exposure now near 10% of supply and ARD structures around 30% of outstanding balances. Auto fundamentals were bolstered by a rebound in used-car prices, and collateral performance is stable (debt service coverage ratio holding near 3.25), but consumer credit is mixed: credit-card delinquencies have moderated while subprime auto remains pressured. With spreads at multi-year tights and persistent pressure on the U.S. consumer — particularly lower-FICO households — we are underweight liquid-flow ABS, while holding core ABS at neutral where structural protection and collateral quality are stronger.
Asset-Backed Finance (ABF)
The private ABF market saw a high volume of new-issue activity in Q2, met by equally strong demand, with the MIM ABF team evaluating $30 billion+ of pipeline opportunities. Despite business development company-market stress and geopolitical noise, ABF spreads have continued to tighten (10–15 bps, quarter over quarter) and now sit at multi-year tights, with a flattening of the pricing basis between top-tier and lower-tier issuers. Esoteric sectors such as Fund Finance and Energy Proved Developed Producing (PDP) have seen investor bases broaden, pushing recent prints into the low-200s (and occasionally high-100s) bps. We are watching rising net asset value-loan leverage in Fund Finance (approaching 40% loan to value (LTV)) and software exposure carefully, and our tactical focus remains on higher-FICO consumer collateral with strong structural protection. The Q3 pipeline looks robust across consumer credit, equipment, C-PACE, Energy PDP, agriculture and Fund Finance. With spreads rich, and our concern on the consumer side, we downgraded the sector from overweight to neutral, while remaining constructive on selective origination.
Collateralized Loan Obligations (CLOs)
CLO new issuance reached roughly $50 billion in Q1 (about 101% of pace) alongside $9 billion of middle-market volume and $53 billion of refi/reset activity, though momentum has slowed. Fundamentals are mixed — weighted-average rating factors have improved, while distressed ratios have edged up, and recovery rates run below historical averages — and weighted-average spreads have ground tighter toward a two-year low near 310 bps on strong demand. With a slower Fed-cut path keeping floating-rate product attractive but credit conditions weakening at the margin, we maintain CLOs at neutral.
Commercial Mortgage-Backed Securities (CMBS)
CMBS issuance reached roughly $52 billion in Q1 (about 106% of pace), with Sustainable Accounting Standards Board (SASB) transactions dominating at ~75% of supply and the conduit market largely transitioned to five-year structures, making longer-duration exposure harder to source. Credit performance is bifurcated: Delinquencies remain elevated in conduit and SASB, with office the most challenged property type, even as commercial real estate CLO performance improves. With underwriting metrics loosening modestly (rising LTVs) and spreads tight, we are underweight CMBS, recognizing that much of the office stress is reflected in pricing but the risk/reward remains unappealing at the index level.
Agency MBS
Agency RMBS continues to benefit from defensive characteristics and technical support, but with spreads tight and our baseline calling for falling rates from mean reversion and a more volatile rates environment, the convexity profile and relatively higher duration of the sector are likely to drag on returns within our base case. Agency MBS would serve as a relative safe haven if macro volatility spikes, but absent that, we are underweight, preferring carry elsewhere.
Non-Agency RMBS
Mortgage markets saw particularly strong Q1 activity — roughly $74 billion of issuance (about 167% of pace) — driven by elevated non-qualified mortgage and prime production, with single-family borrower home equity rebounding toward ~$35 trillion. Fundamentals remain broadly stable, but heavy supply has left valuations near the tight end of the two-year range. The outlook emphasizes careful security selection, as prepayment and convexity challenges come into focus, with opportunities in discounted prime and subordinate bonds and shorter-duration closed-end second liens. We hold non-agency RMBS at neutral.
Residential Whole Loans
Housing fundamentals remain stable, with demand expected to increase materially if affordability improves through lower lending rates. While some regions have seen minor home-price softness, low purchase LTVs (well below 80%) make material delinquency increases unlikely. Actual losses continue to outperform modeled losses at the time of trade, and trade structuring that keeps purchase prices near 101 limits yield degradation despite elevated prepayment risk. Loss-adjusted spreads for residential whole loans and single-family rental financing — in the very low 200s on a blended basis — offer strong relative value versus public residential credit, and MIM is actively expanding supply by onboarding new sellers. The sector remains one of the most attractive in the current environment, and we are overweight.
Commercial Mortgages (CML) | Real Estate Equity
Commercial real estate is showing clearer signs of stabilization, supported by a significant contraction in the construction pipeline and improving transaction volumes — up 27% in 2025 versus 2024, with the first four months of 2026 tracking 14% above 2025 and full-year volume expected ~20% higher. Multifamily and industrial are benefiting from sharply reduced supply growth; retail vacancy is the lowest on record; hotels face cyclical headwinds from softer consumer confidence; and office continues to recover, with the national vacancy rate improving to 18.8% and property prices rising in Q1 2026. On valuations, unlevered equity discount rates remain consistent with Baa corporates plus ~200 bps, suggesting real estate equity is fairly priced, while the more liquid CML segments are similarly fairly valued (stronger relative value sits further down the capital structure in mezzanine/preferred). Debt capital markets remain strong, with life-company originations near multi-year highs. With fundamentals, valuations and technicals all near “normal,” we hold both CML and real estate equity at neutral, noting that the best forward opportunities typically emerge as transaction volumes accelerate.
Agricultural Mortgages
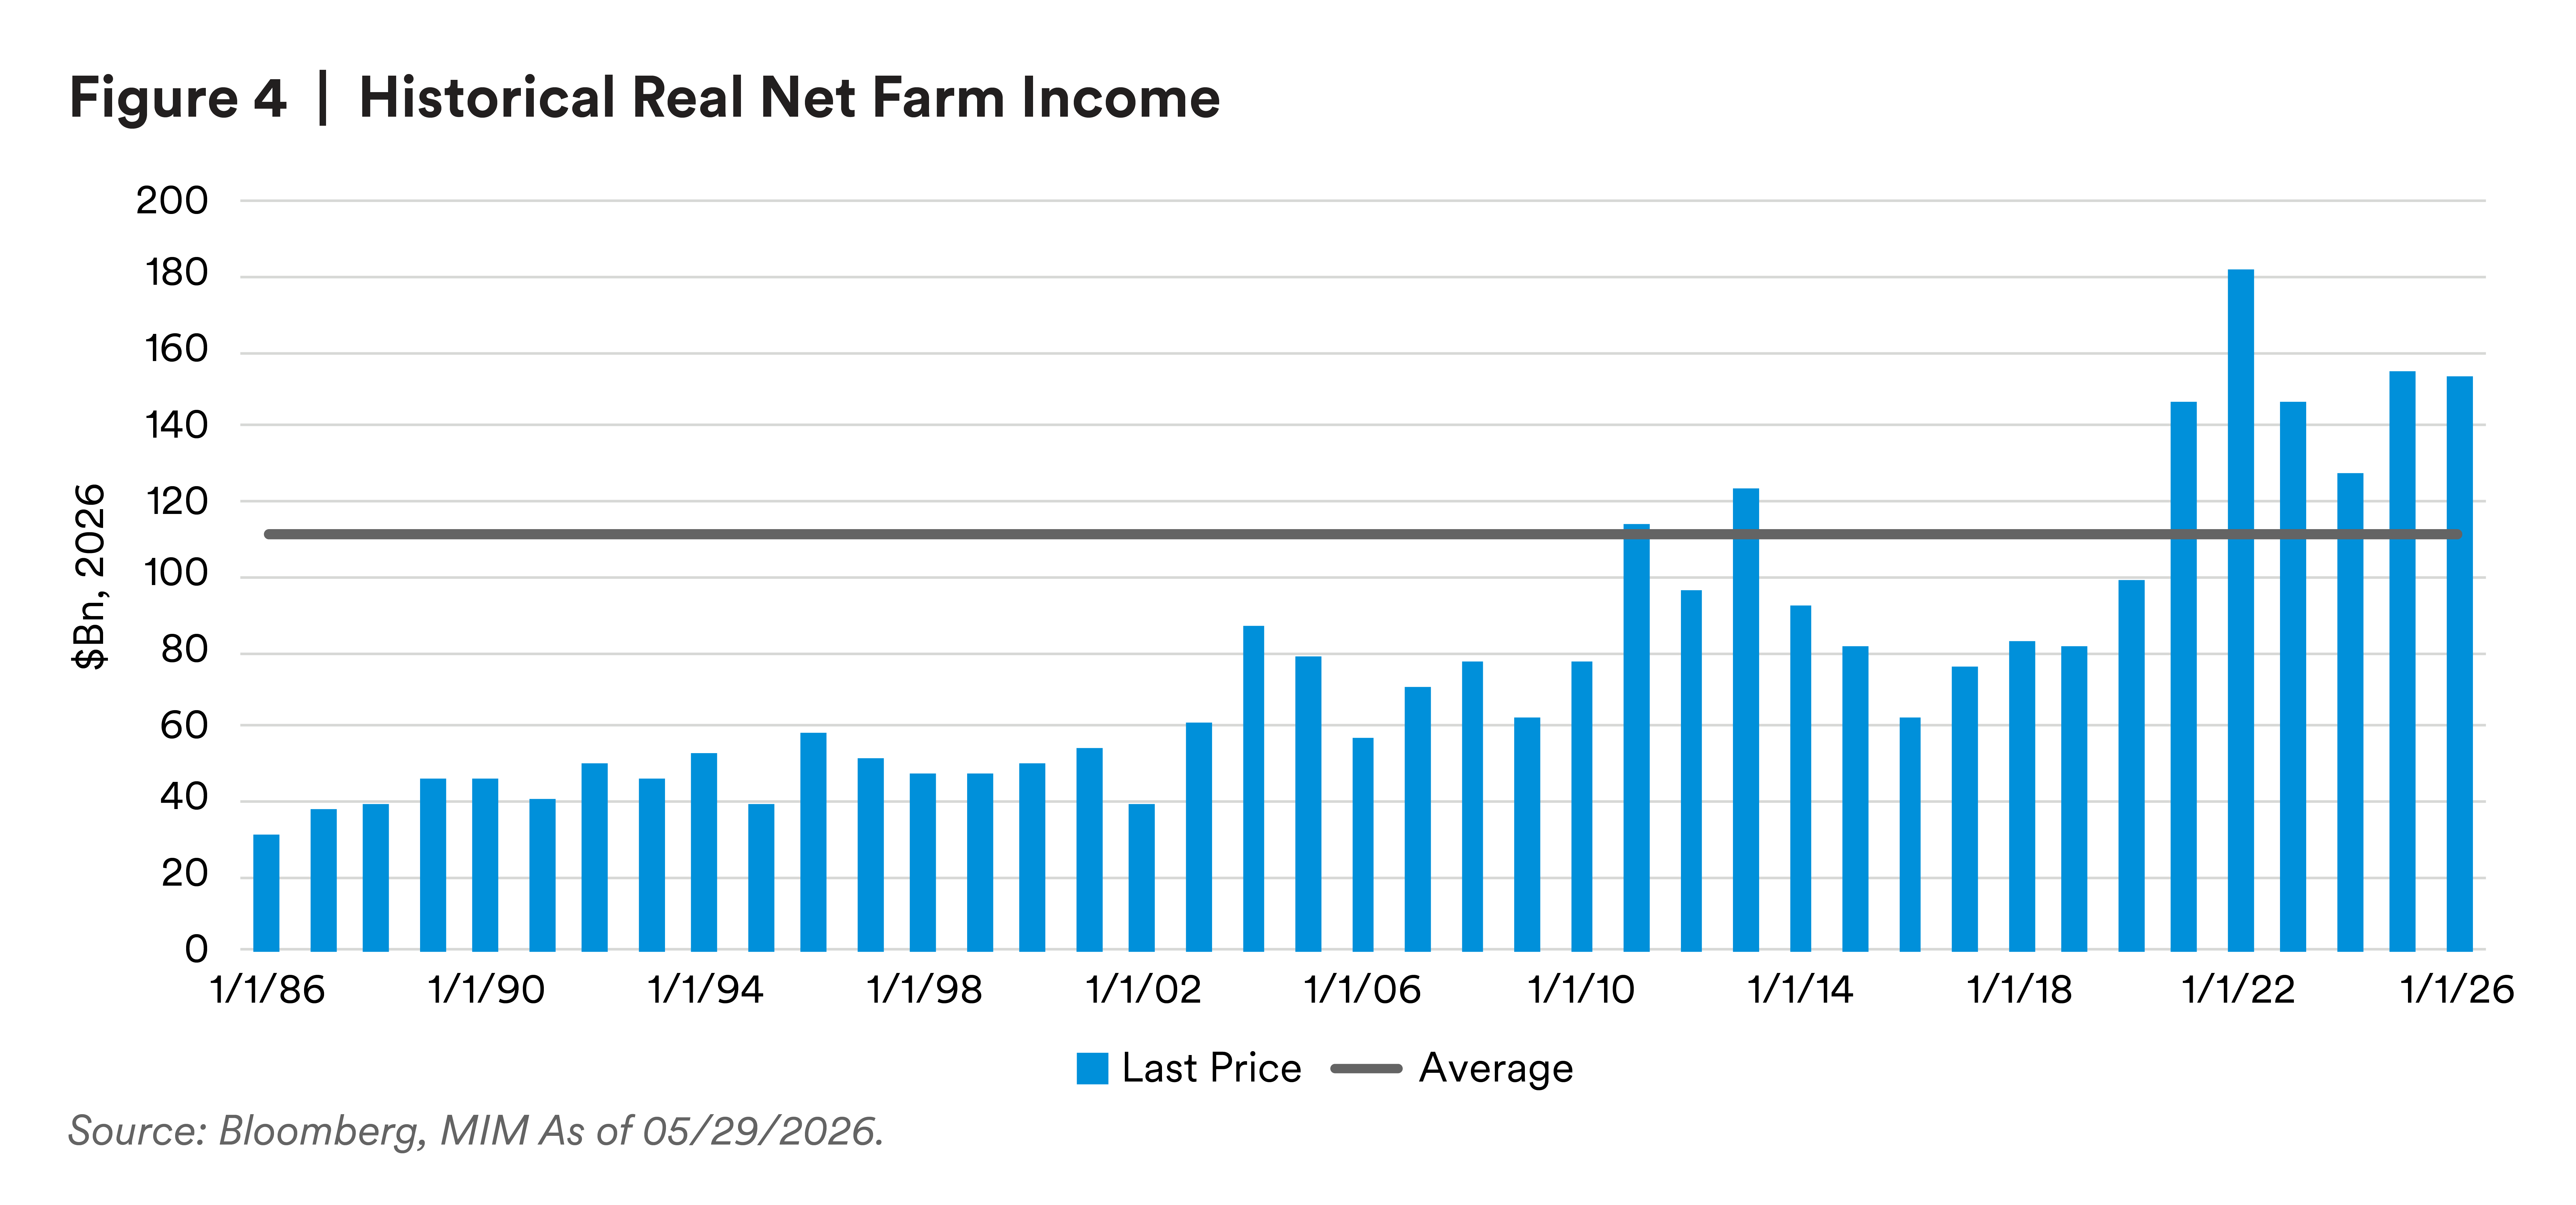
We raise agricultural mortgages to overweight, as they offer attractive carry and valuable portfolio diversification against a backdrop of stabilizing fundamentals. The USDA projects 2026 Net Farm Income of $153 billion — down only $1.2 billion from 2025 but still 27% above the 40-year inflation-adjusted average (See Figure 4). Annual-crop prices are expected to rise modestly, even as profitability pressures persist, with farm-support enhancements under the One Big Beautiful Bill Act (OBBBA) beginning to support grower incomes in Q4 2026 and a U.S.–China framework including annual soybean purchase commitments. Livestock markets continue to benefit from strong pricing and lower feed costs, with cattle and beef prices expected to stay elevated for several years. MIM’s current achievable spread on new production is ~198 bps; farmland values are expected to flatten after years of strong appreciation; and Farm Credit System delinquencies have normalized to their long-term average near 0.97%. Volume growth continues to rebound, as credit demand recovers from the record producer incomes of 2022, supporting an attractive, well-protected origination opportunity. We remain overweight agricultural mortgages.
Corporate Equity/S&P 500
We expect the S&P 500 to trade range-bound with an asymmetric downside skew over the next three months, as the market digests a higher-for-longer Fed path, even as a strong earnings season provides a fundamental floor — Q1 2026 S&P 500 EPS grew +29.4%, year over year (ex-energy +30.6%), well above the +11.0% estimate, lifting FY26 EPS growth expectations toward +22.8%. Valuation remains a constraint on further multiple expansion, with the forward P/E elevated versus history, and increases the market’s sensitivity to any negative revision cycle or macro disappointment. With the AI trade now a systemic driver of both earnings and household wealth, the principal tail risk is a disappointment in AI CapEx expectations. We hold equity at neutral.
Private markets remained active but increasingly selective, with deal activity moderating amid market volatility, geopolitical uncertainty and software-sector weakness. U.S. buyout deal value totaled $86 billion (down 13% year over year), with large transactions dominating; European dealmaking cooled, as the conflict triggered a sharp quarter-over-quarter decline; and Asia delivered multi-year highs led by China AI growth equity and Singapore data center deals. Venture capital reached exceptional levels, with AI/ML representing more than 89% of deal value, while exit activity ranked among the strongest on record — though heavily skewed by a handful of large AI-related transactions and a still only partially reopened IPO market. U.S. buyout purchase-price multiples fell to ~9.6x EBITDA, the lowest in roughly a decade, even as the public-private valuation gap widened. With liquidity constraints persisting and capital concentrating in established managers and durable-growth assets, we remain cautiously neutral, deploying selectively alongside high-conviction general partners.
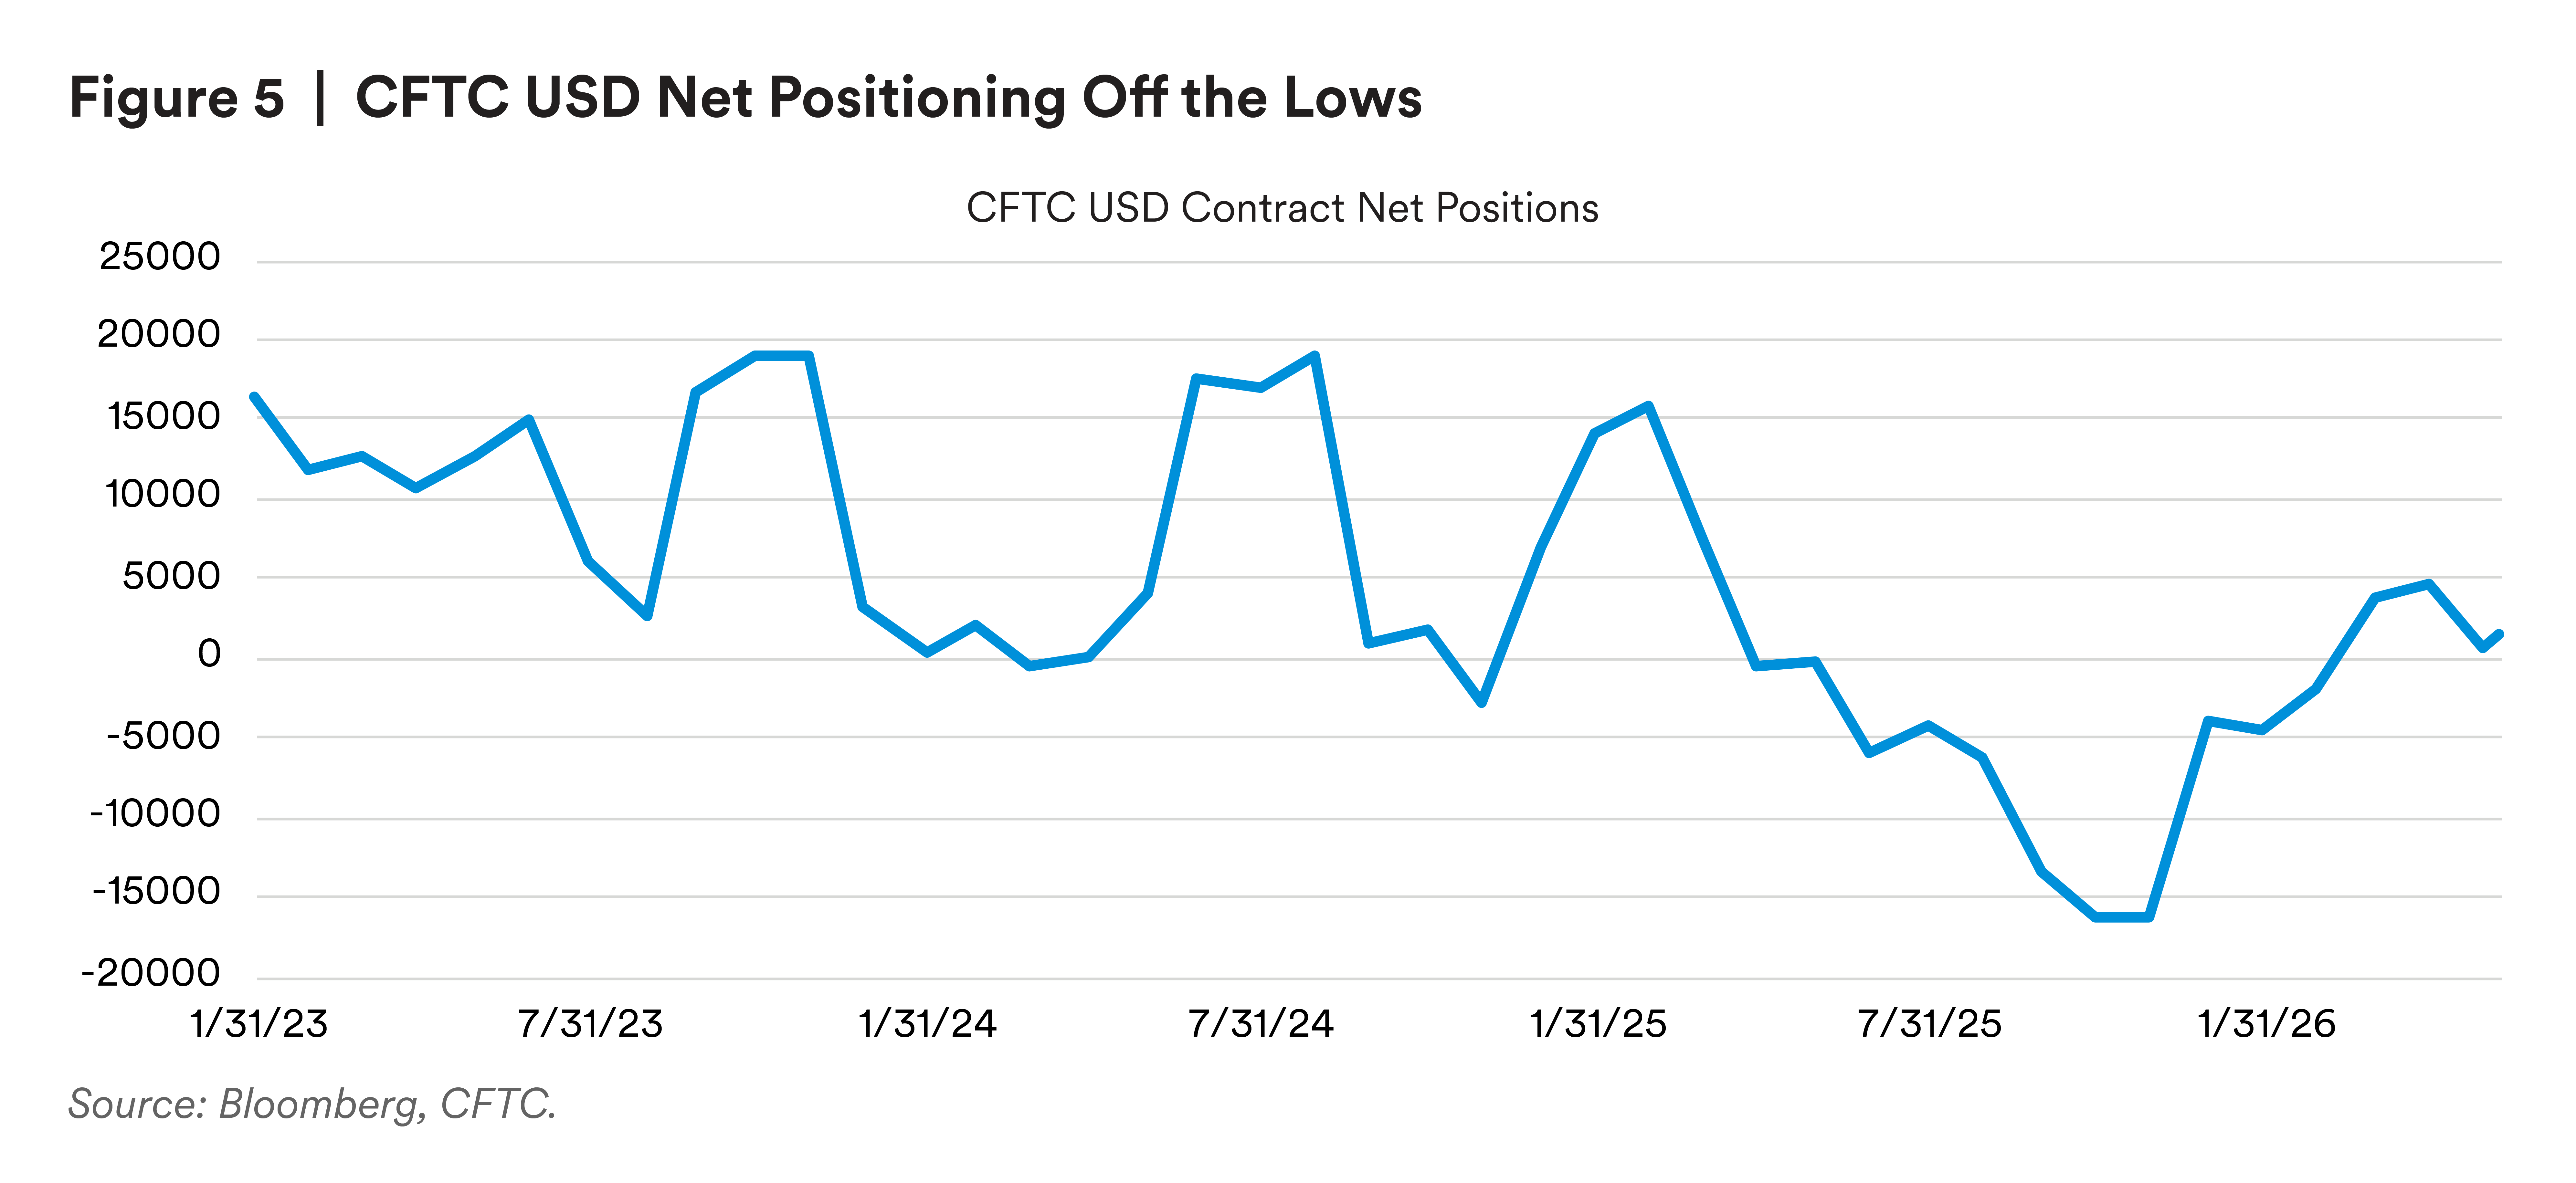
USD — The dollar entered the quarter amid expectations of range-bound trading, as fading U.S. exceptionalism and Fed-easing expectations weighed on valuation, but geopolitics reinforced its safe-haven role (See figure 5). As the prospect of a deal increases, the regime is rotating back toward one where relative rates, growth divergence and commodity dynamics reassert influence. Recent support has come from renewed U.S. macro resilience (stronger labor data, higher real yields). The outlook is balanced and regime-dependent — sustained upside would require materially tighter global financial conditions or renewed escalation, while downside would follow easing energy prices and a rotation back toward global growth convergence.
Asia — Asian FX remains challenged by elevated energy prices and softer global trade, though performance is increasingly differentiated — high-beta, energy-sensitive currencies stay vulnerable, while the Chinese yuan (CNH) and Taiwan dollar (TWD) show resilience on stronger fundamentals and structural inflows. Asia FX is likely to underperform on a relative basis, with selective opportunities in more defensive or policy-supported currencies.
Europe — European FX is finely balanced: A more rate-driven regime and potential further ECB tightening offer relative yield support to the EUR, offset by structural energy vulnerability. Currencies are likely to trade asymmetrically — limited upside in risk-off, greater sensitivity to renewed energy shocks — with a modest recovery possible if energy markets stabilize.
LatAm — LatAm FX remains the standout relative performer on favorable terms of trade, high real yields and still-restrictive policy, but the regime is shifting from pure carry toward greater sensitivity to global risk sentiment and a heavy domestic election calendar. The region should continue to outperform, but with more uneven, country-differentiated returns.
Corporate Equity/S&P 500
We expect the S&P 500 to trade range-bound with an asymmetric downside skew over the next three months, as the market digests a higher-for-longer Fed path, even as a strong earnings season provides a fundamental floor — Q1 2026 S&P 500 EPS grew +29.4%, year over year (ex-energy +30.6%), well above the +11.0% estimate, lifting FY26 EPS growth expectations toward +22.8%. Valuation remains a constraint on further multiple expansion, with the forward P/E elevated versus history, and increases the market’s sensitivity to any negative revision cycle or macro disappointment. With the AI trade now a systemic driver of both earnings and household wealth, the principal tail risk is a disappointment in AI CapEx expectations. We hold equity at neutral.
Private markets remained active but increasingly selective, with deal activity moderating amid market volatility, geopolitical uncertainty and software-sector weakness. U.S. buyout deal value totaled $86 billion (down 13% year over year), with large transactions dominating; European dealmaking cooled, as the conflict triggered a sharp quarter-over-quarter decline; and Asia delivered multi-year highs led by China AI growth equity and Singapore data center deals. Venture capital reached exceptional levels, with AI/ML representing more than 89% of deal value, while exit activity ranked among the strongest on record — though heavily skewed by a handful of large AI-related transactions and a still only partially reopened IPO market. U.S. buyout purchase-price multiples fell to ~9.6x EBITDA, the lowest in roughly a decade, even as the public-private valuation gap widened. With liquidity constraints persisting and capital concentrating in established managers and durable-growth assets, we remain cautiously neutral, deploying selectively alongside high-conviction general partners.
USD — The dollar entered the quarter amid expectations of range-bound trading, as fading U.S. exceptionalism and Fed-easing expectations weighed on valuation, but geopolitics reinforced its safe-haven role (See figure 5). As the prospect of a deal increases, the regime is rotating back toward one where relative rates, growth divergence and commodity dynamics reassert influence. Recent support has come from renewed U.S. macro resilience (stronger labor data, higher real yields). The outlook is balanced and regime-dependent — sustained upside would require materially tighter global financial conditions or renewed escalation, while downside would follow easing energy prices and a rotation back toward global growth convergence.
Asia — Asian FX remains challenged by elevated energy prices and softer global trade, though performance is increasingly differentiated — high-beta, energy-sensitive currencies stay vulnerable, while the Chinese yuan (CNH) and Taiwan dollar (TWD) show resilience on stronger fundamentals and structural inflows. Asia FX is likely to underperform on a relative basis, with selective opportunities in more defensive or policy-supported currencies.
Europe — European FX is finely balanced: A more rate-driven regime and potential further ECB tightening offer relative yield support to the EUR, offset by structural energy vulnerability. Currencies are likely to trade asymmetrically — limited upside in risk-off, greater sensitivity to renewed energy shocks — with a modest recovery possible if energy markets stabilize.
LatAm — LatAm FX remains the standout relative performer on favorable terms of trade, high real yields and still-restrictive policy, but the regime is shifting from pure carry toward greater sensitivity to global risk sentiment and a heavy domestic election calendar. The region should continue to outperform, but with more uneven, country-differentiated returns.
With the Fed expected to hold before a possible year-end cut and front-end yields likely to drift lower, the opportunity cost of holding cash rises relative to locking in attractive all-in yields and carry further out the quality spectrum. We remain underweight cash, redeploying toward the high-quality spread sectors highlighted above while preserving sufficient liquidity for resilience.
Tani Fukui
Sr. Director
EU Economy
Pierre-Pascal Lalonde
Managing Director,
Municipals
Sara Strauch
Director,
EM Corporate & Sovereign
Carrie Biemer
Senior Director
Rates & Currencies |
David Richter
Senior Director,
Sovereign Research
Michael Brown
Managing Director,
Public Structured Finance
David Williams
Sr. Director,
Agricultural Research
Anthony Pollaro
Analyst,
Public Fixed Income HY |
Felipe Perigo
Senior Director,
Sovereign Research
Alfred Chang
Managing Director,
Residential Whole Loan
Agata Praczuk
Senior Director,
Private Equity
Jackson Tappen
Analyst,
Public Fixed Income |
Jean-Luc Eberlin
Head of Credit and Trading,
EMEA
Priya Desai
Managing Director,
Private Structured Finance
Jacob Kurosaki
Associate,
Real Estate Research |
Disclosure
This material is intended solely for Institutional Investors, Qualified Investors and Professional Investors.
MetLife Investment Management (“MIM”) is MetLife, Inc.’s institutional investment management business. MIM is a group of international companies that provides investment advice and markets asset management products and services to clients around the world. The various global teams referenced in this document, including portfolio managers, research analysts and traders are employed by the various legal entities that comprise MIM.
All investments involve risk, including possible loss of principal; no guarantee is made that investments will be profitable. This document is solely for informational purposes and does not constitute a recommendation regarding any investments or the provision of any investment advice, or constitute or form part of any advertisement of, offer for sale or subscription of, solicitation or invitation of any offer or recommendation to purchase or subscribe for any securities or investment advisory services. The views expressed herein are solely those of MIM and do not necessarily reflect, nor are they necessarily consistent with, the views held by, or the forecasts utilized by, the entities within the MetLife enterprise that provide insurance products, annuities and employee benefit programs. The information and opinions presented or contained in this document are provided as of the date it was written. It should be understood that subsequent developments may materially affect the information contained in this document, which none of MIM, its affiliates, advisors or representatives are under an obligation to update, revise or affirm. It is not MIM’s intention to provide, and you may not rely on this document as providing, a recommendation with respect to any particular investment strategy or investment. Affiliates of MIM may perform services for, solicit business from, hold long or short positions in, or otherwise be interested in the investments (including derivatives) of any company mentioned herein. Views may be based on third-party data that has not been independently verified. MIM does not approve of or endorse any republication of this material. This document may contain forward-looking statements, as well as predictions, projections and forecasts of the economy or economic trends of the markets, which are not necessarily indicative of the future. Any or all forward-looking statements, as well as those included in any other material discussed at the presentation, may turn out to be wrong.
In the U.S: This document is communicated by MetLife Investment Management, LLC (MIM, LLC), a U.S. Securities Exchange Commission registered investment adviser. MIM, LLC is a subsidiary of MetLife, Inc. and part of MetLife Investment Management. Registration with the SEC does not imply a certain level of skill or that the SEC has endorsed the investment advisor.
For investors in the UK: This document is being distributed by MetLife Investment Management Limited (“MIML”), authorised and regulated by the UK Financial Conduct Authority (FCA reference number 623761), registered address One Angel Lane 8th Floor London EC4R 3AB United Kingdom. This document is approved by MIML as a financial promotion for distribution in the UK. This document is only intended for, and may only be distributed to, investors in the UK who qualify as a “professional client” as defined under the Markets in Financial Instruments Directive (2014/65/EU), as per the retained EU law version of the same in the UK. © 2025 MetLife Services and Solutions, LLC.
For investors in the Middle East: This document is directed at and intended for institutional investors (as such term is defined in the various jurisdictions) only. The recipient of this document acknowledges that (1) no regulator or governmental authority in the Gulf Cooperation Council (“GCC”) or the Middle East has reviewed or approved this document or the substance contained within it, (2) this document is not for general circulation in the GCC or the Middle East and is provided on a confidential basis to the addressee only, (3) MetLife Investment Management is not licensed or regulated by any regulatory or governmental authority in the Middle East or the GCC, and (4) this document does not constitute or form part of any investment advice or solicitation of investment products in the GCC or Middle East or in any jurisdiction in which the provision of investment advice or any solicitation would be unlawful under the securities laws of such jurisdiction (and this document is therefore not construed as such).
For investors in Japan: This document is being distributed by MetLife Investment Management Japan, Ltd. (“MIM JAPAN”), a registered Financial Instruments Business Operator (“FIBO”) conducting Investment Advisory Business, Investment Management Business and Type II Financial Instruments Business under the registration entry “Director General of the Kanto Local Finance Bureau (Financial Instruments Business Operator) No. 2414” pursuant to the Financial Instruments and Exchange Act of Japan (“FIEA”), and a regular member of the Japan Investment Advisers Association and the Type II Financial Instruments Firms Association of Japan. In its capacity as a discretionary investment manager registered under the FIEA, MIM JAPAN provides investment management services and also subdelegates a part of its investment management authority to other foreign investment management entities within MIM in accordance with the FIEA. This document is only being provided to investors who are general employees’ pension fund based in Japan, business owners who implement defined benefit corporate pension, etc. and Qualified Institutional Investors domiciled in Japan. It is the responsibility of each prospective investor to satisfy themselves as to full compliance with the applicable laws and regulations of any relevant territory, including obtaining any requisite governmental or other consent and observing any other formality presented in such territory. As fees to be borne by investors vary depending upon circumstances such as products, services, investment period and market conditions, the total amount nor the calculation methods cannot be disclosed in advance. All investments involve risks including the potential for loss of principle and past performance does not guarantee similar future results. Investors should obtain and read the prospectus and/or document set forth in Article 37-3 of Financial Instruments and Exchange Act carefully before making the investments.
For Investors in Hong Kong S.A.R.: This document is being issued by MetLife Investments Asia Limited (“MIAL”), a part of MIM, and it has not been reviewed by the Securities and Futures Commission of Hong Kong (“SFC”). MIAL is licensed by the Securities and Futures Commission for Type 1 (dealing in securities), Type 4 (advising on securities) and Type 9 (asset management) regulated activities.
For investors in Australia: This information is distributed by MIM LLC and is intended for “wholesale clients” as defined in section 761G of the Corporations Act 2001 (Cth) (the Act). MIM LLC exempt from the requirement to hold an Australian financial services license under the Act in respect of the financial services it provides to Australian clients. MIM LLC is regulated by the SEC under US law, which is different from Australian law.
For investors in the EEA: This document is being distributed by MetLife Investment Management Europe Limited (“MIMEL”), authorised and regulated by the Central Bank of Ireland (registered number: C451684), registered address 20 on Hatch, Lower Hatch Street, Dublin 2, Ireland. This document is approved by MIMEL as marketing communications for the purposes of the EU Directive 2014/65/EU on markets in financial instruments (“MiFID II”). Where MIMEL does not have an applicable cross-border licence, this document is only intended for, and may only be distributed on request to, investors in the EEA who qualify as a “professional client” as defined under MiFID II, as implemented in the relevant EEA jurisdiction. The investment strategies described herein are directly managed by delegate investment manager affiliates of MIMEL. Unless otherwise stated, none of the authors of this article, interviewees or referenced individuals are directly contracted with MIMEL or are regulated in Ireland. Unless otherwise stated, any industry awards referenced herein relate to the awards of affiliates of MIMEL and not to awards of MIMEL.