CMBS
- Commercial real estate prices continue to decline and delinquencies continue to increase led by office properties now down 13 months in a row on a year-over-year basis
- Tighter lending standards make it difficult for borrowers to refinance maturing loans
- We favor multifamily agency and more stable non-agency conduit tranches
RMBS
- Mortgage rates are at their highest levels since 2000
- Prepayment activity remains muted as rising mortgage rates and increasing home prices continue to create affordability challenges
- We favor seasoned 15-year specified pools
Municipals
- Limited new issue supply has been supportive for spreads
- Many U.S. state and local issuer revenues are experiencing declines
- Migration patterns and commercial real estate challenges will continue to negatively impact tax revenues, creating headwinds
- We favor essential service and transportation-related issuers
Investment Grade Credit
Recap: The investment grade credit market had a bit of a bumpy ride in the third quarter, and it could have been worse but for the increase in Treasury yields over the quarter, which helped draw in yield-focused investors and served to temper widening in credit spreads. The corporate bond market began the quarter with a very strong month in July as the option-adjusted spread (OAS) of the ICE BofA 1-5 Year U.S. Corporate Index, our benchmark front-end credit index, tightened 11 basis points with rate volatility ebbing after an initial spike and modest expectations for second�quarter corporate earnings being largely met before reaching the typical August lull. August proved to be lackluster, seeing the front-end credit index reverse course and its OAS widen 7 basis points, as early in the month the market broke its string of 20 consecutive weeks of inflows into high-grade bond funds. Interest rates continued to climb higher for much of August after dipping early in the month in front of the surprisingly weak JOLTS report with jobs openings falling well below consensus expectations and the Quits Rate returning to its pre-pandemic level, which pushed yields lower. With the late-month rates rally, credit spreads closed August wider. Nonetheless, entering September, a bit of market complacency prevailed with the market appearing to price in a soft-landing scenario. However, September proved to be somewhat of a repeat of August with the front-end credit index OAS widening 8 basis points, resulting in a second consecutive month of slight negative index excess return. New issue activity picked up with the post-Labor Day return of many market participants as volume for the month closely matched the $125 billion forecast. Fund inflows into investment grade corporates largely slowed to a trickle while valuations remained less than compelling. Notwithstanding the renewed and steady climb in Treasury yields in September driven by the market’s consensus adoption of the Federal Reserve’s “higher-for-longer” scenario, which pushed all-in yields on corporates to the highest levels seen since 2009, credit spreads remained too tight in our view and were still a touch lower in spread on the year.

Turning briefly to fundamentals, second-quarter earnings reports, which printed throughout the third quarter, evidenced added deterioration with corporate earnings and operating margins broadly weakening in the face of reduced consumer demand in addition to wage and cost pressures. For the S&P 500 Index’s constituent companies, second-quarter year-over-year EPS was -3.6%, the third consecutive quarterly decline. We will get a further read on corporate health with the upcoming quarterly earnings season again about to kick off in early October.
Portfolio Actions & Outlook: The ICE BofA 1-5 Year U.S. Corporate Index, closed the third quarter at an OAS of 102 basis points, 4 basis points wider compared to where the index began the quarter and 1 basis point below where the OAS entered the year. From our vantage point while trying not to overstate our concerns, we continue to see the current landscape for corporate credit as less attractive, consistent with being “late-cycle” and storm clouds increasingly gathering, which will eventually lead to a sharper move lower in economic growth and a likely reset wider in credit spreads. This outlook leaves us reluctant to meaningfully increase corporate bond sector spread risk in our portfolios on one hand but balanced with our view on the other hand that all-in yields on selected front-end corporate bonds look very attractive from a break-even or expected total return standpoint. Notwithstanding our concern that credit spreads, especially further out the maturity spectrum and for lower-quality credits, will eventually succumb to the tug of deteriorating fundamentals and contend with the potential for a recession to finally materialize, we continue to see the opportunity to lock in the presently offered front-end yields, the highest available since 2009, in favored issuers and subsectors as attractive, especially around select duration or maturity points.
During the third quarter in the Cash Plus strategy we saw maturities more than offset some selected purchases of six-month to one-year duration area secondary bonds at what we deemed attractive yields. In the Enhanced Cash strategy, we maintained our sector weighting by locking in attractive yields in adding roughly one-year duration secondary bonds, funded by selling some short-maturity bonds, mainly fixed- and floating-rate 2024 securities. We selectively added primarily two-year duration new issue bonds in several our favored names and subsectors, slightly increasing overall sector exposure in the 1–3-year strategy portfolios, including two money center bank-level bonds, a domestic utility holding company security and a secondary AAA-rated, two-year Canadian bank covered bond. Those purchases were funded by selling less than one-year duration bonds. In the 1–5- year strategy portfolios, where our sector weighting was also held relatively steady over the quarter, we purchased some higher-quality new issue bonds including an insurance company’s secured, funding agreement-backed five-year as well as a large U.S. custodian bank’s three-year and a money center institution’s bank-level two-year bond. Similar to our selling activity in the 1–3-year strategy portfolios, we chiefly sold less than one-year duration bonds to fund our sector buys.
Drilling down further on what we touched on above in terms of our outlook for the investment grade credit sector, we remain a bit cautious in anticipating that we will see further spread widening given growing headwinds. These are emanating from weakening corporate operating fundamentals and credit metrics, tightening financial conditions, a decelerating housing market driven by multidecade high mortgage rates and record-low affordability, and additional challenges for the U.S. consumer driven by slowing wage growth, exhausting of excess savings built up during the pandemic, higher unemployment, and the restarting of student loan repayments. While the market continues to largely price in a soft-landing scenario, the Federal Reserve’s seeming determination to keep their policy rate higher for longer, if carried out through much of the next year, will likely stunt economic growth and cause a recession as it typically has over past cycles to bring inflation to heel. U.S. regional banks, a vital source of financing for the economy, remain under pressure after the collapses of Silicon Valley Bank, Signature Bank and First Republic Bank earlier this year, which have led to increased funding costs, hastened deposit outflows and diminished banks’ willingness to lend, contracting the availability of credit. Against this backdrop, we will continue to be very selective in investment grade credit and operate with a reduced risk appetite across strategies. This translates into a lower sector weighting and more defensive, up-in-quality positioning relative to our historical averages. At such time as we alter our thinking based on our top-down, macro themes as our outlook improves or cheaper valuations (i.e., wider spreads) materialize representing a better entry point more closely aligned with underlying fundamentals, we will look to shift our risk appetite. In the meantime, we will favor more defensive subsectors like Banking, Insurance, Communications, Consumer Non-cyclicals, and Electric Utilities less vulnerable to spread widening compared to more cyclically exposed subsectors.

Performance: The investment grade credit sector contributed positively to relative performance across all strategies over the third quarter. Positive excess returns from the sector came about despite the modest widening in credit spreads we observed. Corporate bond spreads tightened in July on growing anticipation that the Federal Reserve’s hiking program had been completed and hopes for a soft landing before increasing pessimism set in that the Federal Reserve may follow through with one more quarter-point fed-funds rate hike then maintain their policy rate higher for longer. That growing recognition the Federal Reserve will not seemingly be quick to cut rates, best evidenced by their removal of two of the four previously projected 2024 rate cuts at the September FOMC meeting in the dot plot, saw spreads widen in both August and September. In our view, another sharp increase in benchmark Treasury yields over the third quarter helped limit the increase in spreads as all-in yields on front-end corporates reached their highest level since 2009, capturing the attention of yield buyers. Despite the OAS of our front-end benchmark 1-5 year U.S. corporate index drifting higher on a quarter-over-quarter basis to a level just below where we began the year amidst the move higher in benchmark yields, which pushed the index’s total return negative in September, the index’s third-quarter total return was 0.42%. However, the index’s excess return remained positive at 0.22%. Solidly performing investment grade credit subsectors that drove positive excess returns across most strategies included Banking, Insurance, Automotive, Wireless, Health Care and Electric Utilities. The Pharmaceuticals subsector was a slight drag on performance from an excess return standpoint over the quarter.
Treasuries / Agencies
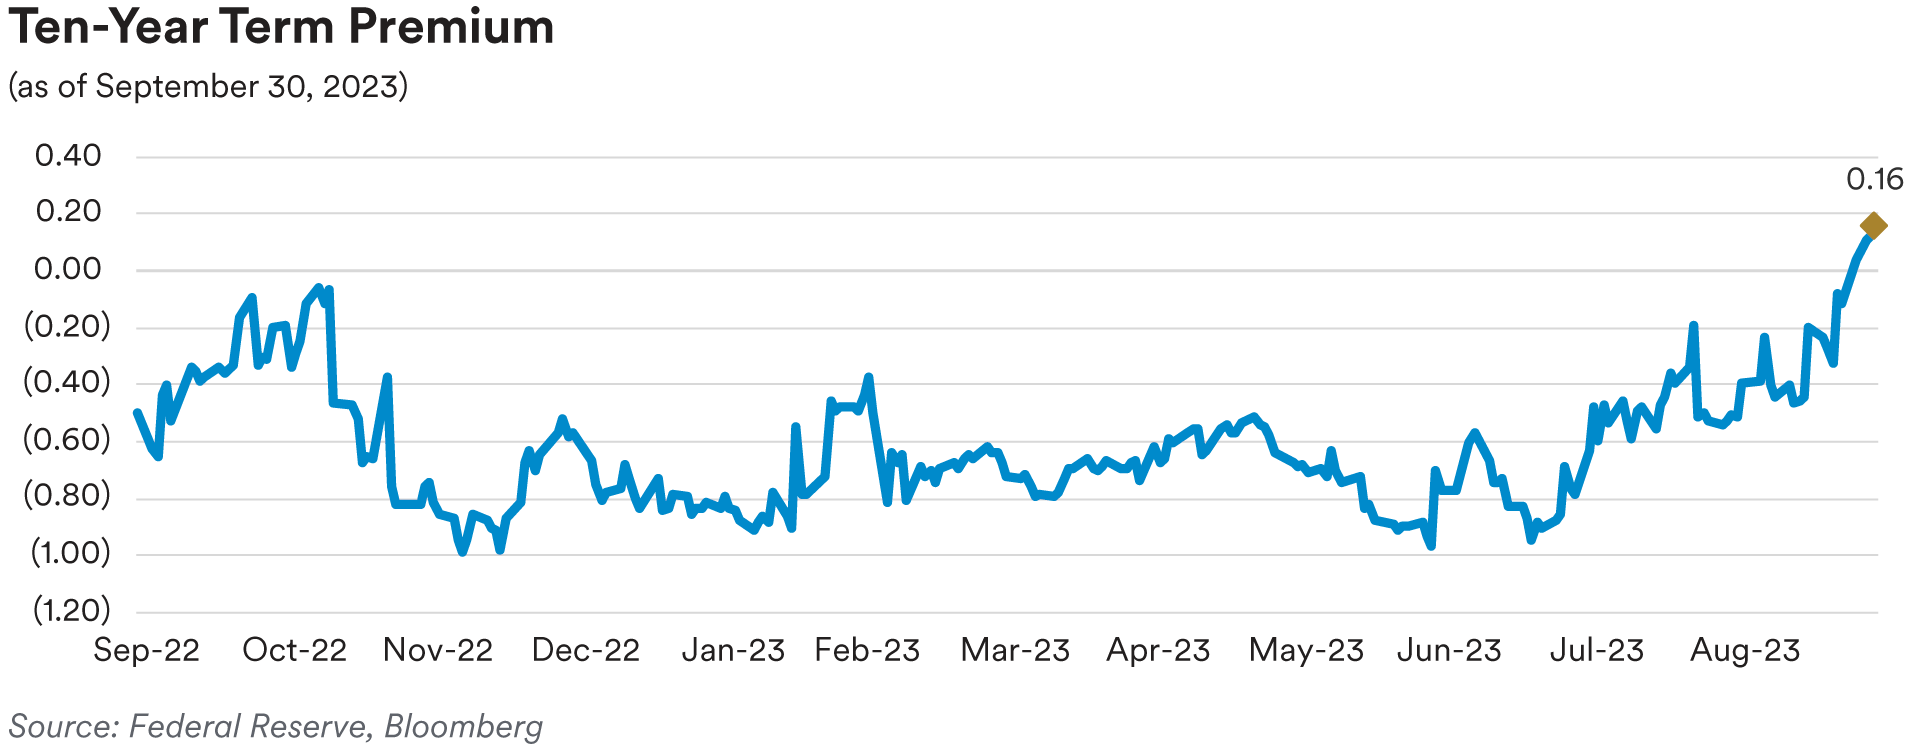
Recap: The Treasury market sold off and yields moved higher in the third quarter as the curve bear steepened. Treasury rates across the curve hit the highest levels we have seen in over a decade as the Federal Reserve maintained a data dependent policy stance and left the door open to a future hike allowing for greater flexibility and a longer window to assess the lagged impact of higher rates. The ten-year term premium turned positive for the first time since 2001, a function of larger-than-expected increases to Treasury auction sizes and confirmation of greater issuance in coming quarters, growing conviction in the soft-landing narrative and a real growth environment that continued to hold up remarkably well as questions were raised about the prospects of a higher neutral rate.
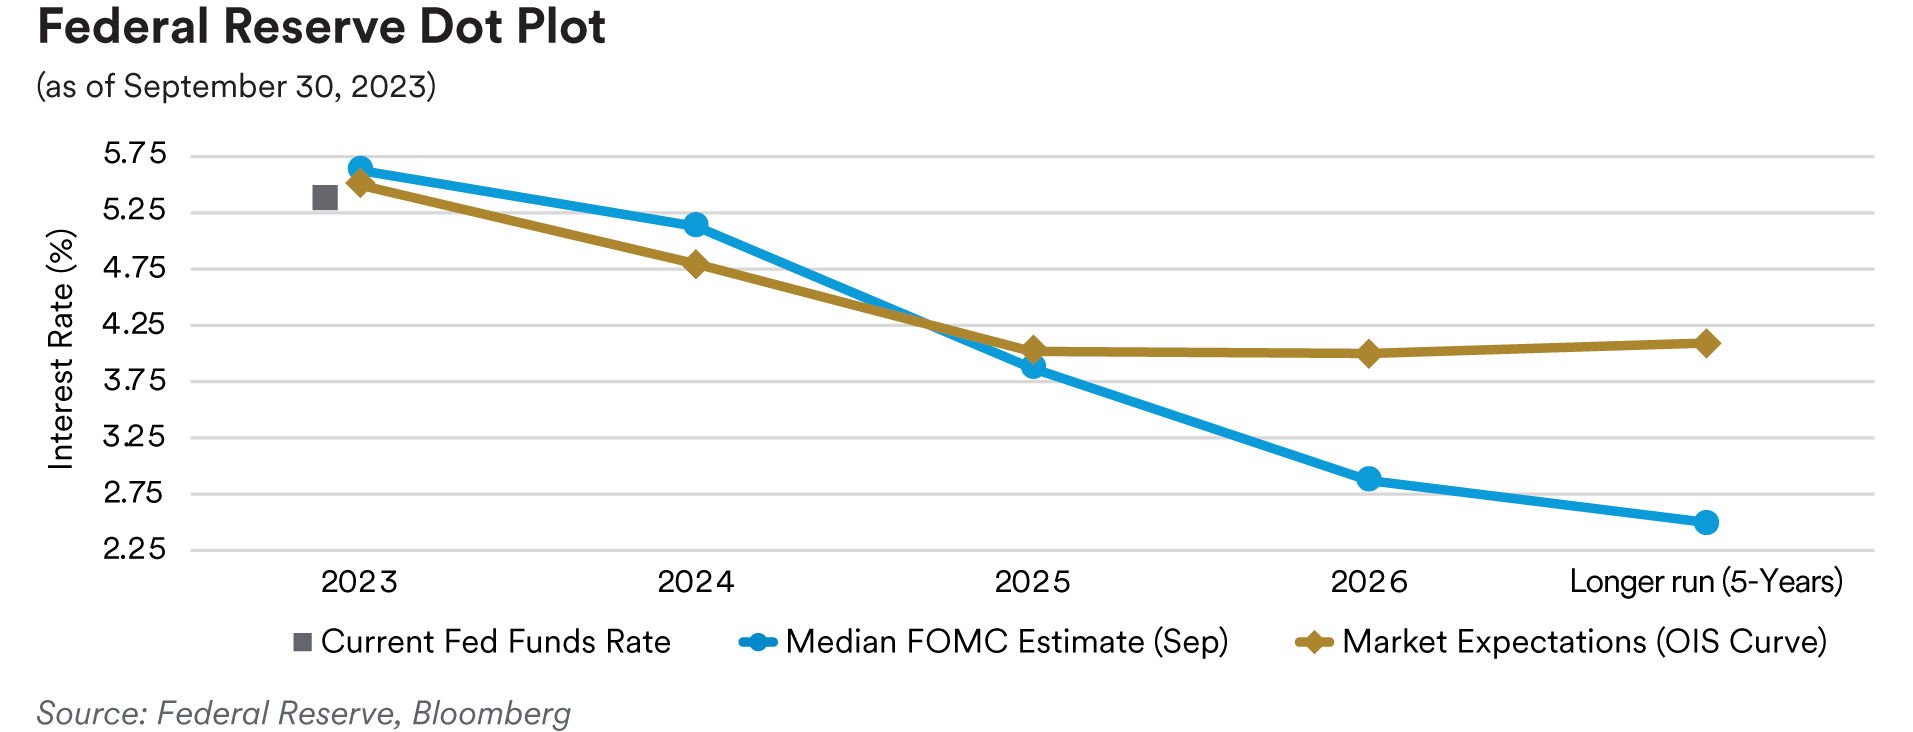
After holding rates steady for the first time this cycle at the June meeting, the FOMC hiked rates by 25 basis points in July and skipped again in September. The FOMC dots released at the September meeting projected one more hike in 2023 along with fewer eases in 2024 and 2025 (each year’s federal funds projections were adjusted by removing 50 basis points of cuts). The market’s expectation of the fed-funds rate at the end of 2023 went from 5.39% at the start of the quarter to 5.43% by the end of the quarter, as the market anticipates the end of the hiking cycle is near. As the market grew more comfortable with the Federal Reserve potentially being close to the end of the hiking cycle and on hold for longer thereafter, volatility in the front end of the market was stable as daily basis point moves in the front end of the Treasury market remained at 8 basis points on average.
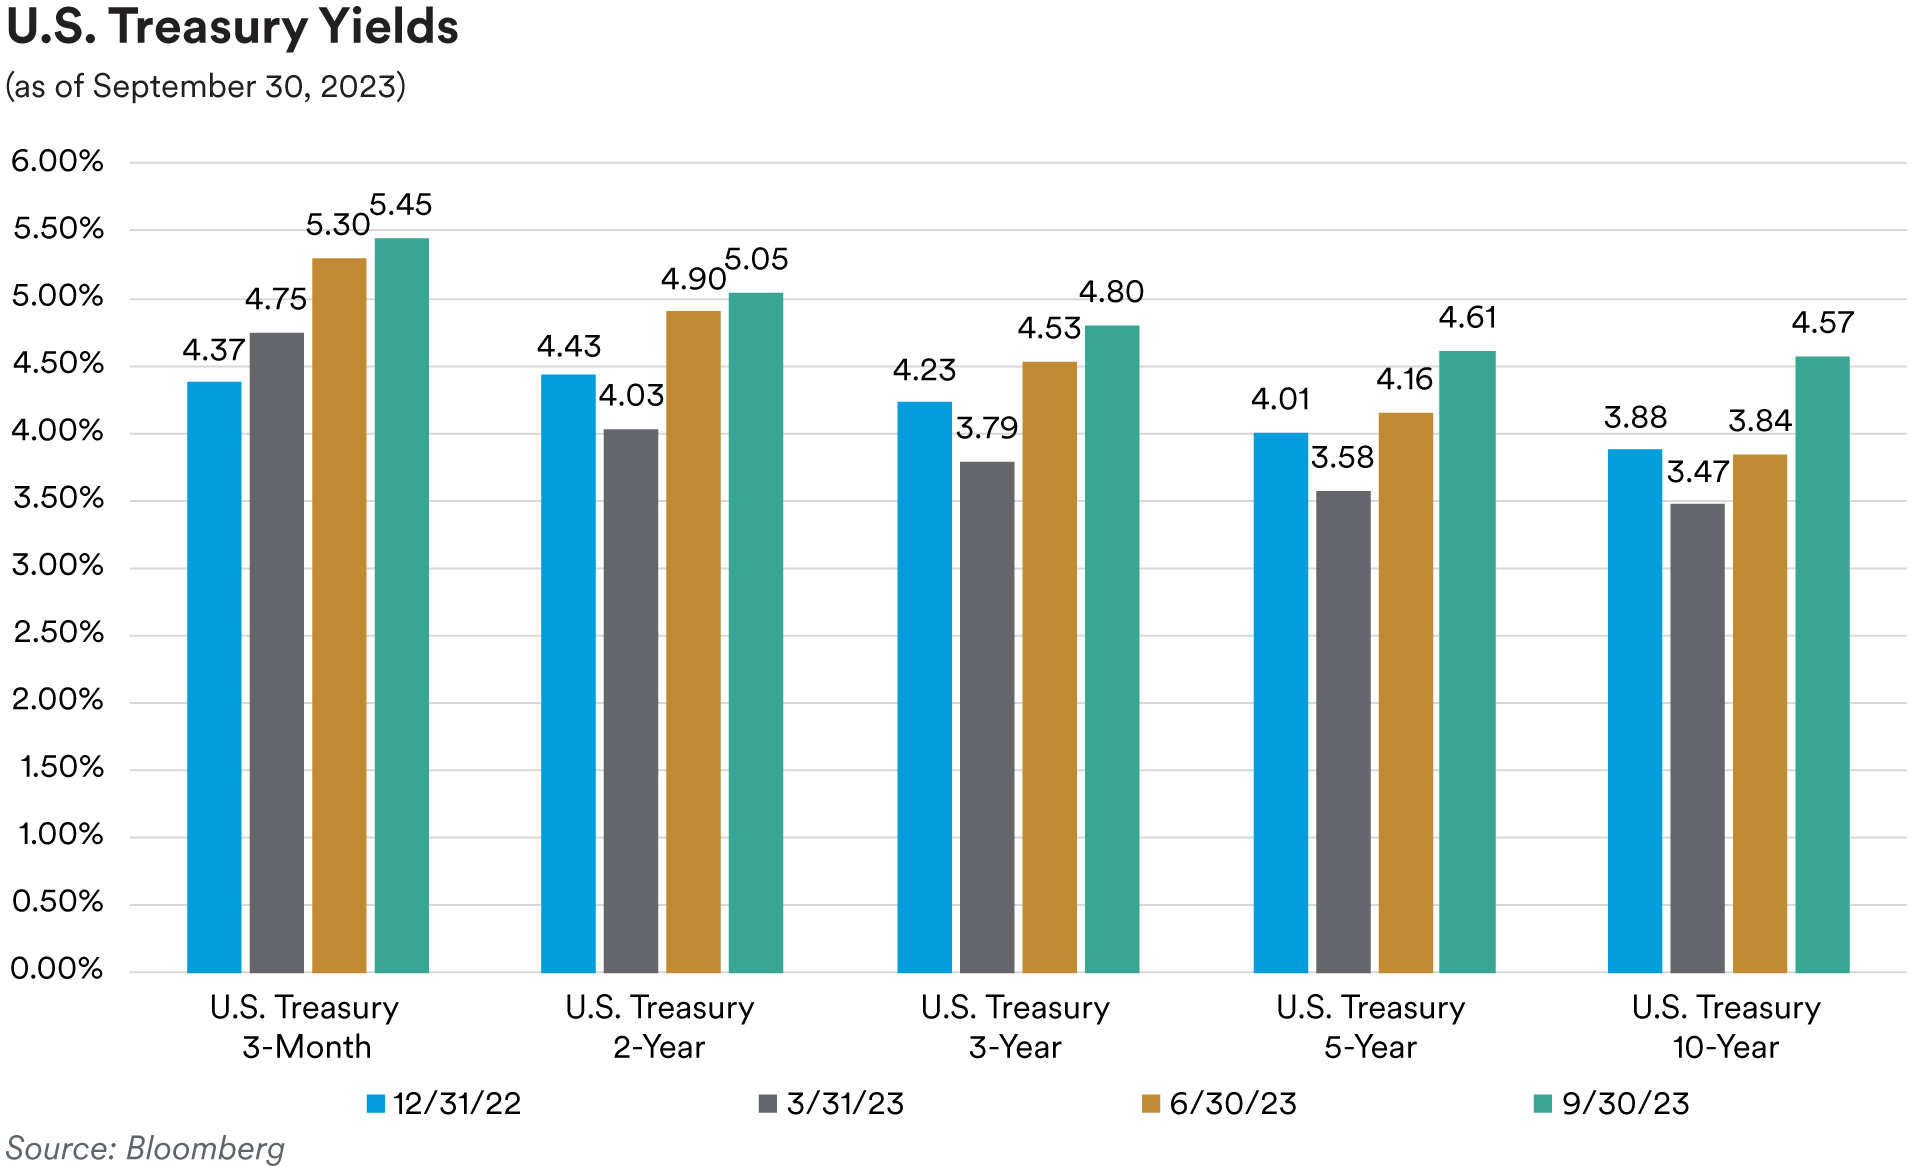
The very front end of the market, where we operate, sold-off less than the rest of the curve during the third quarter. The three-month, six-month, and one-year bill yields were 17, 13 and 6 basis points higher during the quarter, respectively. The two-year Treasury, which traded in a 60-basis point range during the quarter, moved 14 basis points higher, ending the quarter at 5.04%. The five-year Treasury sold off 45 basis points and ended the quarter at 4.61% while the ten-year Treasury moved 73 basis points higher to end the quarter at 4.57%. The spread between the 10-year Treasury and the 2-year Treasury steepened from -106 basis points at the start of the quarter to -47basis points at the end of the quarter. The spread between the 5-year Treasury and 2-year Treasury moved steeper as well from -74 basis points at the start of the quarter to -43 basis points at the end of the quarter.
Higher Treasury bill issuance during the quarter was met with solid demand as a function of the still elevated amount of cash in the front end in search of yield. The significant decline in RRP (reverse repo program) usage was primarily due to money market funds that reallocated capital from the RRP into the Treasury bill market.
TIPS breakeven inflation rates stayed rangebound during the quarter, as the Federal Reserve’s hawkish commitment contained inflation expectations well within the prevailing range. The move higher in rates was primarily a function of higher real yields as growth optimism and a higher policy outlook pushed real yields through cycle highs in the five-year and ten-year sectors. The five-year real yield moved from 199 basis points at the start of the quarter to 240 basis points at the end of the quarter. The ten-year real yield went from 162 basis points to 223 basis points during the same period. Five-year TIPS breakeven rates were largely unchanged moving from 220 basis points at the start of the quarter to 225 basis points at the end of the quarter while ten-year TIPS went from 224 basis points to 234 basis points in the same period.
Front-end Government-Sponsored Enterprise (GSE) agency spreads slightly widened along with credit spreads over the third quarter as the OAS of the ICE BofA 1-5 Year U.S. Bullet (fixed maturity) Agency Index ended the quarter at just 8 basis points, 1 basis point wider from the start of the quarter. In the SSA (Sovereigns, Supranationals & Agencies) subsector, U.S. dollar-denominated fixed-maturity security spreads widened by 3 basis points and finished the quarter on average at 29 basis points over comparable-maturity Treasuries. Agency callable spreads relative to Treasuries continued to tighten as short-dated and short-expiry volatility in the upper left portion of the volatility surface moved lower. However, due to the selloff in rates, callable yields pushed higher despite tighter spreads. Two- and three-year maturity “Bermudan” callables, which feature quarterly calls with lockout periods of three months, were offered at spreads over Treasuries of 65 and 110 basis points, providing yields of 5.70% and 5.90%, respectively.
Portfolio Actions: In the third quarter, we slightly reduced our allocation to Treasuries in favor of high-quality spread sector alternatives. We continued swapping shorter-term Treasuries to extend our portfolio durations using Treasuries and various high-quality securities further out the curve. As the yield curve steepened during the quarter, we maintained our bulleted curve posture while adding duration across our strategies. We took the opportunity to add duration when the Federal Reserve released their forecast of noticeably higher rates over 2024 and 2025 due to a resilient economy, strong labor market and sticky inflation at the September meeting which caused rates to dramatically sell off as the two-year yield breeched its previous intraday high of 5.12% seen in early July. In our shorter Cash Plus and Enhanced Cash portfolios we replaced an agency callable issue that was called, while in our 1-3 and 1-5 year strategies, we reduced our exposure in the non-credit foreign agency subsector by selling a Middle Eastern oil producer’s 2024 maturity bond to fund the previously mentioned duration trade.

Outlook: As we start the fourth quarter, we are constructive regarding interest rate levels in the front end of the maturity spectrum as we are near the end of the hiking cycle that started in March 2022. Going forward, factors we will be watching include elevated auction supply, who the marginal buyers of that supply may be and technical support levels of two-year Treasury rates at 5.20% and five-year Treasury rates around 4.90%.
Although we may have seen the highs in volatility in the front end of the curve, callable agencies still provide yield enhancement over Treasuries. Agency callable bonds eligible for call redemptions are due to hit historical quarterly highs in the fourth quarter. As rates have risen, Agency callable redemptions have been extremely low since the beginning of 2022. Meanwhile, we have seen callable issuance increase dramatically as volatility also climbed. As a result of constant positive net supply of callables, we estimate $675 billion of agency callable bonds may be called, the highest since 2016. For context, during the four-year period from 2016 to 2019 quarterly callable bonds up for call stood in a range of $200-300 billion. Federal Home Loan Bank alone will have $390 billion in callable bonds in the fourth quarter, nearly 60% of the total. As we look at the makeup of the bonds up for call, almost half were issued between 2020 and 2021 with coupon averages of 1% or less, making them unlikely to get called. Nonetheless, about one-third of these callables were issued in the first three quarters of this year and have coupons ranging from 5.35% to 5.75%. Given the high coupons on these callables, they are the most sensitive to rates and could extend if rates go higher or remain elevated but are likely to get called if yields decline. We expect credit spreads to move wider in the fourth quarter, with GSE and SSA spreads likely following in sympathy, albeit marginally as spreads are expected to be relatively range-bound for the rest of the year. Many SSA issuers front-loaded their issuance needs in the first half of the year, as cross-currency funding levels provided supportive conditions for cheaper USD issuance. The lack of robust supply into year-end should also mitigate any major spread widening in this subsector.
ABS
Recap: Spreads on short-tenor ABS securities moved tighter over the course of the third quarter despite the headwinds of persistent inflation, rising interest rates, hawkish commentary from the Federal Reserve, concerns about a possible oncoming recession and robust new issue supply. Benchmark three-year, AAA-rated credit card, prime auto and subprime auto tranches ended the quarter at spreads of 55, 80 and 90 basis points over Treasuries, 1, 10 and 6 basis points tighter, respectively. Three-year, floating-rate AAA-rate private student loan tranches ended the quarter at a spread of 132 basis points over SOFR, 6 basis points tighter. We attribute the positive performance of ABS tranches to investors’ belief that despite the headwinds noted above, the resilient labor market should continue to support consumer asset-backed performance in the near term. Over $71 billion of new ABS deals priced during the quarter, an increase of 28% compared to the $56 billion seen in the third quarter last year. As usual, the auto sector was the leading contributor with over $41 billion of new deals coming to the market, compared to only $24 billion in the third quarter last year. This was followed by $9 billion of issuance in the “other ABS” subsector (which includes collateral like cell phone payment plans, timeshares, mortgage servicer advances, insurance premiums, aircraft leases, etc.) and $8 billion of equipment issuance. Notably, issuance in the “other ABS” subsector was 28% below last year’s third quarter volume of $13 billion. Credit cards saw $7 billion of third quarter new issuance, compared to almost $9 billion last year.
Supported by the jobs market, credit card trust performance remains generally solid by historical standards although metrics have slowly deteriorated since the removal of pandemic-related relief programs. Data from the September remittance reporting period and aggregated in the J.P. Morgan credit card performance indices showed 60+-day delinquencies on bank credit card master trusts rising over the quarter by 2 basis points to 0.84% and charge-offs flat at 1.78%. While charge-offs and delinquencies have increased 73 basis points and 27 basis points, respectively, compared to last year, both metrics are still below pre-pandemic levels (in March 2020 charge-offs and 60+-day delinquencies stood at 2.41% and 1.12%, respectively). Accordingly, we still anticipate deterioration in trust performance going forward given the headwinds facing consumers. In addition, ABS bank credit card trust collateral contains a relatively narrow subset of consumers (generally very seasoned, prime quality borrowers) who are not fully representative of the broader consumer market. In our view, aggregate consumer credit card accounts are likely performing much worse.

New vehicle sales bounced back in September to a 15.7 million SAAR (seasonally-adjusted annualized rate) pace, following a dip in August to 15.0 million SAAR. September’s figure was essentially flat quarter-over-quarter and sales have generally been rangebound for most of the year in the 15 million SAAR area, after ending last year at 13.3 million. In our view, rising interest rates and higher auto prices will dampen new vehicle sales in contrast to the limited inventory levels which were the constraint last year. Going forward, the ongoing UAW strike could have a negative effect on sales volumes. However, so far, the “Stand Up” strike tactic employed by the UAW (which targets specific plants rather than a more broad-based strike) has minimized the impact of the strike on new vehicle supply. Analyzing the numbers, Cox Automotive estimated that industry inventory levels are 68% higher this year compared to last year and fleet sales have been significantly higher (up about 60% year-over-year). Cox noted that all major automakers posted double-digit percentage year-over-year gains in third-quarter sales, apart from Stellantis which saw third-quarter sales decline 1% year-over-year as the company pursued higher transaction prices rather than increased volumes. Cox also predicted that Hyundai would move past Stellantis into fourth place for overall sales volume in the U.S. this year, behind Ford, Toyota, and General Motors. In 2019, Hyundai was seventh in the U.S. market behind General Motors, Ford, Toyota, Stellantis (then known as Fiat Chrysler), Honda and Nissan. Used vehicle prices, as measured by the Manheim Used Vehicle Index, were relatively flat this quarter after declines in the second quarter erased first-quarter gains. The index came in at 214.3 in September, an increase of 1% relative to August and a drop of 3.9% year-over-year. Manheim commented in their report that while the UAW strike might slow new retail auto sales and move buyers into the used car market, they have not seen that happening yet. Manheim noted that most major market segments all saw lower seasonally-adjusted prices relative to last year, with compact cars performing the worst (down 9.9%), followed by luxury cars (down 6.7%) and midsize cars (down 5.9%). The only exception was pickups which saw prices rise 0.7% year-over-year. Manheim estimated used retail car supply ended the quarter at 47 days’ supply, down 2 days from August’s levels and 7 days lower than the 54 days of supply seen at the end of last September. Falling supply is generally supportive for used car prices over the short run.
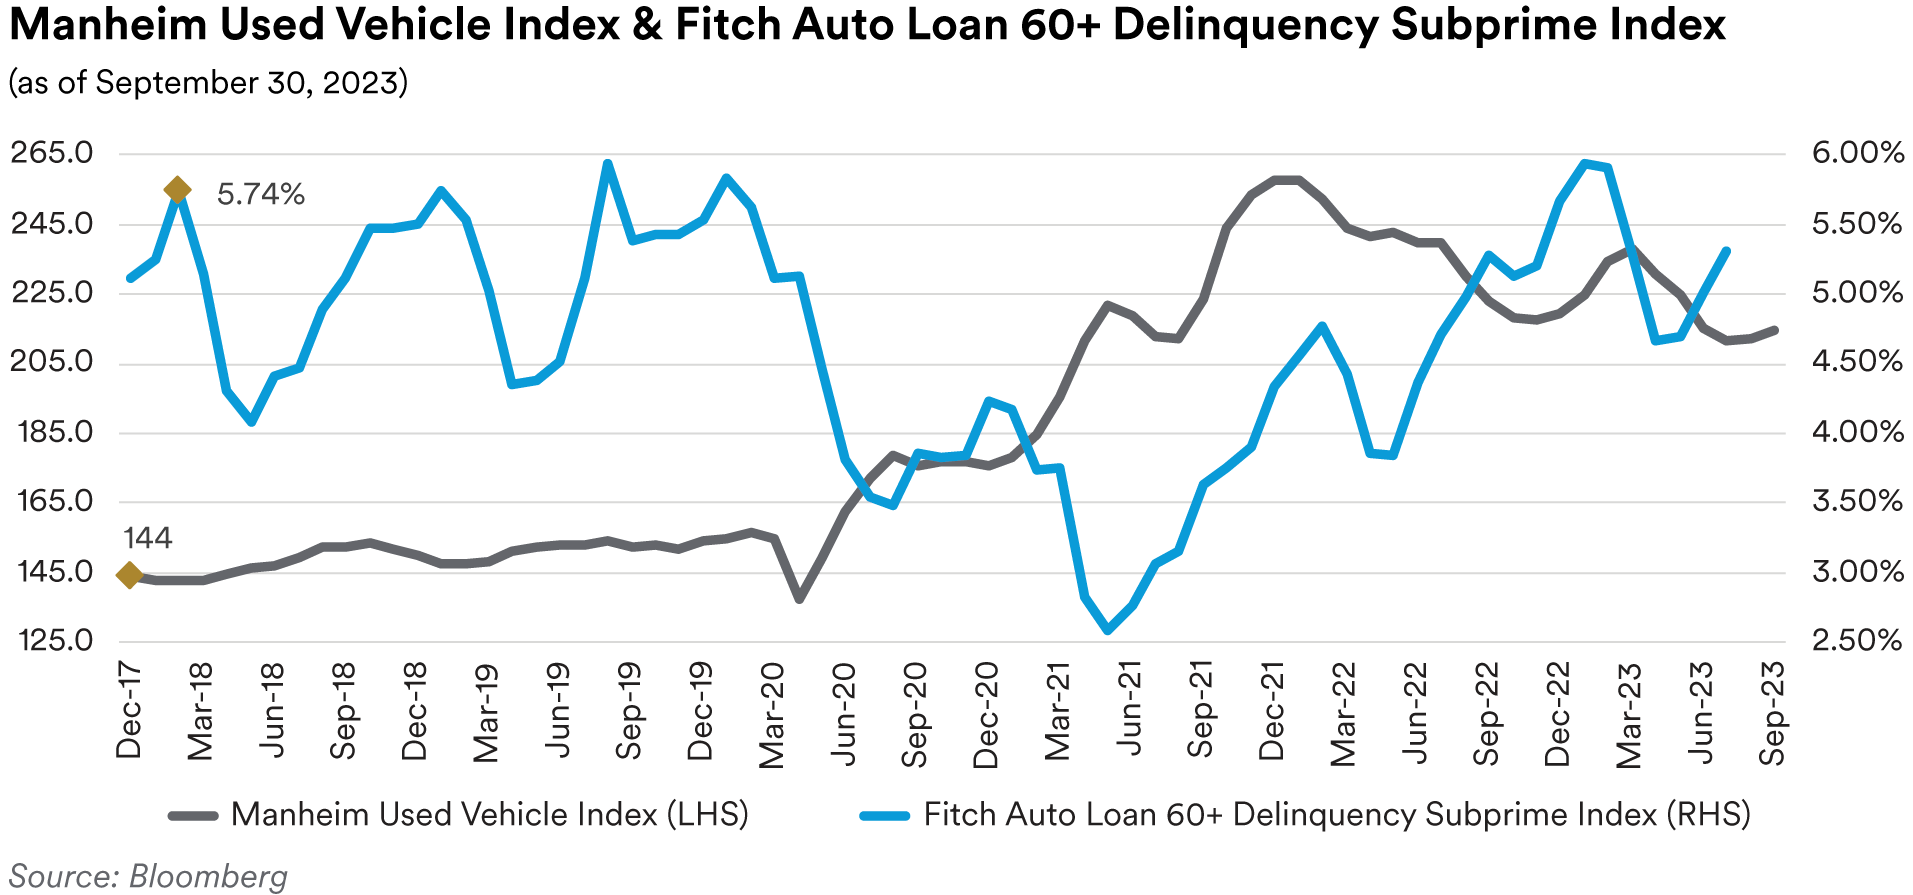
As we have noted in prior commentaries, the headwinds of elevated inflation and higher interest rates continue to hinder auto ABS performance with a disproportionate impact on subprime borrowers. As of July’s, data, the 60+-day delinquency rates on the Fitch Auto ABS indices were 0.24% for the prime index and 5.31% for the subprime index, numbers which reflect increases of 3 basis points and 60 basis points, respectively, above last year’s levels. Similarly, annualized net loss rates for the indices stand at 0.28% for the prime index and 6.96% for the subprime index, 12 basis points, and 178 basis points higher, year-over-year, respectively. In our view, the divergence between the prime and subprime metrics reflects the fact that prime borrowers are better positioned to weather rising interest rates and the inflationary pressures of higher prices than subprime borrowers. Despite this expected downturn in performance, we are comfortable with our holdings in AAA and AA-rated auto tranches as we believe these deals have ample credit enhancement to protect bondholders. That said, at current spread levels we generally prefer to add prime tranches to our portfolios rather than subprime tranches.
In the current Fed Senior Loan Officer Opinion Survey, which reflected sentiment as of the second quarter, banks generally reported tightening lending standards for all consumer loan categories. Banks also indicated seeing flat demand for credit cards and weaker demand for auto and consumer loans. The survey contained a series of special questions relating to the current levels of lending standards compared to the midpoint of the range over which lending standards have varied since 2005 and questions related to banks’ expectations for further changes in lending standards. In response, banks reported that lending standards were on the tighter end of the historical range, especially for subprime credit card and auto loans. Banks also indicated that they expect to further tighten lending standards for credit card and auto loans.
Portfolio Actions: We increased our portfolio exposure to ABS across all of our strategies over the third quarter. The increase was focused on prime autos but also included additions to our equipment and credit card holdings. As we have noted in prior commentaries, given our current expectations for interest rates and the economy, we are favoring these particular subsectors as we believe they are the most liquid and defensive. In our shorter portfolios, we continued to purchase the front-pay “CP” tranches of various auto and equipment deals (these tranches stand at the top of the payment waterfall and carry short-term commercial paper ratings equivalent to AAA). In essence, since they are structured to receive the first principal payments from the deal, they are the safest tranches in ABS deal structures from a credit perspective). For our longer portfolios we have focused on one-year AAA-rated senior tranches. These securities have a favorable liquidity profile due to their very short average lives and currently benefit from the inverted yield curve so often provide higher yields than longer tenor alternatives. Our purchases were made in both the primary new issue and secondary markets. Notable new issue trades over the quarter included the purchases of a Canadian credit card securitization and a senior tranche of a dealer floorplan securitization from a truck manufacturer. In July, for our 1-3 year portfolios we purchased the single-A rated, two-year tranche of a Canadian credit card deal at a spread of 160 basis points over Treasuries. In September, also for our 1-3 year portfolios, we purchased the AAA and AA-rated, 1.9-year tranches of the floorplan deal at spreads of 125 and 155 basis points over Treasuries, respectively.
Outlook: Our outlook for ABS remains essentially unchanged as we still expect worsening economic conditions going forward that will negatively impact ABS trust credit performance. Accordingly, we are likely to weight our purchases towards more defensive tranches and subsectors. We still favor short-tenor auto and equipment tranches. As noted above, we prefer prime auto over subprime. That said, we remain comfortable with a select group of subprime issuers that have a demonstrated history of successfully operating through credit cycles and have business models and underwriting practices with which we are very familiar. We continue to avoid increasing our CLO exposure as we believe leveraged loans will suffer heightened downgrades and defaults.
Performance: Our ABS positions produced positive results across all of our strategies in the third quarter, with pronounced outperformance in our 1-3 year strategy. Overall, credit cards and equipment ABS were the best performing although all subsectors were positive. Within credit cards, our holdings of Canadian credit cards were among the top performers.
CMBS
Recap: Compared to like duration Treasuries, short-tenor CMBS spreads showed mixed performance over the course of the third quarter with non-agency spreads moving tighter and agency spreads moving wider. At the end of the quarter, spreads on three-year AAA-rated conduit tranches stood at 136 basis points over Treasuries, 9 basis points tighter than at the start of the quarter. Spreads on five-year AAA-rated conduit tranches were 145 basis points over Treasuries, 10 basis points tighter. In contrast, three-year Freddie Mac “K-bond” agency CMBS tranches ended the quarter at a spread of 36 basis points over Treasuries, 12 basis points wider over the quarter. In our view, the divergent performance reflects a combination of limited new issuance of conduit tranches which is supportive for spreads and continued problems for regional banks, traditionally a large buyer of agency CMBS bonds. For the year, both sectors are wider with three and five-year conduit tranches 11 basis points and 17 basis points wider, respectively, and three-year “K-bond” tranches 9 basis points wider year-to-date. The quarter saw the highest issuance volumes so far this year with $51.1 billion of new deals coming to market which was only slightly behind the $51.8 billion seen in the third quarter last year. As in prior quarters, issuance was dominated by agency deals with $34.6 billion of new agency CMBS printing, in comparison to only $16.4 billion of non-agency deals. Despite the disparity, this quarter’s non-agency issuance still exceeded the combined volume of first and second quarter non-agency deals. On a year-to-date basis, non-agency issuance is down almost 65% compared to last year. In comparison, agency issuance is down 21%.
CMBS delinquencies ended the quarter higher, led by weakness in office properties. As measured by the Trepp 30+-day delinquency rate, CMBS delinquencies ended the quarter at 4.39%, reflecting an increase of 14 basis points for the month of September and an overall increase of 49 basis points for the quarter. Year-over-year the overall delinquency rate has climbed 147 basis points. Office properties continued to dominate the headlines with delinquencies in that subsector rising 51 basis points in September and 118 basis points for the quarter to 5.58%, displacing lodging properties as the second-worst performing subsector behind retail properties (which posted 6.29% delinquencies at quarter end). The industrial and multifamily subsectors remain the best performing with delinquencies of 0.30% (3 basis points lower on the quarter) and 1.85% (1 basis point higher on the quarter), respectively. Delinquencies are likely to continue to worsen for the foreseeable future in our view as maturing loans struggle to secure new financing at higher cap rates.
Commercial real estate prices as measured by the RCA CPPI National All-Property Composite Index were essentially flat over the course of third quarter with the index inching down from 151.8 to 151.6 as of August’s data. However, the index has now dropped for 13 straight months and, year-over-year, prices are now down 9.9% with the greatest weakness seen in the fourth quarter of 2022 and first quarter of 2023. Similar to last quarter, apartment properties continue to show the greatest decline, dropping 14.9% year-over-year. RCA noted that apartment prices peaked in July of 2022 and have been dropping since then, but the pace of the decline has been decelerating recently. Office properties were the next worse performing with prices down 8.3% year-over-year. The decline has been worse for suburban office properties than central business district (“CBD”) properties, with declines of 8.4% and 5.2%, respectively. Industrial properties were the best performing. After posting their first annual price decline last quarter (down 0.8%), industrial property prices fell further and are now down 1.9%, year-over-year. However, despite recent declines, industrial property prices are still 37.7% above their level in March 2020 at the onset of the Covid-19 pandemic.

The most recent Fed Senior Loan Officer Opinion Survey, reflecting sentiment as of the second quarter, showed banks reporting tighter standards and weaker demand for all commercial real estate (“CRE”) loan categories. Most banks reported that lending standards were at the tighter end of the historical range for all types of CRE loans and that they anticipated further tightening of lending standards for the remainder of 2023. Historically, tightening lending standards precede periods of rising delinquencies and charge-offs for CRE loans.
Portfolio Actions: Over the course of the third quarter, we generally increased our exposure to CMBS in all of our strategies except our short Cash Plus strategy. In Cash Plus, we slightly reduced our exposure by reinvesting the paydowns and maturities of our portfolio holdings into other spread sectors. In our other strategies, the increase in CMBS exposure was modest and focused on increasing agency CMBS to bolster the liquidity profile of our portfolios. In addition, we also opportunistically added fixed-rate conduit “ASB” tranches. As we have noted in the past, we believe ASB tranches are relatively defensive and offer stable average- life profiles across a broad range of collateral prepayment and default scenarios. With one exception, our activity consisted of secondary market trades. The exception was our participation in a new issue fixed-rate, single-asset, single-borrower (“SASB”) transaction collateralized by a portfolio of logistics distribution centers leased to a major online retailer. With lease terms extending well beyond the maturity of the securitization, this deal reflects the defensive type of SASB deals we prefer in the current environment. We purchased the three-year, AAA-rated tranche of the deal at a spread of 145 basis points over Treasuries.
Outlook: Given our expectations for worsening delinquencies and continued price deterioration for commercial real estate, we remain cautious around CMBS. Accordingly, we are unlikely to materially increase our exposure to the sector for the foreseeable future. In the near term, our purchases are likely to follow our recent pattern of preferring more liquid agency tranches over conduit tranches and within conduit, preferring short-tenor “ASB” tranches over less stable alternatives.
Performance: With the exception of our longest strategy, our CMBS holdings contributed positive performance to all of our portfolios after adjusting for their yield curve and duration exposure. Within our longest strategy, CMBS performance was negative driven by weakness in our agency CMBS holdings, which comprise the vast majority of the CMBS positions in the strategy. Agency CMBS were generally negative across all strategies due to wider benchmark spreads as discussed above. However, in our other strategies, positive performance from our non-agency holdings was sufficient to offset weakness in agencies and generate positive performance in the aggregate. Notable outperformance was seen in our Enhanced Cash strategy, a result of tighter spreads on our holdings in floating-rate SASB tranches. Within agency CMBS, our Freddie Mac multi-family “Small Balance” tranches generally performed better than our “K-bond” and “DUS” holdings.
RMBS
Recap: Residential mortgage-backed spreads ended the third quarter mixed as rising interest rates impacted the market in the latter half of the quarter. July saw the Bloomberg mortgage index post 28 basis points of positive excess return, which was subsequently erased by weakness in August (which saw 33 basis points of negative excess return) and September (which saw 81 basis points of negative excess return). On a spread basis, generic 30-year collateral ended the quarter at a spread of 175 basis points over ten-year Treasuries (4 basis points tighter) while 15-year collateral ended the quarter at a spread of 123 basis points over five-year Treasuries (13 basis points wider). We attribute the relatively better spread performance of longer collateral to 30-year yields absorbing some of the shift in the yield curve seen over the quarter (the yield spread between 10-year and 5-year Treasuries moved from -32 basis points at the end of June, to -3 basis points at the end of September, as longer rates sold off more significantly than shorter rates during the quarter). Non-agency spreads tightened over the quarter as the higher coupons on newly issued deals offered an attractive yield proposition to investors even at very slow prepayment speed assumptions. Prime jumbo front cashflow tranches ended the quarter at a spread of 170 basis points over Treasuries (30 basis points tighter).
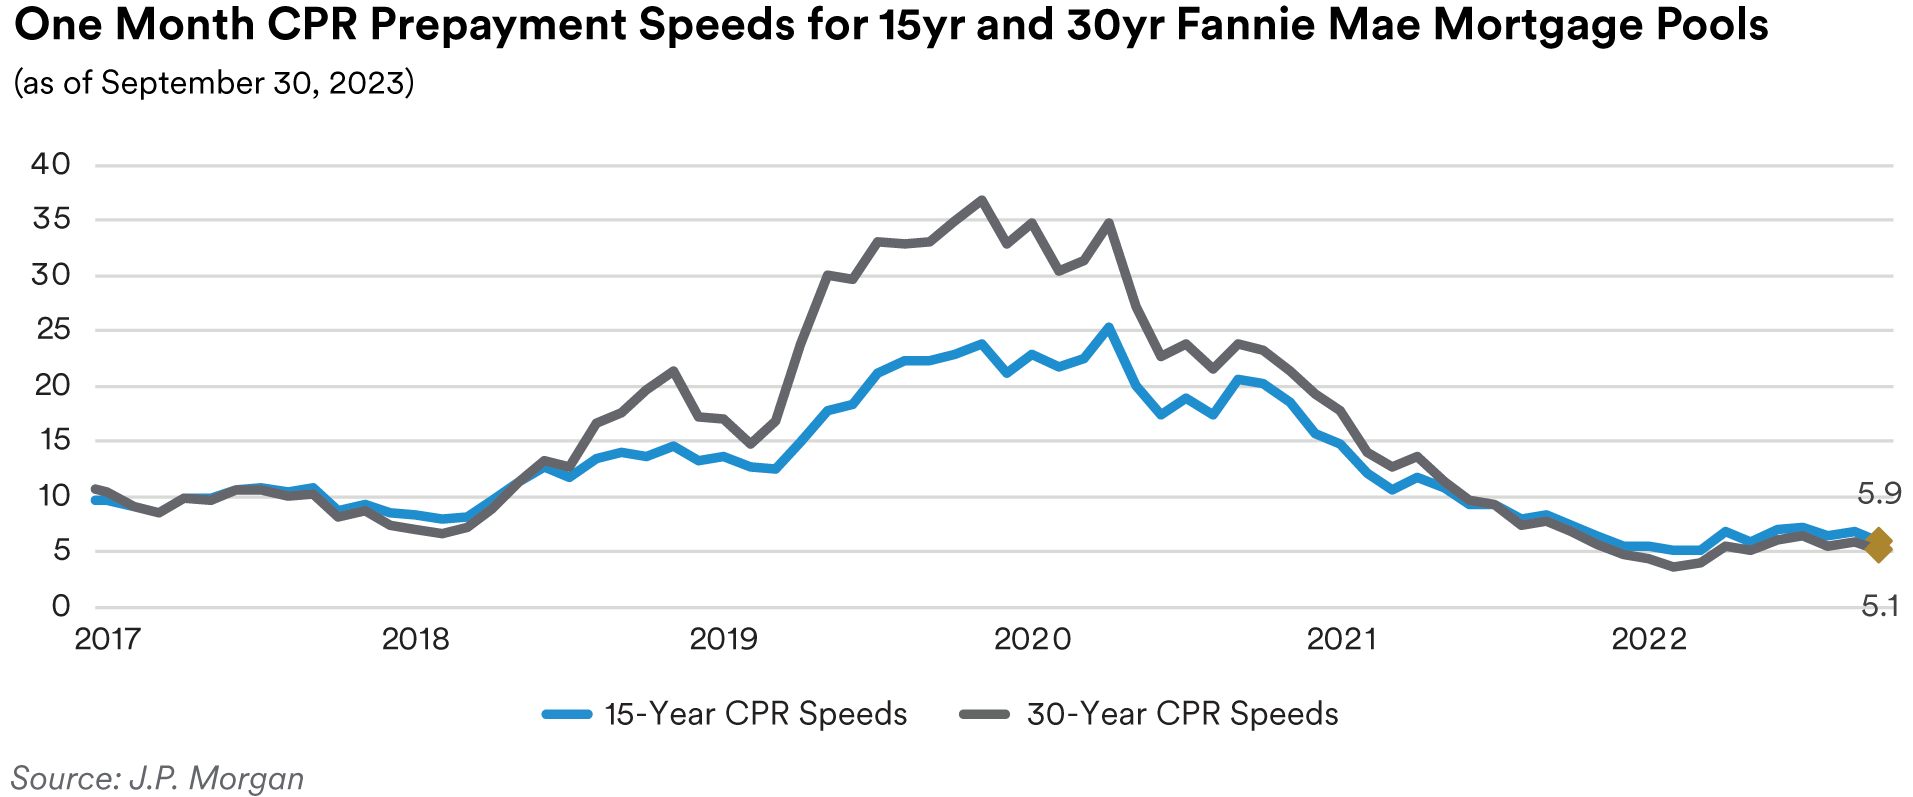
Mortgage rates moved consistently higher throughout the quarter as Treasury rates rose with the Freddie Mac 30-year fixed-rate mortgage commitment rate ending September at 7.35%, 65 basis points above June’s 6.70% close. This is the highest mortgage rate seen since the year 2000. However, unlike the conditions seen in the housing market back then, currently home prices are rising along with mortgage rates as housing inventory levels remain very low. As we have noted in prior commentaries, this is creating significant affordability challenges for many home buyers. In addition, potential sellers may be reluctant to put their current homes on the market as they are concerned about being unable to replace their existing low mortgage rate in any future housing purchase. With the vast majority of existing mortgages well below current rates (61% of mortgages have coupons of 4% or less), prepayments remain very muted. October’s prepayment report showed 30-year Fannie Mae mortgages paying at 5.1 CPR in September, down 16% from August’s 6.0 CPR print. Likewise, 15-year mortgages are also exhibiting slow prints, paying 5.9 CPR in September, down 14% relative to August’s 6.9 CPR print. With mortgage rates at 20-year highs as the market enters the fall when seasonal factors traditionally dampen speeds, there is little chance that prepayments will move higher in our opinion. Accordingly, we expect to see low to mid-single digit prints persist for the foreseeable future. As noted above, home prices moved higher over the quarter fueled by tight inventory levels. The Case-Shiller National Home Price Index has now risen for six straight months. September’s release showed home prices are up 1% year-over-year on a national level through July. Chicago (+4.4%), Cleveland (+4.0%) and New York (+3.8%) showed the greatest annual gains, while Las Vegas (-7.2%), Phoenix (-6.6%) and San Francisco (-6.3%) were the weakest performing areas. In our view, despite scarce inventory, rising mortgage rates are likely to create headwinds for home prices going forward.
Tight inventory levels and high mortgage rates are constraining home sales numbers. Existing home sales volumes fell each month over the quarter. September’s data showed August sales dropping to a 4.0 million annualized pace, the lowest level seen since the start of the year. The inventory of homes for sale slipped to 1.1 million, the smallest August inventory seen in data going back to 1999. At the current sales pace, it would only take 3.3 months to clear the market. New home sales also felt the impact of elevated mortgage rates with September’s numbers showing new home sales printing at a 675,000 annualized pace in August, an 8.7% decline relative to July’s numbers and below economists’ predicted 698,000 pace. Homebuilder sentiment fell significantly over the quarter, with the National Association of Home Builders sentiment index dropping to a five-month low of 45 in September, after falling to 50 in August, which in turn reflected a drop of 6 points from July’s level of 56. The NAHB reported that builders have been offering increasing incentives to entice buyers. Nearly a third of builders surveyed reported to the NAHB that they have lowered prices to boost sales, the largest share seen since the end of last year.
The July release of the Federal Reserve’s Senior Loan Officer Survey, reflecting sentiment in the second quarter, showed banks tightened lending standards for all categories of residential real estate loans and especially for non-GSE eligible loans. Banks also reported weaker demand for all types of residential real estate loans including HELOCs. Banks also indicated that they anticipated further tightening lending standards for residential mortgage loans going forward, particularly for nonconforming jumbo loans.
Portfolio Actions: Over the course of the quarter, we slightly increased our RMBS exposure in our longer strategies while maintaining or modestly decreasing exposure in our 1-3 year and shorter strategies. The decrease in the shorter strategies was very slight and generally reflected the reinvestment of mortgage paydowns into other spread sectors rather than the sale of any RMBS holdings. In our longer strategies we nudged our exposure to specified pools and CMOs higher in connection with our overall strategy of bringing portfolio durations closer to the benchmarks.
Outlook: With mortgage rates at 20-year highs, increased market volatility, concerns about the health of regional banks, and the Fed continuing to adopt a hawkish tone in the face of persistent inflation, we expect continued headwinds for the mortgage market over the near term. In this environment of uncertainty and with mortgages continuing to underperform in the face of rising interest rates, we are not looking to add to our exposure in the sector. Nonetheless, option[1]adjusted spreads are becoming more interesting, and we are closing monitoring the sector. We will continue to evaluate opportunities focusing on short-tenor non-agency holdings but are avoiding non-QM tranches and focusing instead on the NPL/RPL subsector where prepayment speeds are less determinative of overall returns. As always, we remain very mindful of the lower liquidity of non-agency tranches relative to specified pool alternatives.
Performance: Despite the broader weakness in the overall market, our RMBS positions were positive contributors to portfolio performance over the quarter after adjusting for their duration and yield curve exposure. Our non-agency tranches were generally our best performers as they benefitted from the spread tightening as mentioned above. Our specified pool holdings were mostly negative across all of our strategies this quarter, reflective of the underperformance of the sector generally. Our CMO holdings, which are typically shorter tenor, were essentially flat.
Municipals
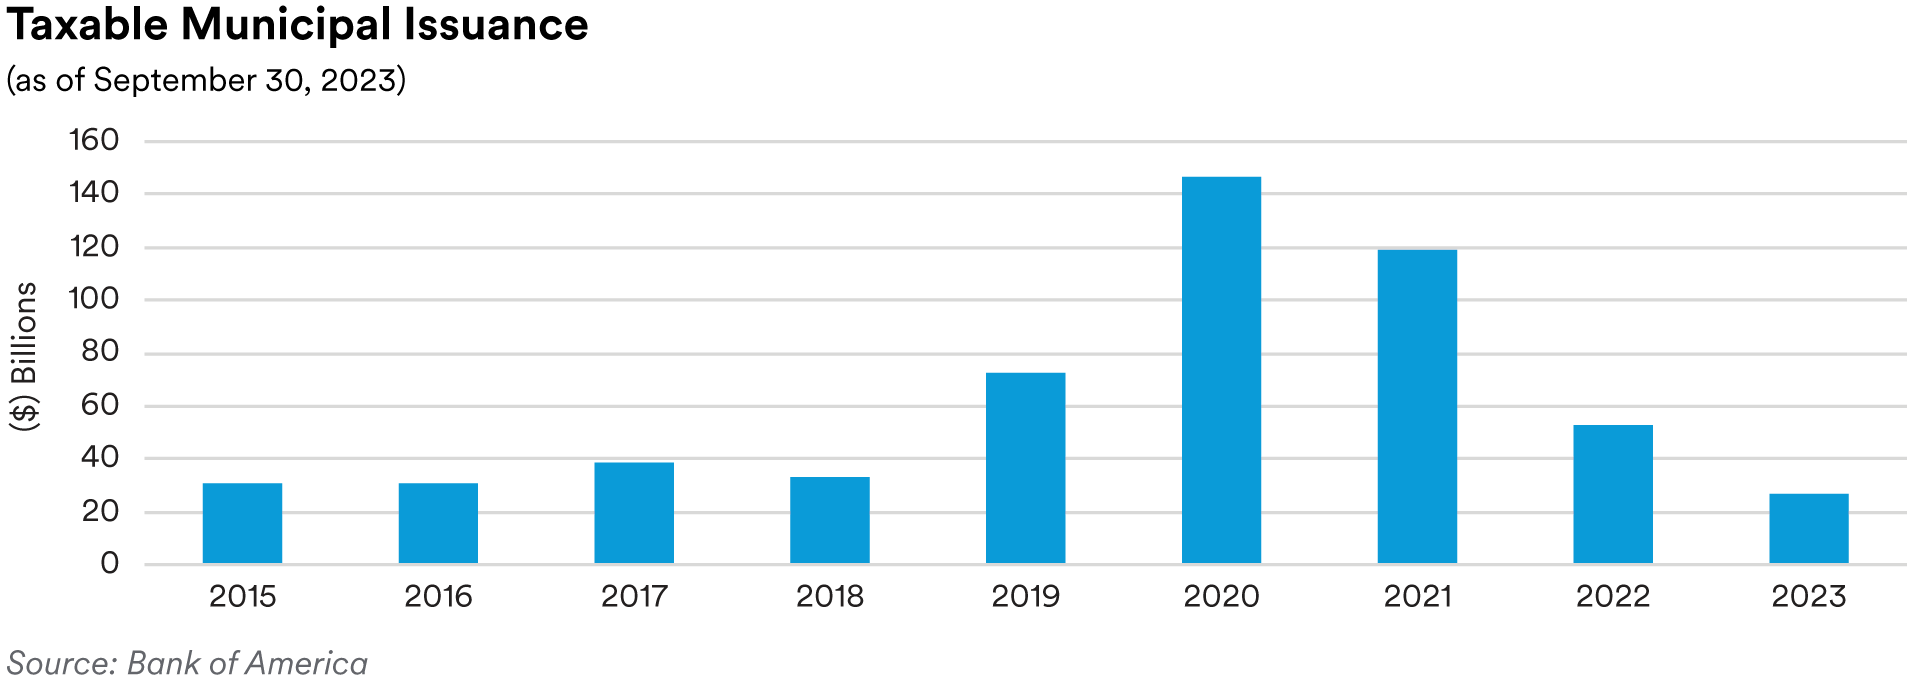
Recap: Total new issue supply was $94 billion in the third quarter and as a component of total supply, taxable municipal issuance was only $6 billion, 51% lower on a comparative period basis. A large proportion of historical new taxable municipal supply had been refunding transactions which are no longer economical for issuers with 525 basis points of cumulative federal-funds rate hikes since March 2022. This lack of supply coupled with investor demand for high-quality assets provided support for the taxable municipal market, resulting in positive excess returns for the sector. For the quarter, the ICE BofA 1-5 Year U.S. Taxable Municipal Securities Index had a total return of 0.51% versus the ICE BofA 1-5 Year U.S. Treasury Index return of 0.23%.
Credit fundamentals, as demonstrated by S&P’s upgrade-to-downgrade ratio of 4.1 to 1 over the first two months of the third quarter, have continued to be healthy. Notable ratings actions during the quarter included moves on a couple of highway-related issuers by Moody’s. North Texas Tollway Authority was upgraded to Aa3 from A1, and the State of Pennsylvania Turnpike Commission was upgraded to A2 from A3. Continued traffic growth along with willingness and ability to enact toll increases while effectively managing costs and capital investments were noted as drivers of the ratings upgrades.
Based on U.S. Census Bureau data collected for state and local tax revenues through June 30, 2023, state receipts have turned negative while receipts at the local level continued to show growth from the four major tax sources (personal income, corporate income, sales and property taxes). The below graph highlights the decline in revenue receipts at the state level, with an increase in revenues at the local level, when comparing the year-over-year percentage change in revenues from these major sources on a trailing four-quarter average basis.

We continue to monitor pension funding levels that can impact state budgets with lower levels having the potential to stress balance sheets. One indicator we monitor is Milliman’s Public Pension Funding Index, which is comprised of the 100 largest U.S. public pension plans. This index fluctuated slightly with market volatility and net negative cash flows during the first two months of the quarter. The Index increased to 76.8% at the end of July from 75.8% in June, and then declined to 75.3% at the end of August. While the index is showing some stability, it remains below the 85.5% ratio reached at year-end 2021.
Portfolio Actions: Our allocation to taxable municipals decreased in our shortest duration strategies and exposure levels increased in our other strategies over the third quarter. With the continuation of municipal spread tightening and limited new issue supply, we monetized some of our shortest duration holdings allowing us to reinvest further out the maturity spectrum. Purchases were focused on high-quality issuers in the airport, essential service, higher education, highway, and state and local obligation sectors, along with additions to select healthcare names.
Outlook: While we believe municipal credit overall is healthy and well prepared for a further slowdown in economic growth, there are a couple trends worth watching. First, tax revenues have shown an acute shift that has brought many states to negative year-on-year growth. Tax collection data for the first quarter of 2023, as reported by the Urban Institute, shows total state tax revenues declining 11.5% in real terms on a year-over-year basis and preliminary data for the second quarter of 2023 has indicated lower personal tax revenues will result in double- digit declines in overall state tax collections. Looking at the State of California, which is one of the most volatile revenue states due to its highly progressive income tax structure, we saw a significant shift in expectations over the last two budget cycles. In the May 2022 budget revision, California expected a surplus of $49 billion for fiscal year 2023. This compares to a deficit of $31 billion in the May 2023 revised budget for fiscal-year 2024. Favorably, the state was able to balance its fiscal-year 2024 budget through a mix of budget cuts and reserves. While the change in revenues is significant, we view it as a normalization of the post-COVID revenue boom and states have strong balance sheets to meet the challenge. We may however see an uptick in mid-year budget adjustments or use of some of the general fund or rainy-day fund balances. The second trend we are watching is commercial real estate. Companies’ increased adoption of hybrid or work-from-home policies has placed pressure on commercial properties as well as lowered spending in large cities. Kastle Systems’ “Back to Work Barometer” shows office occupancy in major U.S. office markets at just under 50% using badge swipe data. This will continue to drive office vacancies as companies rethink their needs. According to Cushman and Wakefield office vacancy rates stood at 19.2% as of the second quarter of 2023 and they expect that number to rise over the next 12 months. Additionally, data collected by S&P shows a decline in annual spending in large cities to be between $2,000 and $5,000 per person. This trend is only getting started and estimated impacts vary widely. For example, the Boston Consulting Group estimates New York City will lose an estimated $5.5-7.5 billion in property tax revenues whereas the New York City Comptroller’s office released a report with a “Doomsday Forecast” that showed a $2.2 billion decline between fiscal-years 2025 and 2027 (maxing out at $1.1 billion in fiscal-year 2027 or 3% of the commercial property tax levy). While it is likely that difficult decisions will need to be made, robust reserves (projected to be 24.7% of expenditures at fiscal-year 2023 per the National Association of State Budget Officers) will allow adjustments to take place over several years.
Within the backdrop of macro market volatility and economic uncertainty, we view an allocation to the municipal sector as a defensive alternative to other spread sectors and will continue to evaluate opportunities to increase our allocation. Keeping our defensive bias in mind, we favor issuers that have well-positioned balance sheets and liquidity along with operating and financial flexibility to manage through what we believe will be a challenging economic cycle.
Performance: Our taxable municipal holdings generated positive performance across all our strategies in the third quarter. On an excess return basis, some of our better performing sectors included Airport, Highway, and State Obligations. Holdings in Not-for-Profit and Local Tax[1]backed issues were mixed but positive in aggregate while select holdings in the Higher Education subsector generated slightly negative excess returns.
Disclaimer
This material is intended solely for Institutional Investors, Qualified Investors and Professional Investors. This analysis is not intended for distribution with Retail Investors.
This document has been prepared by MetLife Investment Management (“MIM”)1 solely for informational purposes and does not constitute a recommendation regarding any investments or the provision of any investment advice, or constitute or form part of any advertisement of, offer for sale or subscription of, solicitation or invitation of any offer or recommendation to purchase or subscribe for any securities or investment advisory services. The views expressed herein are solely those of MIM and do not necessarily reflect, nor are they necessarily consistent with, the views held by, or the forecasts utilized by, the entities within the MetLife enterprise that provide insurance products, annuities and employee benefit programs. The information and opinions presented or contained in this document are provided as of the date it was written. It should be understood that subsequent developments may materially affect the information contained in this document, which none of MIM, its affiliates, advisors or representatives are under an obligation to update, revise or affirm. It is not MIM’s intention to provide, and you may not rely on this document as providing, a recommendation with respect to any particular investment strategy or investment. Affiliates of MIM may perform services for, solicit business from, hold long or short positions in, or otherwise be interested in the investments (including derivatives) of any company mentioned herein. This document may contain forward-looking statements, as well as predictions, projections and forecasts of the economy or economic trends of the markets, which are not necessarily indicative of the future. Any or all forward-looking statements, as well as those included in any other material discussed at the presentation, may turn out to be wrong.
All investments involve risks including the potential for loss of principle and past performance does not guarantee similar future results. Property is a specialist sector that may be less liquid and produce more volatile performance than an investment in other investment sectors. The value of capital and income will fluctuate as property values and rental income rise and fall. The valuation of property is generally a matter of the valuers’ opinion rather than fact. The amount raised when a property is sold may be less than the valuation. Furthermore, certain investments in mortgages, real estate or non-publicly traded securities and private debt instruments have a limited number of potential purchasers and sellers. This factor may have the effect of limiting the availability of these investments for purchase and may also limit the ability to sell such investments at their fair market value in response to changes in the economy or the financial markets.
In the U.S. this document is communicated by MetLife Investment Management, LLC (MIM, LLC), a U.S. Securities Exchange Commission registered investment adviser. MIM, LLC is a subsidiary of MetLife, Inc. and part of MetLife Investment Management. Registration with the SEC does not imply a certain level of skill or that the SEC has endorsed the investment advisor.
This document is being distributed by MetLife Investment Management Limited (“MIML”), authorised and regulated by the UK Financial Conduct Authority (FCA reference number 623761), registered address 1 Angel Lane, 8th Floor, London, EC4R 3AB, United Kingdom. This document is approved by MIML as a financial promotion for distribution in the UK. This document is only intended for, and may only be distributed to, investors in the UK and EEA who qualify as a “professional client” as defined under the Markets in Financial Instruments Directive (2014/65/EU), as implemented in the relevant EEA jurisdiction, and the retained EU law version of the same in the UK.
For investors in the Middle East: This document is directed at and intended for institutional investors (as such term is defined in the various jurisdictions) only. The recipient of this document acknowledges that (1) no regulator or governmental authority in the Gulf Cooperation Council (“GCC”) or the Middle East has reviewed or approved this document or the substance contained within it, (2) this document is not for general circulation in the GCC or the Middle East and is provided on a confidential basis to the addressee only, (3) MetLife Investment Management is not licensed or regulated by any regulatory or governmental authority in the Middle East or the GCC, and (4) this document does not constitute or form part of any investment advice or solicitation of investment products in the GCC or Middle East or in any jurisdiction in which the provision of investment advice or any solicitation would be unlawful under the securities laws of such jurisdiction (and this document is therefore not construed as such).
For investors in Japan: This document is being distributed by MetLife Asset Management Corp. (Japan) (“MAM”), 1-3 Kioicho, Chiyoda[1]ku, Tokyo 102-0094, Tokyo Garden Terrace KioiCho Kioi Tower 25F, a registered Financial Instruments Business Operator (“FIBO”) under the registration entry Director General of the Kanto Local Finance Bureau (FIBO) No. 2414.For Investors in Hong Kong S.A.R.: This document is being issued by MetLife Investments Asia Limited (“MIAL”), a part of MIM, and it has not been reviewed by the Securities and Futures Commission of Hong Kong (“SFC”). MIAL is licensed by the Securities and Futures Commission for Type 1 (dealing in securities), Type 4 (advising on securities) and Type 9 (asset management) regulated activities.
For investors in Australia: This information is distributed by MIM LLC and is intended for “wholesale clients” as defined in section 761G of the Corporations Act 2001 (Cth) (the Act). MIM LLC exempt from the requirement to hold an Australian financial services license under the Act in respect of the financial services it provides to Australian clients. MIM LLC is regulated by the SEC under US law, which is different from Australian law.
MIMEL: For investors in the EEA, this document is being distributed by MetLife Investment Management Europe Limited (“MIMEL”), authorised and regulated by the Central Bank of Ireland (registered number: C451684), registered address 20 on Hatch, Lower Hatch Street, Dublin 2, Ireland. This document is approved by MIMEL as marketing communications for the purposes of the EU Directive 2014/65/EU on markets in financial instruments (“MiFID II”). Where MIMEL does not have an applicable cross-border licence, this document is only intended for, and may only be distributed on request to, investors in the EEA who qualify as a “professional client” as defined under MiFID II, as implemented in the relevant EEA jurisdiction. The investment strategies described herein are directly managed by delegate investment manager affiliates of MIMEL. Unless otherwise stated, none of the authors of this article, interviewees or referenced individuals are directly contracted with MIMEL or are regulated in Ireland. Unless otherwise stated, any industry awards referenced herein relate to the awards of affiliates of MIMEL and not to awards of MIMEL.
1 As of June 30, 2023, subsidiaries of MetLife, Inc. that provide investment management services to MetLife’s general account, separate accounts and/or unaffiliated/third party investors include Metropolitan Life Insurance Company, MetLife Investment Management, LLC, MetLife Investment Management Limited, MetLife Investments Limited, MetLife Investments Asia Limited, MetLife Latin America Asesorias e Inversiones Limitada, MetLife Asset Management Corp. (Japan), MIM I LLC, MetLife Investment Management Europe Limited, Affirmative Investment Management Partners Limited and Raven Capital Management LLC.