We see this improvement in funded status has served as an opportunity for plans to continue derisking, which usually means to sell equities and buy fixed income and consider moving in shorter on the curve.
Since the Pension Protection Act of 2006, many corporate plan sponsors have taken a number of steps to de-risk. Some of these steps have shortened liability duration (e.g., closing the plan to new participants, freezing accruals) while others have lengthened duration (e.g., lump-sum buyouts, retiree only risk transfer). In total, however, we believe these actions and the passage of time have reduced pension liability duration significantly over the past 16+ years.
Conversely, Long Credit, the most prevalent LDI hedging strategy, lengthened in duration as interest rates declined in 2020, although most recently, the trend has reversed as multiple rate hikes ensued over ’22/’23 period. We discuss the transformation of Long Credit in our paper The Evolving Long Credit Universe. We believe the combination of shorter pension liabilities, longer primary hedging assets, and meaningful funded status improvement will likely influence the next phase of liability driven investing whereby higher fixed income allocations will increase the need for key-rate matching to further reduce surplus volatility and refine the hedge.
These aforementioned changes in liability attributes amongst other factors bring us to intermediate corporate credit. We believe adding this strategy offers the following benefits:
- Improved focus on asset allocation with a similar risk and maturity profile as liabilities
- Ability to take advantage of attractive opportunities and new issuance at the belly of the curve
- Access to a broader investment universe with greater diversification
We still expect long duration to remain a staple in most plans’ LDI asset allocation. However, we have noticed a trend of incremental allocations into intermediate credit. In the same way that long duration investment grade strategies tracked pension overall liabilities, we believe intermediate strategies have been a good fit for the first ten-year segment of pension liabilities. Adding intermediate credit is really just a natural extension of traditional LDI strategies as funded status improves. And at current levels of all-in yield, we believe investors are compensated to own bonds in the intermediate part of the curve, at least in the near-term. Discernment is warranted, however, along with careful portfolio construction, which we discuss further below.
As the Federal Reserve continues to focus their monetary policy efforts on fighting inflation, we have seen, at times, significant inversions of the U.S. Treasury curve. For example, the 5s30s curve was as inverted as -45 basis points in early March 2023.1 This inversion has remained relatively rangebound and only recently reversed providing investors with a marginal 11 basis point risk premia, as of April 21, 2023. The notable shifts in the curve have led to a sharp rise in yields on short-dated corporates, which we feel provides an opportunity for a relatively cheap entry point coupled with attractive carry. Additionally, we believe supply and demand technicals have played a unique role this year on corporate credit curves flatness, further enhancing the relative value of intermediate corporates. Notably, financial issuance—a larger sector of the intermediate corporate index, has lagged expectations across the curve. In February 2023, the sector represented only 14% of total issuance in a month where IG issuers printed $152 billion in new issuance, a record amount for that calendar month relative to historical issuance.2
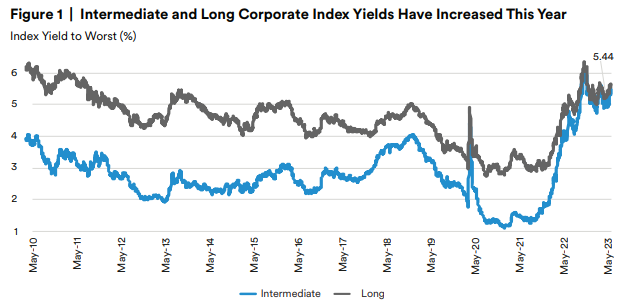
As of March 2023, the Bloomberg Intermediate Corporate Index Yield to Worst remained above 5% and even reached as high as 6.02% peaking in early October.1 As reflected in Figure 1, the Intermediate Corporate Index yield has surpassed levels not seen since 2009, as the current Long Corporate Index yield of 5.44% remains at levels not seen since 2011.
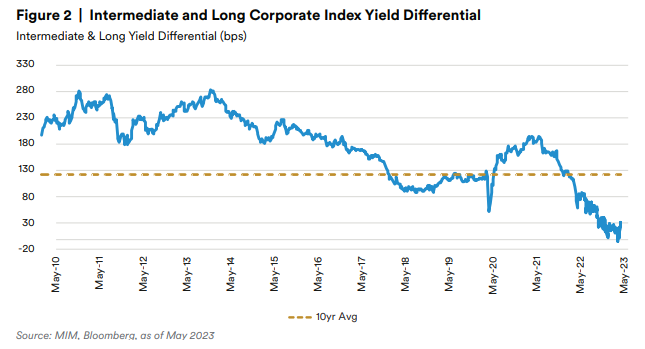
Comparing further, the yield differential between the Intermediate and Long Corporate indices is 30 basis points as of May 31, 2023, which is significantly lower compared to the 10-year average of 121 basis points, suggesting that intermediate corporates have meaningfully cheapened relative to long corporate credit.
When comparing corporate indices across the curve, we observe a number of similarities, such as average credit quality, but also key differences, notably duration and the number of issuers.
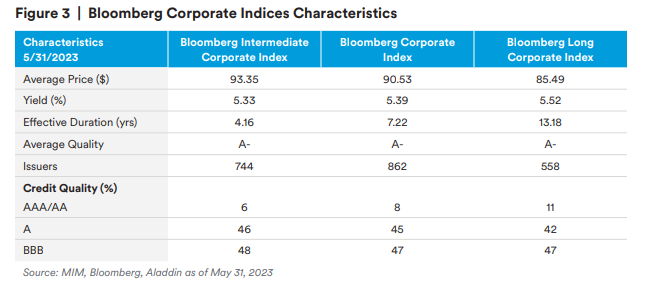
The Bloomberg U.S. Long Corporate Index comprises over 550 issuers, while the Intermediate Corporate Index is broader with over 740 issuers, enabling investors to access a more diversified liquid universe of bonds. While the overlap between the Intermediate and Long Corporate indices is over 435 issuers, there are 300+ issuers unique to the Intermediate Corporate Index as certain issuers are more prone to come to market in the intermediate part of the credit curve.1
Drilling into the index components, a key difference between the Intermediate and Long Corporate benchmarks are sector weightings, with a heavier Financials allocation in Intermediate Corporate at 41.0% versus 16.3% in Long Corporate.1 As noted, not all issuers will issue bonds across all tenors, and in our view, Banking issuers are often trying to match issuance with their asset profiles with a large proportion of supply residing in the belly of the curve. Financials issuance was robust in 2022 and the first month of 2023, however, the sector’s issuance has lagged expectations since January 2023. The average tenor in 1Q23 for Financials issuance was 6.8 years compared to non-Financials at 12.3 years.2
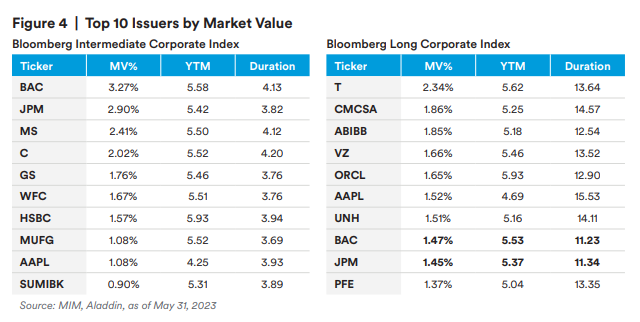
While the Intermediate Corporate Index provides access to a broader array of corporate credit, especially some debut issuers that we have seen surface during the pandemic, it does potentially pose an issue of concentration at the top. Both indices face concentration issues with just ten issuers comprising over 18.5% and 16.5% of the Intermediate and Long Corporate indices, respectively. The sector concentration is different however, as Banks represent nine of the top 10 issuers in the Intermediate Corporate Index, but only two of the top 10 in the Long Corporate Index, as shown in Figure 4. This issue has been even more magnified this past quarter as Banks have been under intense pressure, especially in the regional and Yankee bank cohorts.
Given over 17% of the Intermediate Corporate Index is concentrated in just nine Banking issuers above, investors may look for ways to avoid concentration risks. And when distilling the Financials exposure in the Index further, over 30% comprises Banking with 60+ unique issuers, representing not only the large GSIBs but also Regional and Euro Yankee bank players (together standing at ~11%). Commonly, guidelines could include an issuer cap (1.5%), however, there may be unintended consequences with such a constraint. For example, an issuer cap on the Intermediate Corporate index by the math introduces a larger weight to regional banks relative to GSIB banks; which we would debate introduces other risks even though at the surface addresses concentration. In our view many would agree, the GSIBs are often viewed as a “safe-haven” relative to smaller US banks given their global profile, systemic importance (implied by GSIB), and more stringent regulatory framework they operate within. As such, we would suggest that sector constraints (e.g., 25% financial sector) more appropriately capture the intent around reducing concentration risks while mitigating an introduction of unintended risks. Ultimately, our goal in partnering with clients on these thoughtful engagements is to ensure the proper solution is carefully crafted.
While the Financials concentration is much higher in Intermediate, the defensive Utilities sector exposure in the Long Corporate Index is almost double that of the Intermediate Corporate Index at 12.6% and 6.6%, respectively.1 Regulated utilities are owners of durable assets that provide a necessary service, and, in many places, operate as a regulated monopoly. The higher-quality Electric issuers tend to issue bonds with longer-dated tenors as investors are comfortable seeking longer maturity investments to match their own longer-maturity liabilities. Similar to Utilities, the Communications sub-sector’s outsized share of the Long Corporate market at ~12.7% (versus 6.7% for Intermediate Corporate)1 is largely the result of its ownership of essential long-lived assets including mobile networks (4G/5G) and broadband (cable/fiber). Building out these systems requires large capital outlays to fund infrastructure such as mobile towers, radio equipment, and data centers. Historical M&A is also partially attributable for the sector’s share of long duration maturities given that consolidation results in fewer competing networks with more effective deployment of capital.
The Allocation Decision
As plans continue on their de-risking path, we often get asked whether a blended Intermediate/ Long Corporate benchmark or standalone Intermediate Corporate and Long Corporate allocations are the best route. We believe there are merits to each approach and appreciate that each client’s needs are unique to their portfolio. We have seen a number of our clients also adopt an Intermediate allocation, and in some cases, a broad IG Corporate strategy, in addition to a standalone Long Duration mandate. A number of these additions have coincided with improvements in funded status and expectations for higher rates.
While we manage portfolios to blended benchmarks, we believe managing mandates on a standalone basis offers advantages to plan sponsors. First, stand-alone mandates permit portfolio management specialization with deep expertise and focus on specific market segments. Second, they enable plan sponsors to better compare performance within strategy peer universes. Third, stand-alone mandates simplify liability matching. As plans mature, they can rebalance from long to intermediate to maintain the match. In addition to the rebalancing decisions and benefits, the rebalancing execution can be just as important in today’s volatile environment. This execution decision leads us to suggest exploring opportunities for in-kind transitions from Long Credit mandates to Intermediate Credit mandates to reduce the round-trip transaction costs of trading select credits amongst volatile periods. Similarly, Intermediate mandates can also provide in-kind assets for annuity buy outs of retirees. In our view, segregating intermediate and long allocations provides plan sponsors a lever to fine-tune the key rates in the way that works best for their plan. This ultimately results in not only enhanced precision in refining the hedge, but also when trying to reposition the portfolio over time.
Endnotes
1 Bloomberg, L.P.
2 JP Morgan. US Corporate Credit Issuance Monthly: May 2023.
Disclaimer
This material is intended solely for Institutional Investors, Qualified Investors and Professional Investors. This analysis is not intended for distribution with Retail Investors.
This document has been prepared by MetLife Investment Management (“MIM”)1 solely for informational purposes and does not constitute a recommendation regarding any investments or the provision of any investment advice, or constitute or form part of any advertisement of, offer for sale or subscription of, solicitation or invitation of any offer or recommendation to purchase or subscribe for any securities or investment advisory services. The views expressed herein are solely those of MIM and do not necessarily reflect, nor are they necessarily consistent with, the views held by, or the forecasts utilized by, the entities within the MetLife enterprise that provide insurance products, annuities and employee benefit programs. The information and opinions presented or contained in this document are provided as of the date it was written. It should be understood that subsequent developments may materially affect the information contained in this document, which none of MIM, its affiliates, advisors or representatives are under an obligation to update, revise or affirm. It is not MIM’s intention to provide, and you may not rely on this document as providing, a recommendation with respect to any particular investment strategy or investment.
Affiliates of MIM may perform services for, solicit business from, hold long or short positions in, or otherwise be interested in the investments (including derivatives) of any company mentioned herein. This document may contain forward-looking statements, as well as predictions, projections and forecasts of the economy or economic trends of the markets, which are not necessarily indicative of the future. Any or all forward-looking statements, as well as those included in any other material discussed at the presentation, may turn out to be wrong.
All investments involve risks including the potential for loss of principle and past performance does not guarantee similar future results. Property is a specialist sector that may be less liquid and produce more volatile performance than an investment in other investment sectors. The value of capital and income will fluctuate as property values and rental income rise and fall. The valuation of property is generally a matter of the valuers’ opinion rather than fact. The amount raised when a property is sold may be less than the valuation. Furthermore, certain investments in mortgages, real estate or non-publicly traded securities and private debt instruments have a limited number of potential purchasers and sellers. This factor may have the effect of limiting the availability of these investments for purchase and may also limit the ability to sell such investments at their fair market value in response to changes in the economy or the financial markets.
In the U.S. this document is communicated by MetLife Investment Management, LLC (MIM, LLC), a U.S. Securities Exchange Commission registered investment adviser. MIM, LLC is a subsidiary of MetLife, Inc. and part of MetLife Investment Management. Registration with the SEC does not imply a certain level of skill or that the SEC has endorsed the investment advisor.
This document is being distributed by MetLife Investment Management Limited (“MIML”), authorised and regulated by the UK Financial Conduct Authority (FCA reference number 623761), registered address 1 Angel Lane, 8th Floor, London, EC4R 3AB, United Kingdom. This document is approved by MIML as a financial promotion for distribution in the UK. This document is only intended for, and may only be distributed to, investors in the UK and EEA who qualify as a “professional client” as defined under the Markets in Financial Instruments Directive (2014/65/EU), as implemented in the relevant EEA jurisdiction, and the retained EU law version of the same in the UK.
For investors in the Middle East: This document is directed at and intended for institutional investors (as such term is defined in the various jurisdictions) only. The recipient of this document acknowledges that (1) no regulator or governmental authority in the Gulf Cooperation Council (“GCC”) or the Middle East has reviewed or approved this document or the substance contained within it, (2) this document is not for general circulation in the GCC or the Middle East and is provided on a confidential basis to the addressee only, (3) MetLife Investment Management is not licensed or regulated by any regulatory or governmental authority in the Middle East or the GCC, and (4) this document does not constitute or form part of any investment advice or solicitation of investment products in the GCC or Middle East or in any jurisdiction in which the provision of investment advice or any solicitation would be unlawful under the securities laws of such jurisdiction (and this document is therefore not construed as such).
For investors in Japan: This document is being distributed by MetLife Asset Management Corp. (Japan) (“MAM”), 1-3 Kioicho, Chiyoda-ku, Tokyo 102-0094, Tokyo Garden Terrace KioiCho Kioi Tower 25F, a registered Financial Instruments Business Operator (“FIBO”) under the registration entry Director General of the Kanto Local Finance Bureau (FIBO) No. 2414.
For Investors in Hong Kong S.A.R.: This document is being issued by MetLife Investments Asia Limited (“MIAL”), a part of MIM, and it has not been reviewed by the Securities and Futures Commission of Hong Kong (“SFC”). MIAL is licensed by the Securities and Futures Commission for Type 1 (dealing in securities), Type 4 (advising on securities) and Type 9 (asset management) regulated activities. For investors in Australia: This information is distributed by MIM LLC and is intended for “wholesale clients” as defined in section 761G of the Corporations Act 2001 (Cth) (the Act). MIM LLC exempt from the requirement to hold an Australian financial services license under the Act in respect of the financial services it provides to Australian clients. MIM LLC is regulated by the SEC under US law, which is different from Australian law.
MIMEL: For investors in the EEA, this document is being distributed by MetLife Investment Management Europe Limited (“MIMEL”), authorised and regulated by the Central Bank of Ireland (registered number: C451684), registered address 20 on Hatch, Lower Hatch Street, Dublin 2, Ireland. This document is approved by MIMEL as marketing communications for the purposes of the EU Directive 2014/65/EU on markets in financial instruments (“MiFID II”). Where MIMEL does not have an applicable cross-border licence, this document is only intended for, and may only be distributed on request to, investors in the EEA who qualify as a “professional client” as defined under MiFID II, as implemented in the relevant EEA jurisdiction. The investment strategies described herein are directly managed by delegate investment manager affiliates of MIMEL. Unless otherwise stated, none of the authors of this article, interviewees or referenced individuals are directly contracted with MIMEL or are regulated in Ireland. Unless otherwise stated, any industry awards referenced herein relate to the awards of affiliates of MIMEL and not to awards of MIMEL.
1 As of March 31, 2023, subsidiaries of MetLife, Inc. that provide investment management services to MetLife’s general account, separate accounts and/or unaffiliated/third party investors include Metropolitan Life Insurance Company, MetLife Investment Management, LLC, MetLife Investment Management Limited, MetLife Investments Limited, MetLife Investments Asia Limited, MetLife Latin America Asesorias e Inversiones Limitada, MetLife Asset Management Corp. (Japan), MIM I LLC, MetLife Investment Management Europe Limited, Affirmative Investment Management Partners Limited and Raven Capital Management LLC.