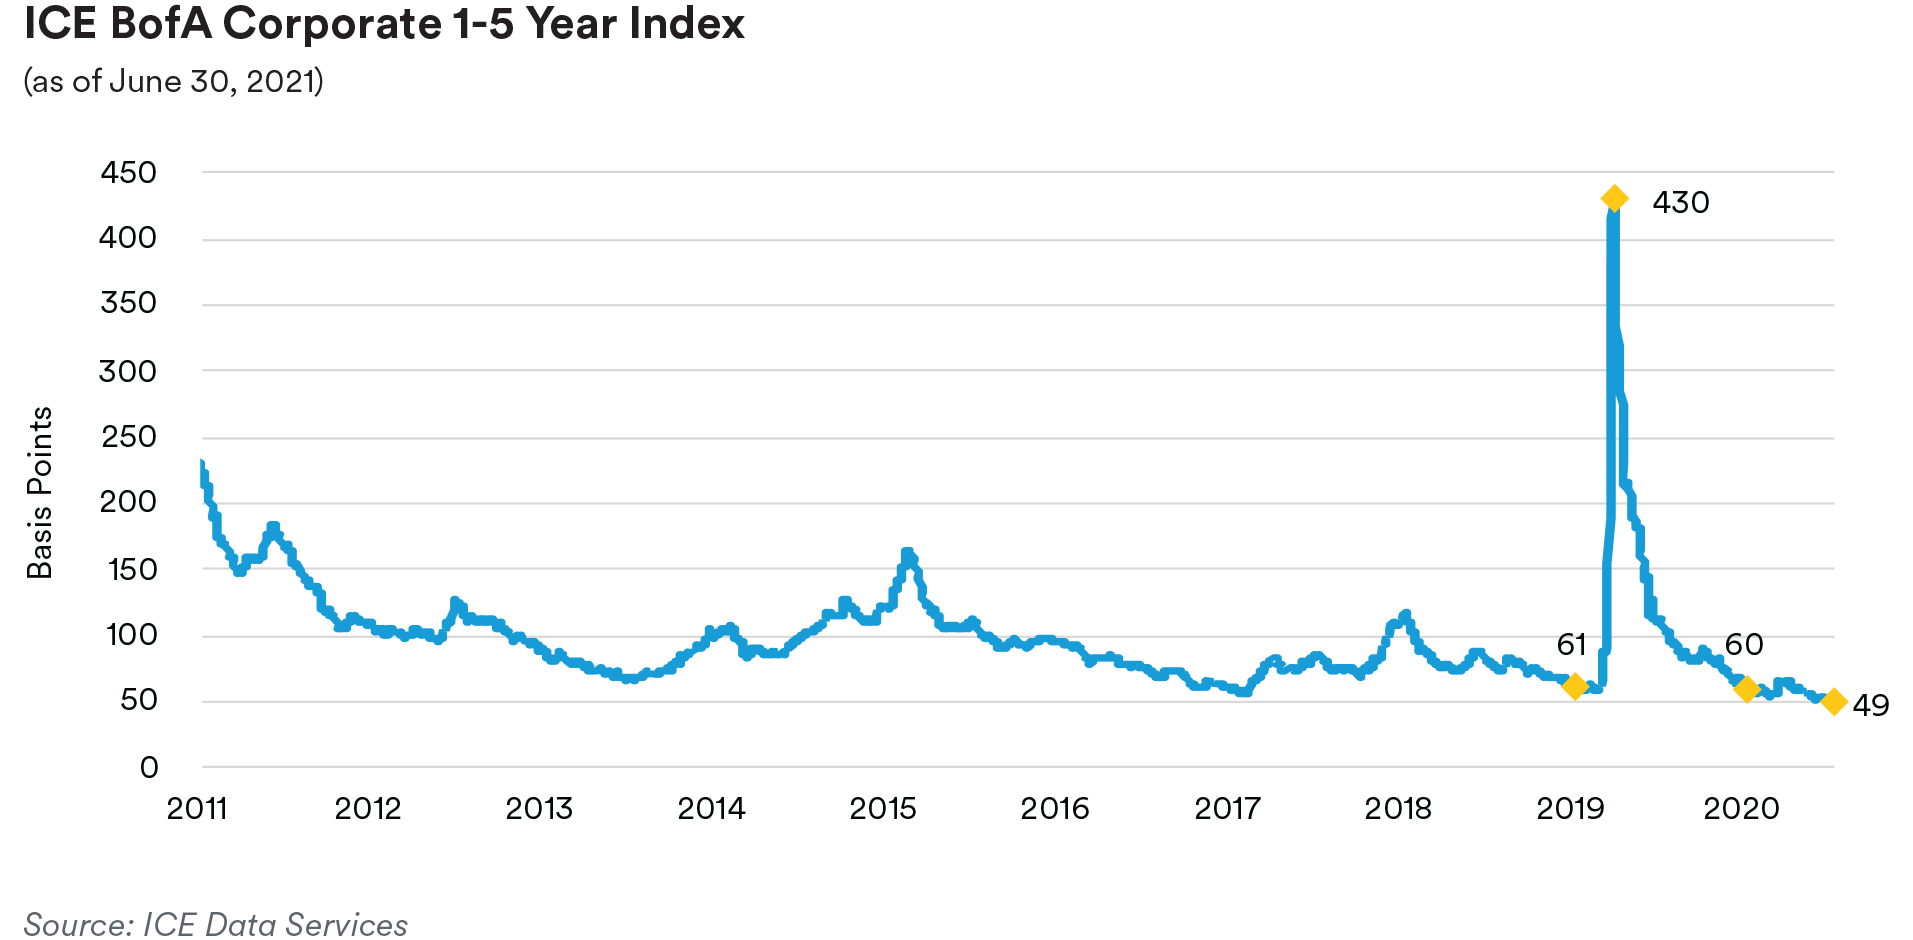
Portfolio Actions & Outlook: We saw the bellwether front-end 1-5 year investment grade corporate index, which began the quarter at an option-adjusted spread (OAS) of 64 basis points, end the quarter at an OAS of 49 basis points, near record tight levels. While the growth picture and fundamental outlook for most companies looks positive over the next several quarters, we remain a bit cautious based on what we view as rich valuations. Demand has returned to pre-pandemic levels for many companies but their cost structures are under pressure due to some of the unique aspects of the global economy’s reopening, which has introduced a number of distortions and higher costs, possibly weighing on earnings and taking some time to correct. In addition, the Fed’s removal of its crisis-era loose monetary policy, no matter how well telegraphed, is expected to lead to higher market and spread volatility, which we expect will lead to the eventual repricing of the investment grade corporate sector wider. As a result, looking ahead we anticipate sticking to our more defensive, up-in-quality positioning and holding sector weightings relatively stable as we did over the second quarter until we see a better entry point develop to increase our risk profile.
Moving on to second-quarter trading activity, we continued to remain fairly selective and disciplined across strategies, mainly focusing on higher-quality issuers in some of our favored, more defensive subsectors like banking, insurance, consumer non-cyclicals, technology and electric utilities. For example, in our shorter strategies’ portfolios during the quarter, we purchased several callable new issues, including a Swiss bank’s two-year, SOFR-linked floating-rate bond and a software company’s three-year, fixed-rate bond issued to finance in part a large acquisition. A large independent oil and gas exploration and production company also came to market with a two-year, fixed-rate new issue we purchased. As an example, some of our purchases were funded by selling a BBB-rated, 1.5-year, fixed-rate utility bond, which had reached our spread tightening objective.
In our 1-3 year portfolios, we were a bit more active over the second quarter on both the secondary and new issue sides. We purchased a U.S. automaker’s three-year, fixed-rate secondary bonds given the strong tailwinds seen in the subsector despite the chip shortage constraining production volumes as we saw the potential for spread compression. Some highlighted new issue purchases included a UK bank’s three-year, SOFR-linked floater, a Texas utility’s three-year, SOFR-linked floater, a Canadian bank’s two-year, SOFR-linked floater, a large U.S. regional bank’s four-year, callable SOFR-linked floater, and a food company’s three-year, callable fixed-rate bond. Our purchases were funded primarily by selling two-year and in fixed-rate bonds where we saw little further value, especially for selected BBB’s, and did not favor that segment of the yield curve given where yields and spreads were.
In our 1-5 year portfolios, in secondary we also purchased a U.S. automaker’s three-year, fixed-rate bonds in addition to an independent oil and gas exploration and production company’s two-year, fixed-rate bonds, a midstream pipeline’s two-year, floating-rate bonds, and a money center bank’s four-year, fixed-rate bonds. On the primary front, new issue purchases included a REIT’s three-year, floating-rate callable, a money center bank’s four-year, floating-rate callables, a UK bank’s long three-year, SOFR-linked floater, an insurance company’s five-year, fixed-rate bonds, a Texas utility’s three-year, SOFR-linked floater, a U.S. regional bank’s four-year, callable SOFR-linked floater, and a Canadian bank’s two-year, SOFR-linked floater. As with the 1-3 year strategy, our selling chiefly encompassed two-year and shorter, fixed-rate corporate bonds where we saw little relative value in an unattractive segment of the maturity spectrum.
While corporate fundamentals are generally pointing in a positive direction, after the incremental spread tightening witnessed in the second quarter, valuations look even less compelling across the investment grade credit landscape. The huge amount of liquidity that global central banks have pumped into markets through direct purchases and other quantitative easing programs has distorted the market’s pricing of credit risk and caused investors to push valuations beyond fair value in many cases in our view. Consequently, we are content to play a bit of a waiting game in terms of trying to nimbly adjust sector exposure higher to try and take advantage of temporary spread or rate backups and selling into strength or rallies when warranted while seeking to capture well-protected carry or spread above comparable Treasuries to generate returns. The dialing up of our risk appetite will only come once valuations reset at sufficiently wider spreads to provide a more attractive entry point. In the meantime, we will continue to focus on investing in more defensive, up-in-quality subsectors and issuers offering what we perceive to be “safe carry”. Our preferred subsectors include banking, consumer non-cyclicals, communications, and electric utilities. We also favor opportunities in BBB’s in the front end of the maturity spectrum where fundamentals and balance sheet liquidity are not in question, but such opportunities have been difficult to source. Given where we sit regarding Treasury yields and the reshaping of the yield curve, we continue to favor floating-rate securities, most often SOFR-linked instruments as part of our overall barbell strategy. As part of the other leg of the barbell, we will also look for opportunities to extend duration with longer dated investment grade credit securities in the 1-3 and 1-5 year strategy portfolios.
Performance: Over the second quarter the investment grade credit sector was a positive contributor to relative performance across all of our strategies. Excess return contributions were driven by broad-based spread tightening in the sector with notable performances from our overweights in the Banking, Automotive, Electric Utilities, Wirelines and Health Care subsectors (including hospital issues traded in the Municipals market but categorized as investment grade corporates).
Treasuries / Agencies
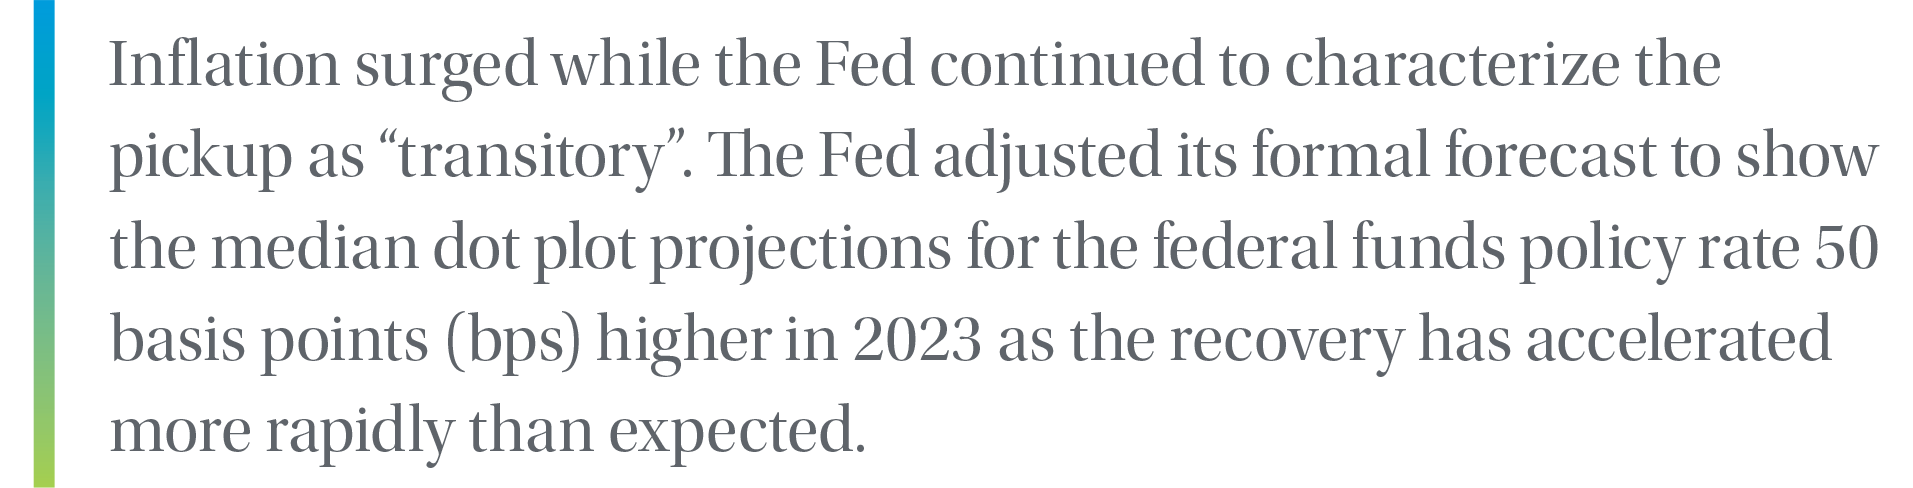
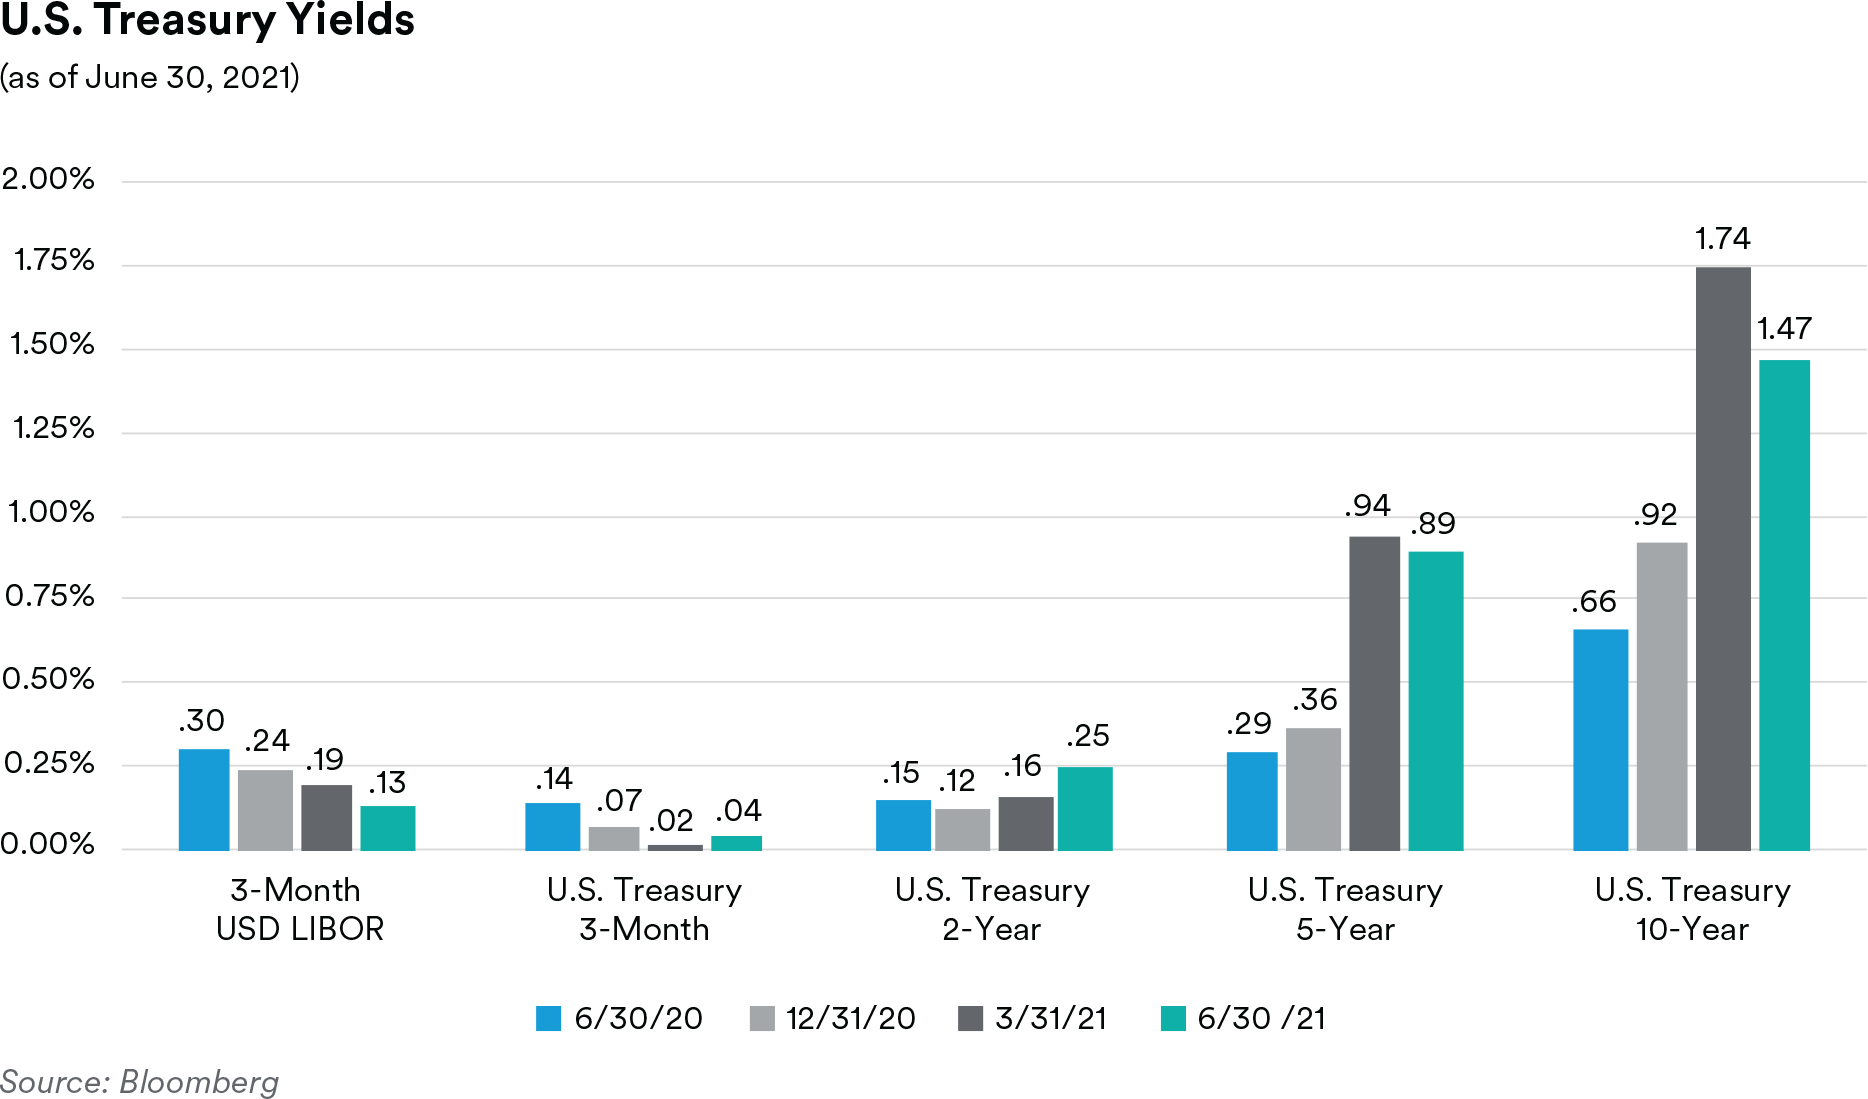
Recap: The second quarter saw front-end interest rates rise while those further out the curve declined as economic data continued to validate the reopening of the economy. Hiring maintained an impressive pace in the second quarter, although we saw below-consensus prints for nonfarm payrolls as the continuation of unemployment benefit payments was cited as a headwind to returning sidelined workers. Inflation surged while the Fed continued to characterize the pickup as “transitory”. The Fed adjusted its formal forecast to show the median dot plot projections for the federal funds policy rate 50 basis points (bps) higher in 2023 as the recovery has accelerated more rapidly than expected. Additionally, in his press conference, Chair Powell confirmed that the June meeting was the “talking about talking about” tapering meeting, validating market expectations while leaving investors hoping that more specifics on the topic will be revealed at the Jackson Hole symposium in late August. Several committee members including Bullard, Bostic and Kaplan all advocated for tapering to begin sooner rather than later. This more hawkish than expected FOMC meeting flattened the yield curve substantially as a more aggressive normalization timeline weighed on front-end and intermediate interest rates. In the very front end of the yield curve, the ongoing glut of cash in the funding markets pushed usage of the Fed’s overnight reverse repo program (RRP) to record highs, approaching $1 trillion. To preserve the integrity of the lower bound of very short tenor interest rates, the Fed executed a technical adjustment at the June FOMC meeting, raising both interest on excess reserves (IOER) and the rate offered via the RRP by 5 bps.
Looking at longer rates, the 10-year Treasury yield moved lower throughout the quarter and following the Fed’s hawkish surprise at the June meeting, reached 1.35% before ending the quarter at 1.47% (after starting the quarter near 1.75%). In terms of the Treasury Inflation-Protected Securities (TIPS) market, inflation breakeven yields surged higher to start the quarter, reaching 280 bps in 5-year TIPS and 260 bps in 10-year TIPS. However, inflation breakeven yields came off sharply after the June FOMC meeting with 5-year TIPS breakevens touching 230 bps and 10-year TIPS breakevens moving to 220 bps before ending the quarter at 250 bps and 234 bps, respectively. Real yields were mixed during the quarter as the 5-year TIPS real yield moved 12 bps higher to -1.63% but 10-year TIPS real yield moved 25 bps lower to -0.88%. Nominal Treasury notes finished the quarter with the two-year Treasury at 0.25%, 9 bps higher relative to the end of the first quarter. The five-year Treasury declined 5 bps to 0.89% while the ten-year Treasury declined 27 bps to close the quarter at 1.47% as mentioned previously. The five-year less two-year Treasury interest rate differential ended the quarter at a spread of 64 bps, 14 bps lower than where it stood at the end of the first quarter. The longer dated ten-year less two-year yield curve differential moved 36 bps lower to +122 bps by the end of the second quarter.
In the very front end, the yield on the three-month Treasury bill increased by two bps to 0.04% while 3-month Libor decreased by four bps to end the quarter at 0.15%. The Agency sector put in a strong performance over the second quarter as spreads continued to tighten in tandem with other fixed income spread sectors as the Fed remained extremely accommodative. Front-end Government-Sponsored Enterprise (GSE) debt spreads moved lower as the option-adjusted spread (OAS) of the ICE BofA 1-5 Year U.S. Bullet (fixed maturity) Agency Index ended the second quarter at just 1 bp, another basis point tighter from the first quarter’s close. GSE spreads ignored the Supreme Court’s ruling during the second quarter regarding the unconstitutional nature of the immunity provided to FHFA Director Mark Calabria. Director Calabria was swiftly fired by President Biden after the decision. In the SSA subsector, U.S. dollar-denominated fixed-maturity securities’ saw spreads tightened by 6-7 bps and finish the quarter, on average, at a spread level of 16 bps over comparable-maturity Treasuries.
Portfolio Actions & Outlook: Over the quarter we increased our allocation to nominal U.S. Treasuries while selling select spread product across various sectors that had, in our opinion, limited potential for further spread tightening. Our objective was to increase the liquidity profile of our portfolios as spreads are at multi-year tights. In addition, we continued to trim our allocation to the agency sector as spreads tightened further during the quarter.
As we enter the second half of the year, the Fed will move closer to tapering its Treasury and mortgage purchases, taking the first step in adjusting their generously accommodative policy matching other central banks (BOC, RBA) around the globe. The impact should push U.S. front-end rates slightly higher, although we do not expect a significant repricing but rather Treasury rates five years and shorter staying in a relatively defined range. We do believe interest rates further out the maturity spectrum are poised to move higher from current levels however, as it becomes clearer that inflation pressures are not fading. At times, technicals in the market may push the path of interest rates out the curve lower, but we would view those moves as temporary unless the economic data, especially inflation readings, were to dramatically change. We feel the yield curve in the front end should continue to remain directional with rates flattening or compressing if yields decline and steepening if yields move higher. Regarding the TIPS market, the Fed’s hawkish June FOMC meeting caused some assets tied to the reflation trade such as TIPS to underperform. Although inflation breakeven yields are well off their May 2021 highs, they are still higher than more recent historical average levels and we would expect higher nominal rates, especially out the curve, to be supportive of TIPS.
Looking forward, we expect GSE supply to continue to decrease across the board as funding needs remain low while the GSEs let their cash balances build. It was anticipated that they would use the cash to fund buyouts from COVID-19-related delinquencies but since forbearance has been extended through September 2021, they are likely to keep cash balances high until at least that time. The changes in issuance will largely manifest themselves in a decline of fixed-maturity bullets and, to a lesser extent, discount notes, contributing to overall negative net issuance. However, we anticipate some of the lower supply to be marginally offset by positive net Agency callable issuance. In addition, we expect fixed-maturity bullets and callable spreads to remain close to their tightest levels we saw in the second quarter during the third quarter as well. Given their marginal yield pickup over Treasuries, we will remain underweight the Agency sector overall. Turning to the SSA space, we expect modestly higher USD funding needs starting in July with new benchmark issuance concentrated in the 3 to 5-year part of the curve, which should be well received as there is still a lot of cash looking to be put to work, even at current spread levels. To that point, spreads of the top tier SSA issuers are at their multi-decade tights across the entire maturity spectrum. Conversely, if we experience a modest depreciation in the EUR/USD cross-currency basis over the second half of 2021, we could see lower funding needs of European SSA issuers in USD.
Performance: Performance from our yield curve posture was mixed amongst the strategies as our shorter portfolios with benchmarks that have a duration of a year or less were negative due to our holdings in the 2 to 3-year part of the curve where yields increased. Our portfolios whose benchmarks have durations of 1 to 3 years saw positive curve performance, however, as our barbell posture with underweights in the 1 to 2-year part of the curve and an overweight in the 3 to 5-year area plus floating-rate investments proved beneficial. To that point, over the quarter the five-year less two-year Treasury interest rate differential compressed by 14 basis points, a net positive to portfolios. Our longest duration strategy had negative curve performance as our underweight in the 10-year part of the curve relative to the benchmark detracted as the curve flattened. Our slight short in duration posture vs. respective benchmarks was additive to performance over the quarter. The Agency sector also contributed slightly to our positive excess returns as spreads tightened across the various subsectors.
ABS
Recap: Spreads on short-tenor ABS tranches moved tighter relative to like-duration Treasuries over the course of the second quarter as investors concerned about increasing volatility sought refuge in high quality, liquid investments. Over the quarter, spreads on two-year, fixed-rate AAA-rated credit card, prime auto and subprime auto tranches moved 8, 14 and 15 basis points tighter to end the quarter at 10, 12 and 18 basis points over Treasuries, respectively. Three-year, floating-rate FFELP student loan tranches tightened 8 basis points over the quarter to end at a spread of 37 basis points over LIBOR. With increasing vaccination rates supporting a reopening of the economy, ABS issuance volume was healthy with almost $69 billion of new deals coming to the market. In comparison, with issuance constrained by the impact of the pandemic, the second quarter last year saw only $33 billion of issuance. For context, compared to 2019 second quarter volume of over $64 billion, this year’s second quarter issuance reflected an increase of over 7%. In typical fashion, the auto subsector was the largest contributor with over $35 billion of deals coming to market in the second quarter. This was followed by almost $15 billion of issuance in the “other ABS” subsector (which includes collateral like cell phone payment plans, timeshares, mortgage servicer advances, insurance premiums, aircraft leases, etc.) and over $8 billion of new student loan ABS issuance. Notably, there was almost $2.7 billion of new credit card issuance which was the heaviest volume seen since the third quarter of 2019.
With the impact of the pandemic receding, credit card trust performance continued to improve over the second quarter. Data from the June remittance reporting cycle as measured by the JP Morgan credit card performance indices showed bank credit card trust charge-offs dropping 41 basis points and 60+-day delinquencies dropping 24 basis points. With trust credit metrics at or near their best levels since the financial crisis, we continue to expect some deterioration in performance going forward. However, given the fact that ABS credit card trusts are backed by seasoned, prime underlying account receivables we do not anticipate any material impact on AAA-rated credit card tranches. Market technicals are also supportive for credit card spreads with an estimated $14 billion of 2021 scheduled trust maturities offset to date by only $3.8 billion of new issuance.
New vehicle sales numbers remain healthy but showed signs of a slowdown as the global computer chip shortage constrained new auto production and dealer inventory levels. Sales numbers printed at an 18.5 million SAAR (seasonally-adjusted annualized rate) pace in April, a 16-year high, but declined in both May (to 17.0 million SAAR) and June (to 15.4 million SAAR). In our view, with the consumer on generally solid footing, demand for new vehicles should remain strong with supply and rising prices the primary constraints upon sales going forward. Notably, the tight market for new vehicles has pushed used car prices to record levels. The Manheim Used Vehicle Index printed at successive record highs through the second quarter and closed June with a 200.4 print, up 36.4% year-over-year. Manheim noted all major market segments saw prices rise on a year-over-year basis in June, with pickup trucks and vans outperforming the overall market. Manheim also indicated that while prices continue to increase, the pace of gains is decelerating.
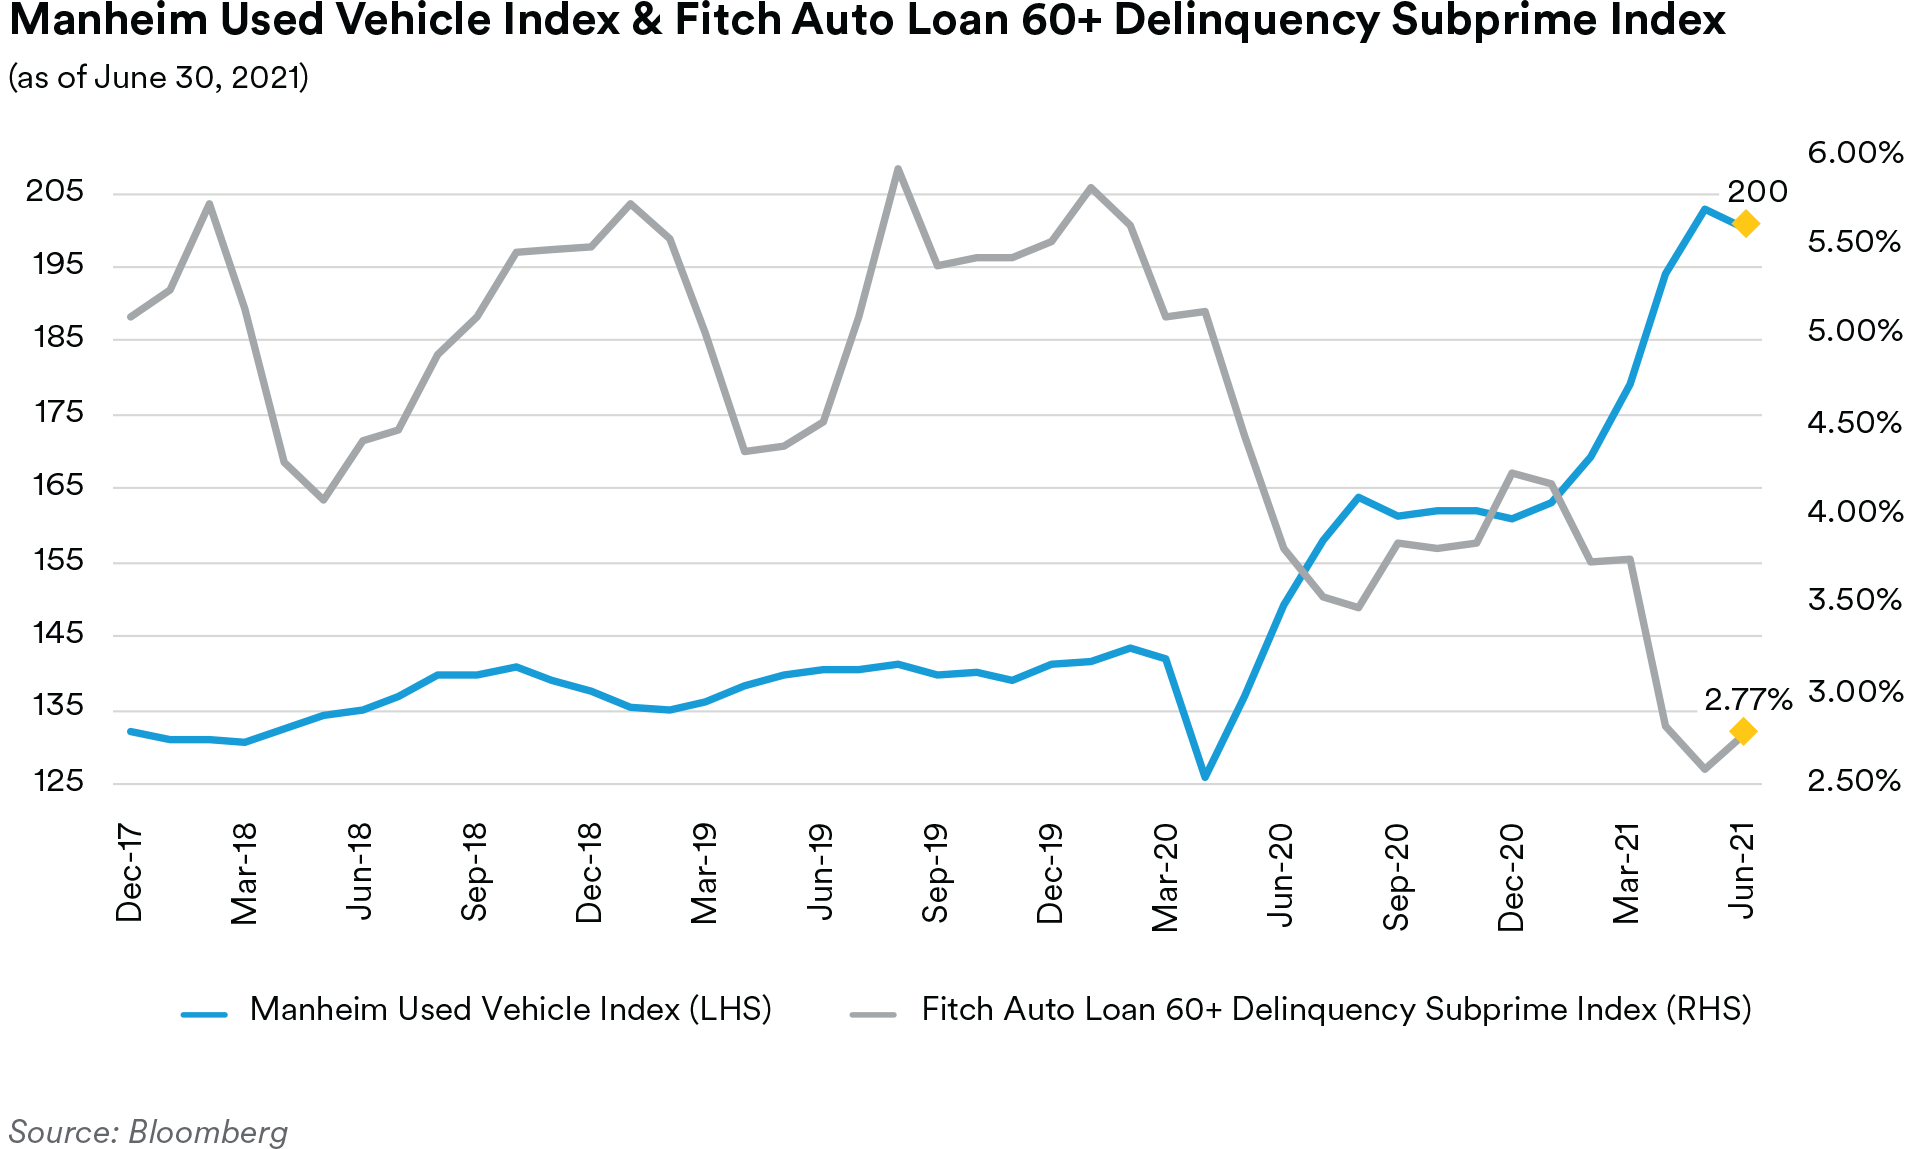
Against this backdrop, ABS auto trust performance metrics remain solid. Through May, the 60+- day delinquency rates on the Fitch Auto ABS indices were 0.14% for the prime index and 2.58% for the subprime index, which reflect decreases from year-ago levels of 13 basis points and 187 basis points, respectively. Likewise, annualized net loss rates for the indices stand at 0.04% for the prime index and 1.84% for the subprime index, 52 basis points and 738 basis points lower year-over-year, respectively. As we have noted in prior commentaries, these kind of performance metrics are not sustainable over the long term and we fully expect to see worsening performance going forward once government stimulus payments and forbearance programs are absent from the market. Despite our “good as it gets” credit outlook, we remain confident that short-tenor auto tranches have more than sufficient credit enhancement to weather any upcoming downturn.
Portfolio Actions & Outlook: Over the course of the second quarter we modestly reduced our ABS exposure in our three-year and shorter duration strategies while increasing our exposure in our longer strategies. Notably, similar to our activity in the first quarter, we continued to increase our CLO holdings while reducing our fixed-rate auto and credit card exposure. Also continuing a trend from the first quarter, we further increased our fixed-rate private student loan exposure in our longer maturity portfolios. We continue to limit our activity in this subsector to short-tenor, senior tranches of deals from benchmark sponsors collateralized by prime credit quality borrowers. We modestly reduced our subprime auto exposure in most of the portfolios by investing the proceeds of prepayments and maturities into other alternatives. In notable new issue activity we participated in the inaugural master trust securitization from a cell phone device manufacturer, purchasing the AA-rated tranche of the deal and we purchased the AAA and AA-rated tranches of a fleet lease deal.
Current spread levels for most benchmark short-tenor ABS tranches remain at or through pre-pandemic tights and do not present a compelling risk-reward proposition in our opinion. Accordingly, we continue to prefer higher yielding alternatives like AAA-rated CLO or private student loan tranches in ABS and other investments in alternate spread sectors. However, our CLO exposure is approaching levels where we are reluctant to keep adding further investments absent a particularly compelling opportunity, so we anticipate generally maintaining our existing exposure. At current spreads, we prefer to abstain from purchasing additional auto, credit card and equipment tranches and expect that our exposure to these subsectors will drift slightly lower due to the impact of prepayments and tranche maturities over the coming quarter. In contrast, we are likely to maintain our current degree of exposure to the fleet lease and dealer floorplan subsectors.
Performance: Despite wider benchmark spreads, our ABS holdings still generated positive performance across all of our strategies in the first quarter after adjusting for their duration and yield curve exposure. All subsectors were positive with our fixed-rate, private student loan positions generally the best performers. Our auto holdings were positive with our subprime auto positions outpacing our prime auto positions. Overall, our fixed-rate investments generally outperformed our floating-rate holdings including our CLO holdings which were essentially flat.
CMBS
Recap: Spreads on short-tenor CMBS securities tightened over the course of the second quarter relative to like-duration Treasuries. At the end of the quarter, spreads on three-year AAA-rated conduit tranches stood at 33 basis points over Treasuries (6 basis points tighter) and spreads on five-year AAA-rated conduit tranches stood at 49 basis points over Treasuries (13 basis points tighter). Agency tranches were also tighter with three-year Freddie Mac “K-bond” tranches moving 14 basis points tighter to end the month at a spread of 29 basis points over comparable Treasuries. In the second quarter, over $83 billion of new issue CMBS came to market, significantly ahead of the $50 billion seen in the second quarter of 2020 when the onset of the pandemic constrained non-agency production. This quarter’s increase was attributable to the non-agency sector which saw over $42 billion of new deals, compared to only $9 billion in the second quarter last year. In contrast, agency issuance was fairly flat with $41 billion of new agency CMBS deals coming to market this quarter versus $40 billion in the second quarter of 2020. Behind the headline non-agency numbers, the single-asset, single-borrower (“SASB”) subsector was dominant with $22 billion of new deals this quarter, followed by the “Other” category (a catchall subsector that includes CRE CLOs) which saw $12 billion of deals, while conduit new issuance topped $9 billion. SASB issuance was bolstered by a large, $4.7 billion securitization of 560 Extended Stay America hotel properties, the second largest floating-rate SASB deal on record (behind only a $5.6 billion industrial securitization sponsored by Blackstone in 2019).
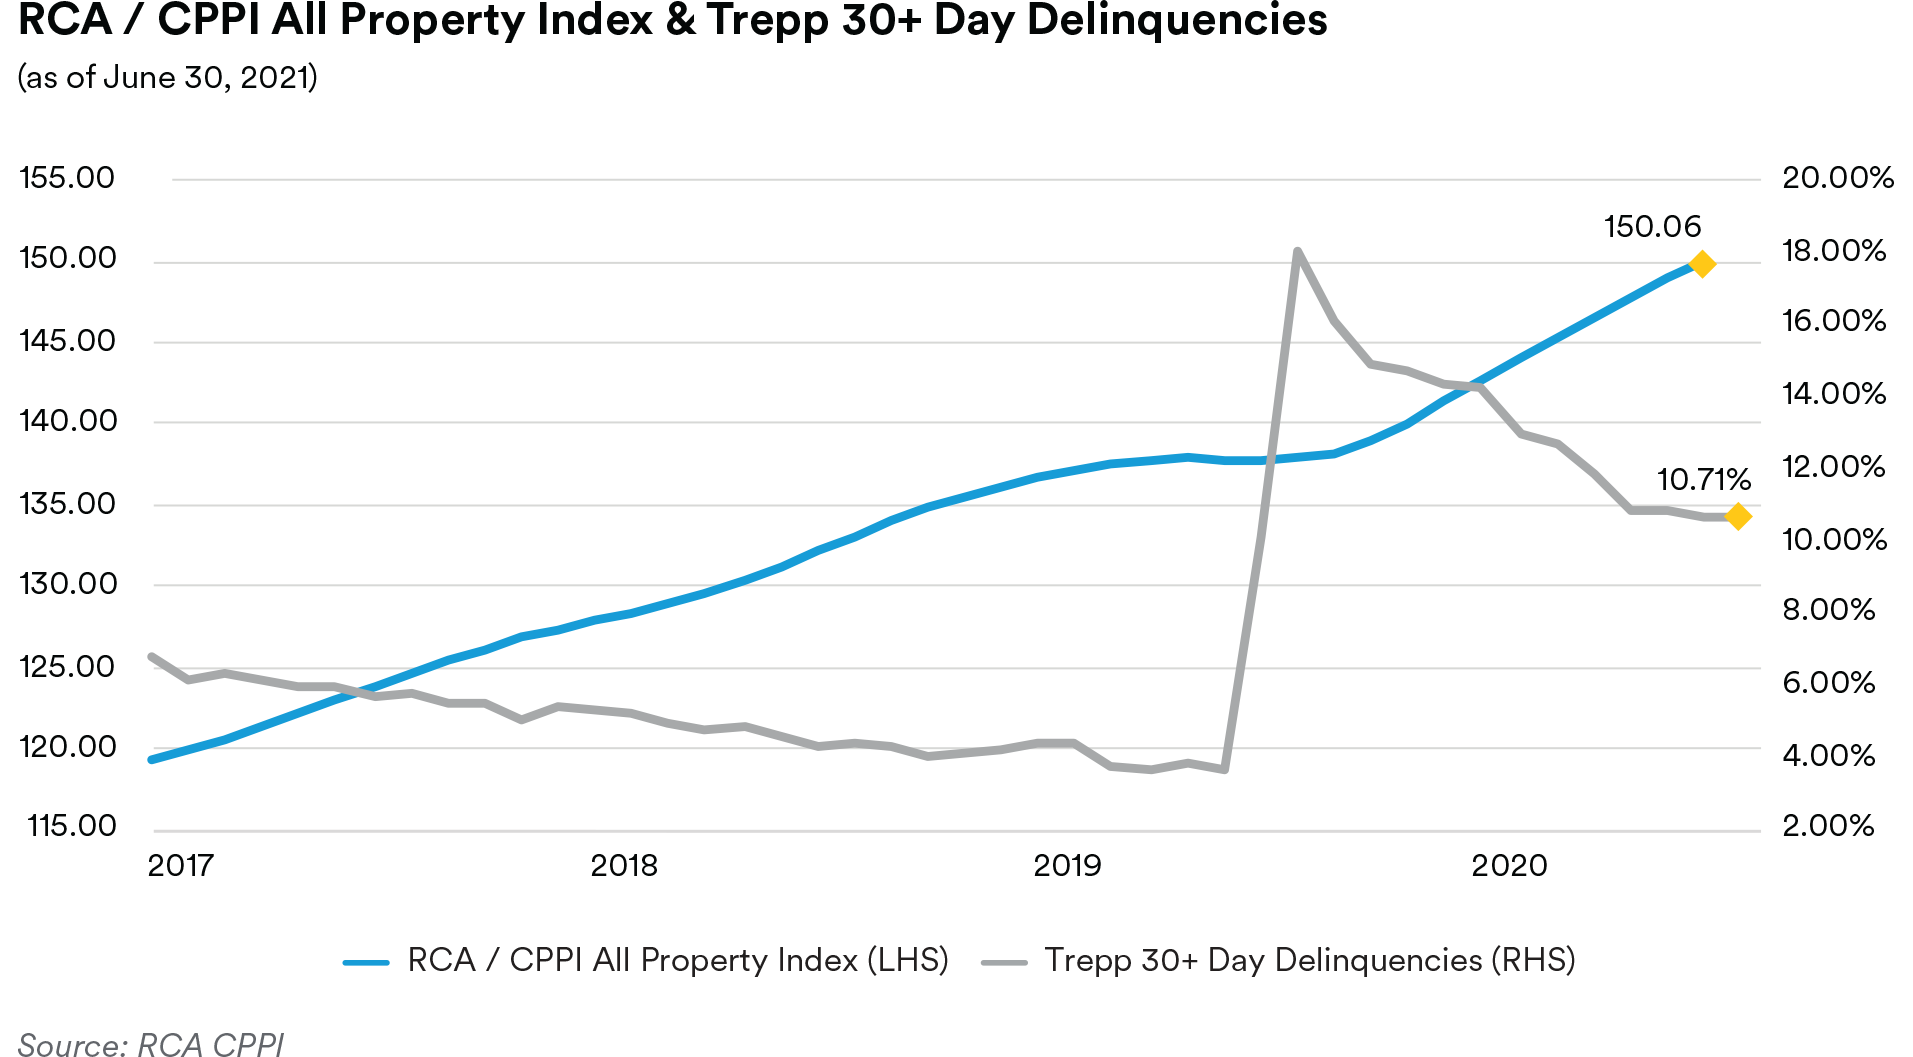
CMBS delinquencies continued their downward trend throughout the second quarter. The Trepp 30+-day delinquency rate ended the quarter at 6.15%, reflecting a drop of 43 basis points for the quarter and capping twelve straight months of declines. Notably however, June’s numbers reflected a mere 1 basis point improvement from May’s level, so the pace of improvement has essentially flattened. CMBS delinquencies surged due to the pandemic, reaching a peak of 10.32% in June 2020 (only slightly below July 2012’s 10.34% all-time high) but have improved steadily since then. Within the various commercial real estate subsectors, lodging properties continue to be the worst performing despite lodging delinquencies dropping 168 basis points over the quarter to 14.27%. One year ago, facing the full impact of the pandemic, lodging delinquencies stood at 24.3%. Retail properties saw a modest 18 basis point decline in delinquencies and ended the quarter at 10.71%. In comparison, retail delinquencies stood at 18.07% one year ago. Multi-family properties saw delinquencies fall 112 basis points to end the quarter at 2.02%, compared to 3.29% last year. Industrial properties remained the best performers with delinquencies falling 8 basis points over the quarter to 0.65%. Industrial delinquencies stood at 1.57% at the end of the second quarter last year.
Commercial real estate prices continued to move higher in the second quarter with the June release of the RCA CPPI National All-Property Composite Index accelerating to an 8.9% annualized gain through May and reaching 150.1. RCA noted that all four major property types posted positive annual growth rates for the second straight month, with the apartment subsector performing the best. Apartment prices grew 10.1% year-over-year, their first double-digit gain since March 2020. Industrial properties rose 9.5% year-over-year through May, a rate similar to that seen in March and April. RCA noted that industrial properties were the most resilient throughout the pandemic with price growth never falling below an 8.9% annualized pace. Office properties posted 2.9% year-over-year gains as weakness in CBD offices constrained prices in that subsector. RCA’s data showed CBD property prices dropping 5.5% year-over-year, in contrast with suburban office properties which saw a 4.5% gain. In an encouraging sign, retail properties ended the quarter showing 2.3% year-over-year price gains through May, posting two consecutive months of positive annualized price growth for that troubled subsector. RCA also noted that the spread between prices in the six Major Metros (Boston, Chicago, Los Angeles, New York, San Francisco and Washington, D.C.) and the Non-Major Metros is now at the widest in over 10 years. Prices in non-major markets continued the trend of acceleration which began mid-2020, rising 10.3% from last May. In contrast, the Major metros have lagged, with prices up only 3.6% annually.
Portfolio Actions & Outlook: Over the course of the quarter we increased our CMBS exposure across most of our strategies. The exception was in our longest duration, 1 to 10-year strategy where we maintained our level of exposure. The increase in other strategies was focused in the non-agency subsector where we added various floating-rate SASB positions both via secondary market trading and in new issue purchases. As in the first quarter, we believe that bank demand has pushed agency CMBS spreads to levels where the sector no longer offers attractive relative value. In floating-rate SASB deals, we participated in a hotel property deal, adding both AAA and AA-rated bonds to our portfolios and also purchased similar rated tranches from other deals collateralized by various industrial, logistics and manufactured housing portfolios.
We expect to continue adding floating-rate exposure going forward, following the barbell strategy we began implementing in the first quarter. We continue to like SASB deals from high-quality sponsors, collateralized by our preferred property types and are still generally avoiding retail, lodging and office properties although we are willing to make exceptions for solid collateral from high-quality sponsors.
Performance: Our CMBS holdings added to performance across all strategies over the quarter after adjusting for duration and yield curve positioning. Our non-agency holdings were generally the best performers across all our strategies. Within non-agencies, our floating-rate SASB positions generally outperformed our fixed-rate conduit holdings. Our AA-rated SASB holdings posted better returns than our AAA-rated positions commensurate with their greater coupon income. Our agency holdings posted modest positive returns for the quarter across all strategies.
RMBS
Recap: Residential mortgage-backed securities showed mixed performance over the course of the second quarter as concern about possible tapering of the Fed’s QE MBS purchase program weighed upon the sector. Shorter duration generic 15-year collateral ended the quarter at a spread of 34 basis points over five-year Treasuries (11 basis points tighter) while longer duration generic 30-year collateral ended the quarter at a spread of 36 basis points over ten-year Treasuries (7 basis points wider). With the bulk of the Fed’s purchases taking place in the 30-year sector, we attribute the relatively better performance of 15-year collateral to the perception that 30-year pools will suffer more from any Fed tapering.
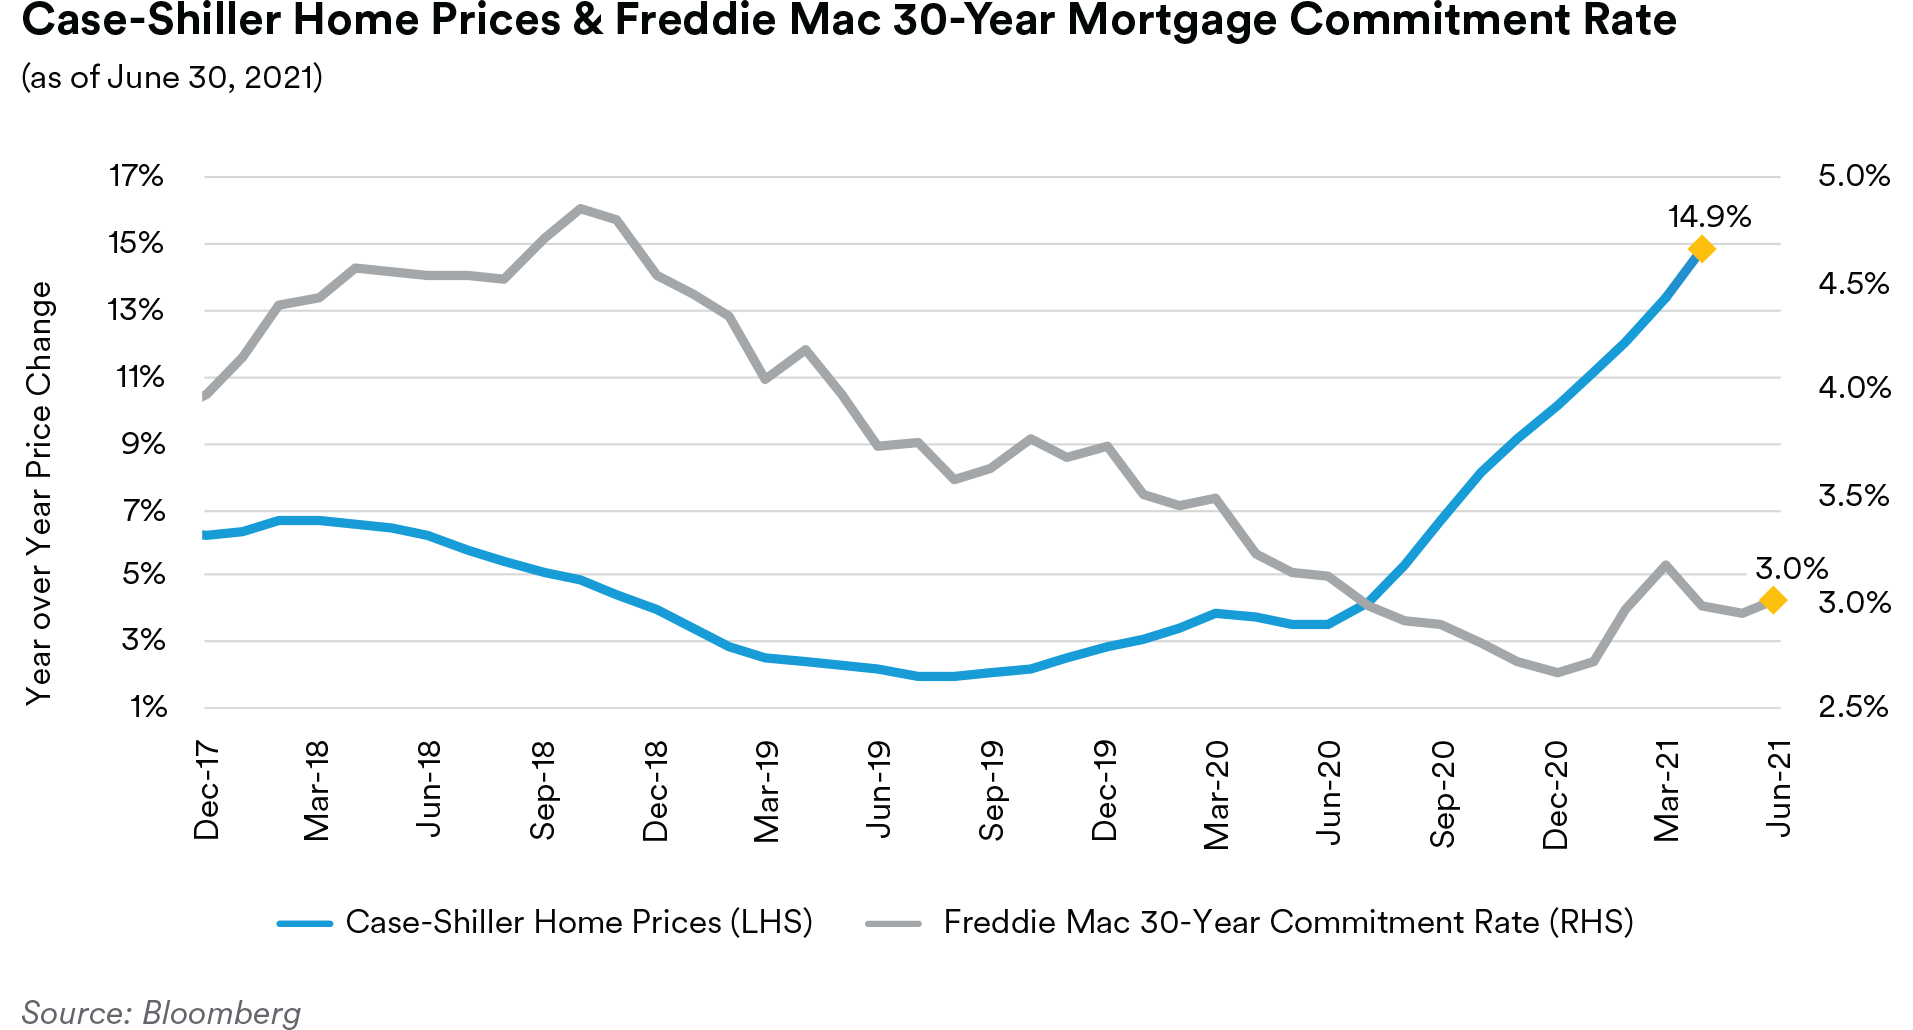
With the yield curve flattening over the second quarter, 5-year and 10-year Treasury yields retraced some of the first quarter’s weakness and mortgage rates followed suit. The Freddie Mac 30- year mortgage commitment rate ended June at 2.98%, 20 basis points lower than at the start of the quarter but still 31 basis points higher than the level seen at the beginning of the year. June’s prepayment report showed speeds on Fannie Mae 30-year mortgages falling 16% to 23.4 CPR in May, compared to 28.0 CPR in April as the lagged impact of rising interest rates in the first quarter impacted refinancing activity. The greatest decline was seen in 2.5s (down 18% to 15.7 CPR) and 3.0s (down 17% to 31.3 CPR). Fannie 15-year speeds were also slower, falling 12% in the aggregate to 17.9 CPR. With rates at their current levels, we continue to expect relatively high prepayments for the next few months. Low mortgage rates, limited inventories and rising materials costs continue to support home prices. The latest release of the S&P CoreLogic Case-Shiller 20-City Home Price Index showed home prices rising at a 14.9% annualized pace through April, ahead of economists’ projections and the fastest pace seen since 2005. On a national level, Case-Shiller’s data showed prices rose 14.6% year-over-year, the largest increase in over 30 years. With prices at their current levels, we expect affordability will become an increasing headwind and, in our view, the pace of price increases is likely to moderate going forward.
Continuing the trend seen in the first quarter, the second quarter saw home sales numbers falling in the face of higher prices and low inventories. June’s release showed existing home sales dropping for the fourth straight month in May, coming in at a 5.8 million annualized pace. Inventories stood at 1.2 million units, which would take only 2.5 months to clear at the current sales pace. Realtors consider anything below five months of supply as indicative of a tight market. New home sales also dropped, falling 5.9% in May’s release to a 769,000 annualized pace, surprising analysts who had predicted a slight 0.2% monthly increase to an 865,000 rate. In our view, with home prices at their current levels and inventory scarce, housing sales are likely to remain challenged despite the affordability boost provided by relatively low mortgage rates.
On the regulatory front, a Supreme Court decision in late June set the stage for President Biden to replace Mark Calabria as director of the Federal Housing Finance Agency. The replacement of Calabria with Sandra Thompson (serving as acting director until a new director is confirmed by the Senate) likely signals a shift in policy away from removing Fannie Mae and Freddie Mac from conservatorship and more towards affordable housing and minority homeownership initiatives. In our view, with the removal of Calabria, meaningful GSE reform is now off the table.
Portfolio Actions & Outlook: Over the course of the quarter we reduced our exposure to RMBS across all strategies with the most significant decreases in our three and five-year strategies. The reductions were accomplished both by the outright sale of various portfolio holdings and proceeds from mortgage prepayments that were not reinvested into the RMBS sector. Our sales activity was generally focused upon the agency subsector with a particular emphasis on reducing our CMO holdings as we sought to both decrease overall RMBS exposure while increasing RMBS liquidity as a greater percentage of the remaining holdings are now in relatively more liquid specified pools. However, much like in the first quarter, we opportunistically added to our non-agency positions when we saw attractive short-tenor tranches offered in the market.
We anticipate relatively high prepayments for the foreseeable future and heightened volatility around RMBS as the market absorbs the continuous flow of information related to the future tapering of the Fed’s MBS buying program. Accordingly, going forward we prefer to remain defensive and do not anticipate increasing our exposure to the RMBS sector. However, we are unlikely to continue to lower our exposure at the pace seen this quarter. Instead, we anticipate generally allowing prepayments to slowly reduce our RMBS holdings. Against this overall prepayment-driven RMBS reduction, we foresee the possible offset of continued opportunistic purchases of short-tenor, high-quality non-agency tranches.
Performance: In the aggregate, our RMBS holdings generated negative performance across our strategies in the second quarter. Only our non-agency holdings were able to post positive returns as their attractive coupon income was able to outweigh the negative convexity impact of higher prepayments. Within agencies, our specified pools and CMO holdings were generally flat or negative so that overall returns for each of these subsectors was negative. In general, we attribute the underperformance of our RMBS positions this quarter to heightened prepayments.
Municipals
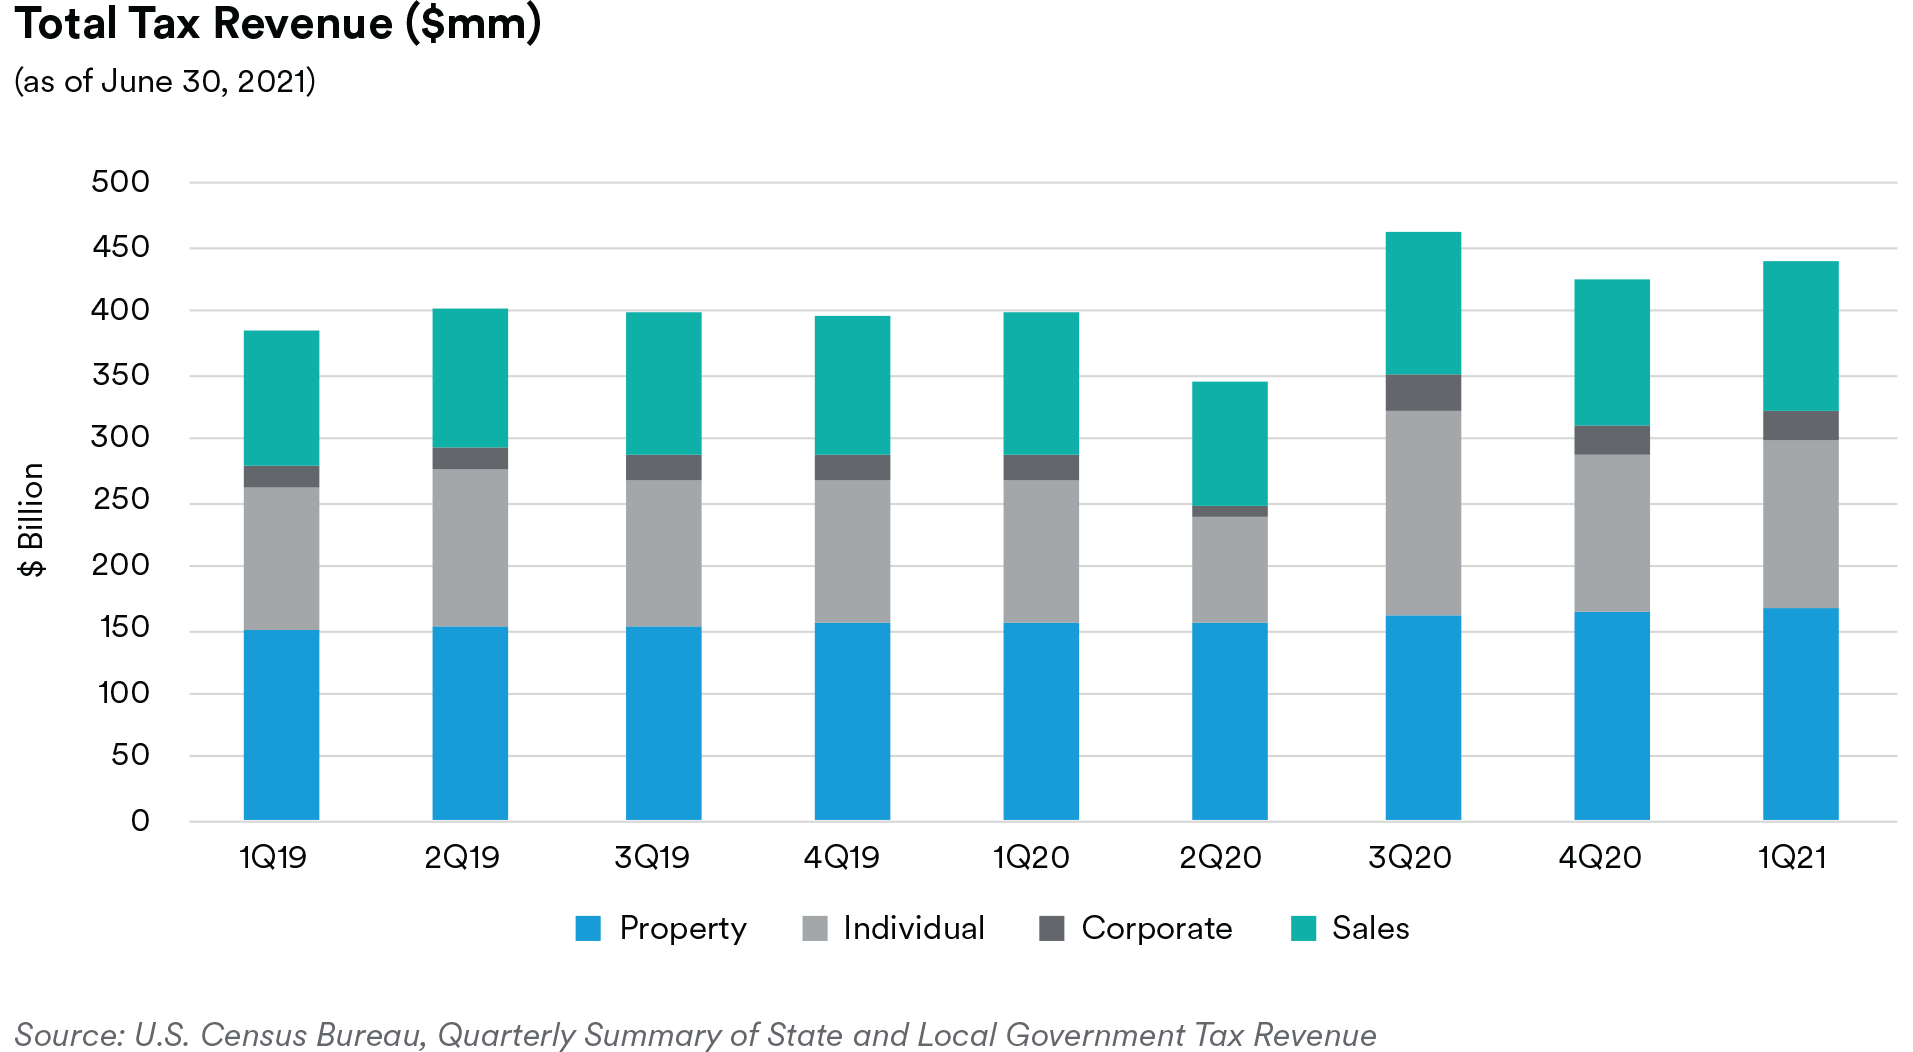
Recap: Total second-quarter municipal issuance of $116 billion was $5.5 billion larger than last year’s second quarter although taxable issuance of $26 billion was nearly $6 billion lower than 2020’s second quarter. The decline in taxable issuance can be attributed to lower overall savings on taxable advance refundings of tax-exempt debt along with the abundant stimulus package aid received which created budgetary surpluses for many states. Taxable municipals had positive absolute returns over the second quarter and demand remained strong with $28 billion in overall municipal mutual fund inflows.
In terms of noteworthy developments over the quarter, a bipartisan group of senators reached a deal with the White House for a total of $1.2 trillion in spending over eight years to fund infrastructure improvements. If passed as outlined, the plan includes an incremental $579 billion more in additional spending of which $313 billion is earmarked for roads, bridges, mass transit, seaports, and airports, a positive for the municipal market. While the plan’s passage remains uncertain as it seems contingent upon the carrying out of the Democrats’ larger social agenda, if passed, we believe taxable issuance should increase as private activity and direct-pay bonds are included as a source of financing, similar to the 2009 Build America Bonds program.
We believe fundamentals remain strong as state tax revenues have significantly outpaced expectations from the depths of the COVID recession. Tax revenues have clearly benefited from the employment recovery, the easing of COVID-related restrictions and the improvement in consumer balance sheets. In fact, the Urban Institute reported that halfway through FY2021, 22 states have reported revenue rates at or exceeding their respective FY2019 levels. Additionally, the recent $350 billion passed in state and local stimulus, representing a large portion of state budgets, has clearly helped ease short-term budgetary pressures by increasing state “rainy day” funds. Finally, strong equity capital market returns have helped bolster state pension funding levels. Interestingly, Moody’s felt comfortable upgrading either ratings and/or outlooks for both New Jersey and Illinois over the quarter, even as a handful of states’ legacy liability profiles remain stressed.
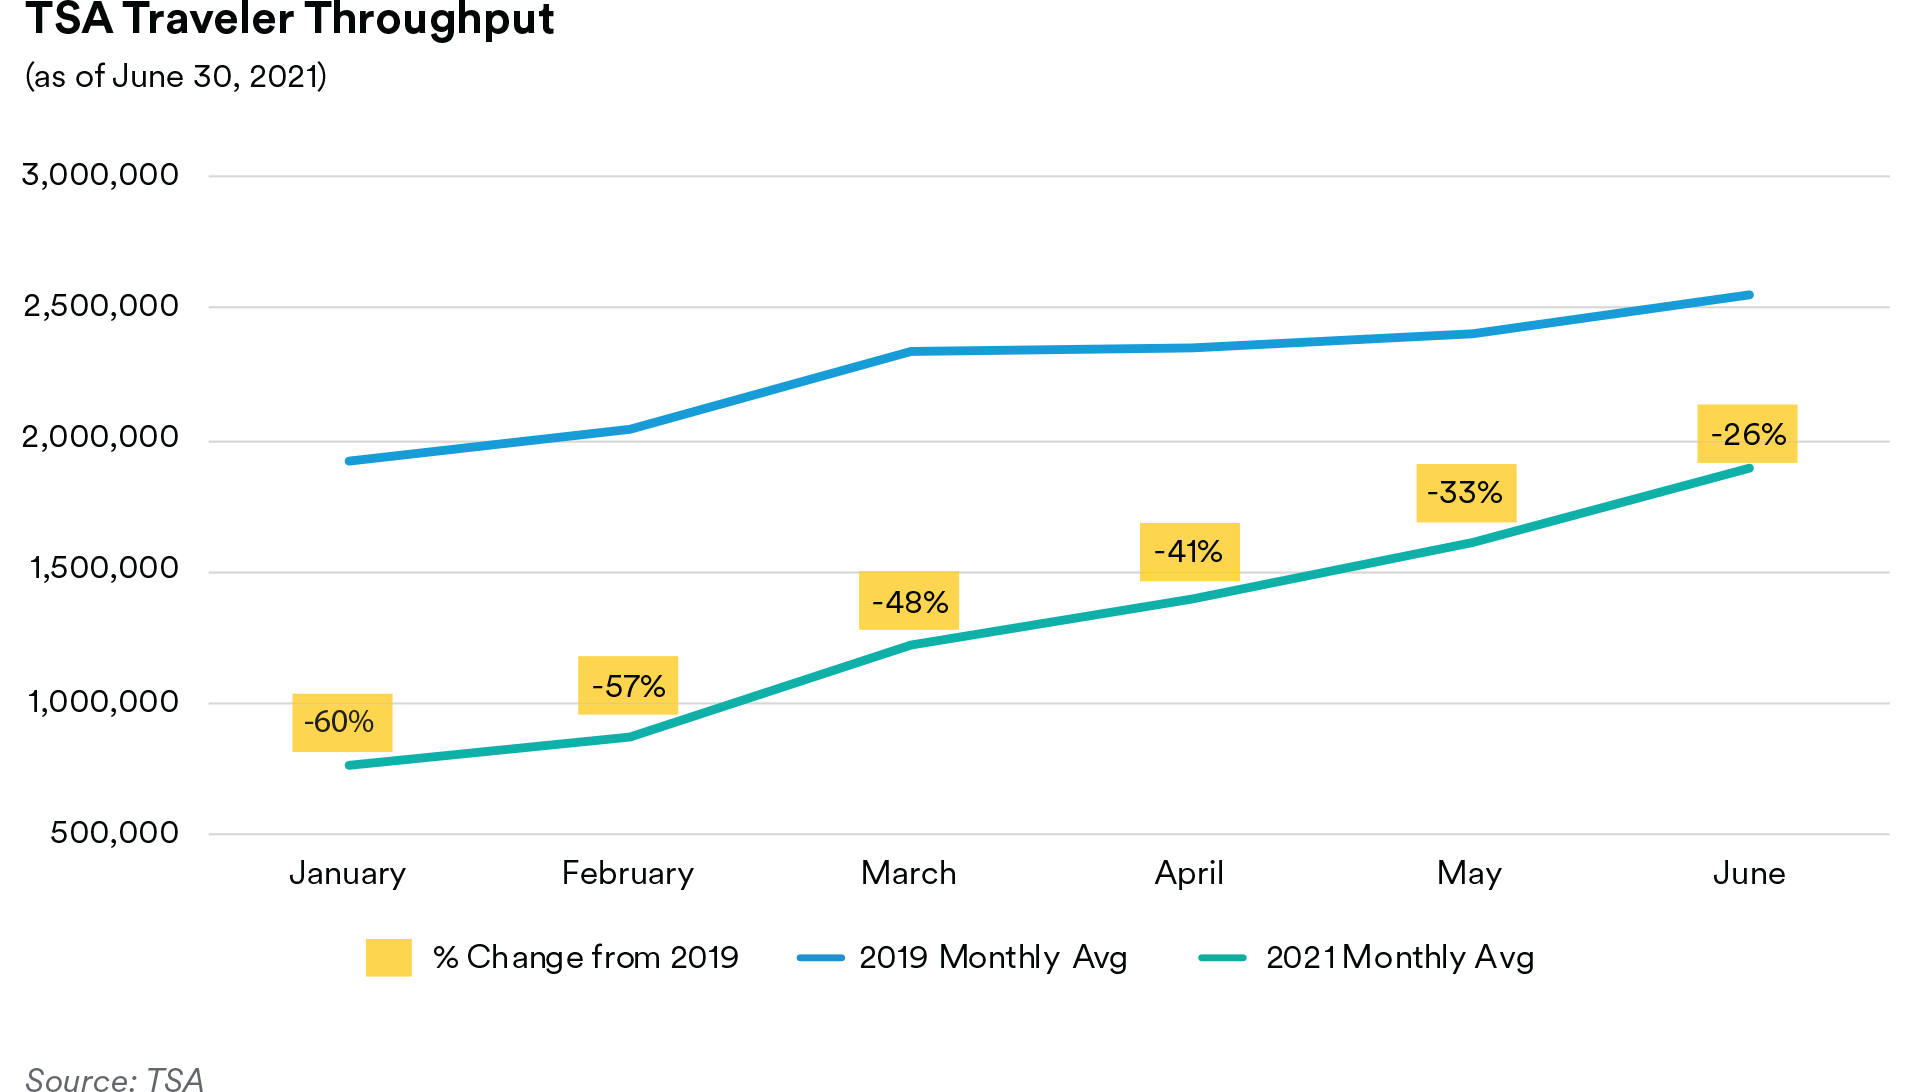
Another significant development over the quarter was the recovery in air traffic and passenger volume as the reopening continued. TSA throughput traffic increased on average to 67% of 2019 levels during the second quarter compared to only 45% sequentially on average during the first quarter. Vaccine rollout, as approximately 60% of U.S. citizens above the age of 18 have been fully vaccinated, has bolstered spring travel and unleashed the pent-up demand from COVID lockdowns experienced in 2020. As a result, on May 4, stemming from the increase in passenger demand, Moody’s revised their outlook on the airport sector to positive from stable shortly after revising their outlook to stable from negative back in March.
Given the accelerated pace of inoculations, almost all colleges and universities expect to fully resume some type of face-to-face instruction in the Fall of 2021, welcoming students back on campus. Schools are projecting strong rebounds in both tuition and room and board revenues. Even as most educational institutions are requiring students to be fully vaccinated as a condition of enrollment, Fall 2021 applications for many institutions were up sharply with lower admission rates and higher matriculation rates.
Finally, in healthcare, as COVID cases began dropping sharply in March, revenue and operating cash flow margins recovered and that recovery continued into the second quarter. Technological advances such as tele-medicine helped cushion revenue declines earlier in the year while the resurgence of elective surgeries over the quarter helped bolster hospital fundamentals. Worthy of mention, the federal support provided by the government directly to hospitals via grants continued to benefit hospitals over the quarter as financial operating metrics continued to improve.
Portfolio Actions & Outlook: We were active in the second quarter in both the primary and secondary markets, adding to the transportation sector with investments in the airport, seaport, and toll road sectors. We also incrementally added to higher quality tax-backed bonds out of the maturity spectrum as well as healthcare issuers. As the economy recovers, pent-up demand from corporations and households is expected to drive tax revenue growth throughout the United States. Credit fundamentals for the transportation sectors have improved and this is expected to continue with the loosening of travel restrictions. Bank of America survey data suggests business and international travel is likely to pick up in 2022, although business travel may never completely reach pre-pandemic levels. Given the liquidity profile of airport balance sheets, we remain comfortable increasing exposure to this subsector selectively. Healthcare balance sheets and liquidity were also strengthened by federal aid. The rate of vaccinations should quicken the pace to overall herd immunity in the U.S., enabling healthcare providers to resume their routine while continuing to provide effective COVID-19 care. As many state-level budget deficits have turned into surpluses and strong personal income collections persist, it should be positive for governments at the local level. Those local municipalities, supported primarily by property taxes, may fare better given home values continue to climb higher. While the fundamentals of General Obligation bonds (GOs) have clearly improved, we remain cautious when evaluating this subsector.
Lower overall taxable issuance coupled with above-average investor demand has resulted in material spread compression within the taxable municipal market. In this context, we sold tax-backed bonds in the one to two-year part of the maturity spectrum at spreads of 11-14 basis points over comparable duration Treasury securities. Proceeds of these sales were either reinvested in similar-quality credits further out the yield curve to capture roll down return or in other spread sectors with better relative value.
Performance: Performance of our municipal holdings over the second quarter was mostly positive across our strategies. On an excess return basis, some of our better performing sectors included Transportation, State and Local GOs and Higher Education. Essential Service sector excess returns were mixed but neutral in aggregate.
Endnotes
1 Bureau of Economic Analysis
2 Center for Disease Control
Disclaimers
This document is being provided to you at your specific request. This document has been prepared by MetLife Investment Management., a U.S. Securities Exchange Commission-registered investment adviser.1 Registration with the SEC does not Imply a certain level of expertise or that the SEC has endorsed the Investment advisor.
This document is being distributed by MetLife Investment Management Limited (“MIML”), authorised and regulated by the UK Financial Conduct Authority (FCA reference number 623761), registered address Level 34 One Canada Square London E14 5AA United Kingdom. This document is only intended for, and may only be distributed to, investors in the EEA who qualify as a Professional Client as defined under the EEA’s Markets in Financial Instruments Directive, as implemented in the relevant EEA jurisdiction. The investment strategy described herein is intended to be structured as an investment management agreement between MIML (or its affiliates, as the case may be) and a client, although alternative structures more suitable for a particular client can be discussed.
For investors in Japan, this document is being distributed by MetLife Asset Management Corp. (Japan) (“MAM”), a registered Financial Instruments Business Operator (“FIBO”) conducting Investment Advisory Business, Investment Management Business and Type II Financial Instruments Business under the registration entry “Director General of the Kanto Local Finance Bureau (Financial Instruments Business Operator) No. 2414” pursuant to the Financial Instruments and Exchange Act of Japan (“FIEA”), and a regular member of the Japan Investment Advisers Association and the Type II Financial Instruments Firms Association of Japan. In its capacity as a discretionary investment manager registered under the FIEA, MAM provides investment management services and also sub-delegates a part of its investment management authority to other foreign investment management entities within MIM in accordance with the FIEA. This document is only being provided to investors in Japan who are Qualified Institutional Investors (tekikaku kikan toshika) as defined in Article 10 of Cabinet Office Ordinance on Definitions Provided in Article 2 of the FIEA. It is the responsibility of each prospective investor to satisfy themselves as to full compliance with the applicable laws and regulations of any relevant territory, including obtaining any requisite governmental or other consent and observing any other formality presented in such territory.
MetLife, Inc. provides investment management services to affiliates and unaffiliated/third party clients through various subsidiaries.1 MetLife Investment Management (“MIM”), MetLife, Inc.’s institutional investment management business, has more than 900 investment professionals located around the globe. MIM is responsible for investments in a range of asset sectors, public and privately sourced, including corporate and infrastructure private placement debt, real estate equity, commercial mortgage loans, customized index strategies, structured finance, emerging market debt, and high yield debt. The information contained herein is intended to provide you with an understanding of the depth and breadth of MIM’s investment management services and investment management experience. This document has been provided to you solely for informational purposes and does not constitute a recommendation regarding any investments or the provision of any investment advice, or constitute or form part of any advertisement of, offer for sale or subscription of, solicitation or invitation of any offer or recommendation to purchase or subscribe for any securities or investment advisory services. Unless otherwise specified, the information and opinions presented or contained in this document are provided as of the quarter end noted herein. It should be understood that subsequent developments may affect the information contained in this document materially, and MIM shall not have any obligation to update, revise or affirm. It is not MIM’s intention to provide, and you may not rely on this document as providing, a complete or comprehensive analysis of MIM’s investment portfolio, investment strategies or investment recommendations.
No money, securities or other consideration is being solicited. No invitation is made by this document or the information contained herein to enter into, or offer to enter into, any agreement to purchase, acquire, dispose of, subscribe for or underwrite any securities or structured products, and no offer is made of any shares in or debentures of a company for purchase or subscription. Prospective clients are encouraged to seek advice from their legal, tax and financial advisors prior to making any investment.
Confidentiality. By accepting receipt or reading any portion of this Presentation, you agree that you will treat the Presentation confidentially. This reminder should not be read to limit, in any way, the terms of any confidentiality agreement you or your organization may have in place with Logan Circle. This document and the information contained herein is strictly confidential (and by receiving such information you agree to keep such information confidential) and are being furnished to you solely for your information and may not be used or relied upon by any other party, or for any other purpose, and may not, directly or indirectly, be forwarded, published, reproduced, disseminated or quoted to any other person for any purpose without the prior written consent of MIM. Any forwarding, publication, distribution or reproduction of this document in whole or in part is unauthorized. Any failure to comply with this restriction may constitute a violation of applicable securities laws.
Past performance is not indicative of future results. No representation is being made that any investment will or is likely to achieve profits or losses or that significant losses will be avoided. There can be no assurance that investments similar to those described in this document will be available in the future and no representation is made that future investments managed by MIM will have similar returns to those presented herein.
No offer to purchase or sell securities. This Presentation does not constitute an offer to sell or a solicitation of an offer to buy any security and may not be relied upon in connection with the purchase or sale of any security.
No reliance, no update and use of information. You may not rely on this Presentation as the basis upon which to make an investment decision. To the extent that you rely on this Presentation in connection with any investment decision, you do so at your own risk. This Presentation is being provided in summary fashion and does not purport to be complete. The information in the Presentation is provided to you as of the dates indicated and MIM does not intend to update the information after its distribution, even in the event that the information becomes materially inaccurate. Certain information contained in this Presentation, includes performance and characteristics of MIM’s by independent third parties, or have been prepared internally and have not been audited or verified. Use of different methods for preparing, calculating or presenting information may lead to different results for the information presented, compared to publicly quoted information, and such differences may be material.
Risk of loss. An investment in the strategy described herein is speculative and there can be no assurance that the strategy’s investment objectives will be achieved. Investors must be prepared to bear the risk of a total loss of their investment. Your capital is at risk. Investing in the strategies discussed herein are subject to various risks which must be considered prior to investing. These risks may include, but are not limited to Liquidity Risk, Interest Rate Risk, Credit Risk, Prepayment Risk, and Counterparty Risk For a more complete list please contact your sales representative.
No tax, legal or accounting advice. This Presentation is not intended to provide, and should not be relied upon for, accounting, legal or tax advice or investment recommendations. Any statements of U.S. federal tax consequences contained in this Presentation were not intended to be used and cannot be used to avoid penalties under the U.S. Internal Revenue Code or to promote, market or recommend to another party any tax-related matters addressed herein.
Forward-Looking Statements. This document may contain or incorporate by reference information that includes or is based upon forward-looking statements within the meaning of the Private Securities Litigation Reform Act of 1995. Forward-looking statements give expectations or forecasts of future events. These statements can be identified by the fact that they do not relate strictly to historical or current facts. They use words and terms such as “anticipate,” “estimate,” “expect,” “project,” “intend,” “plan,” “believe,” “will,” and other words and terms of similar meaning, or are tied to future periods in connection with a discussion of future performance. Forward-looking statements are based on MIM’s assumptions and current expectations, which may be inaccurate, and on the current economic environment which may change. These statements are not guarantees of future performance. They involve a number of risks and uncertainties that are difficult to predict. Results could differ materially from those expressed or implied in the forward-looking statements. Risks, uncertainties and other factors that might cause such differences include, but are not limited to: (1) difficult conditions in the global capital markets; (2) changes in general economic conditions, including changes in interest rates or fiscal policies; (3) changes in the investment environment; (4) changed conditions in the securities or real estate markets; and (5) regulatory, tax and political changes. MIM does not undertake any obligation to publicly correct or update any forward-looking statement if it later becomes aware that such statement is not likely to be achieved.
1 Subsidiaries of MetLife, Inc. that provide investment management services include Metropolitan Life Insurance Company, MetLife Investment Management, LLC, MetLife Investment Management Limited, MetLife Investments Limited, MetLife Investments Asia Limited, MetLife Latin America Asesorias e Inversiones Limitada, MetLife Asset Management Corp. (Japan), and MIM I LLC.