Portfolio Actions & Outlook: After our bellwether front-end 1-5 year investment grade corporate index started the year at an option-adjusted spread (OAS) of 60 basis points, not far above multidecade tights, the index OAS closed the quarter at 64 basis points. We continue to view valuations as somewhat stretched with a strong economic recovery priced in and little accounting for the potential volatility or bumps in the road as fiscal support potentially recedes later in the year, well before the U.S. labor market has completed its return to pre-pandemic health and many subsectors of the economy see demand restored to something approaching normal. Consequently, until the prevailing decoupling of fundamentals and valuations subsides, likely at wider spreads ultimately, we anticipate maintaining our mostly more defensive, up-in-quality approach to investing and hold sector weightings steady as we did in the first quarter.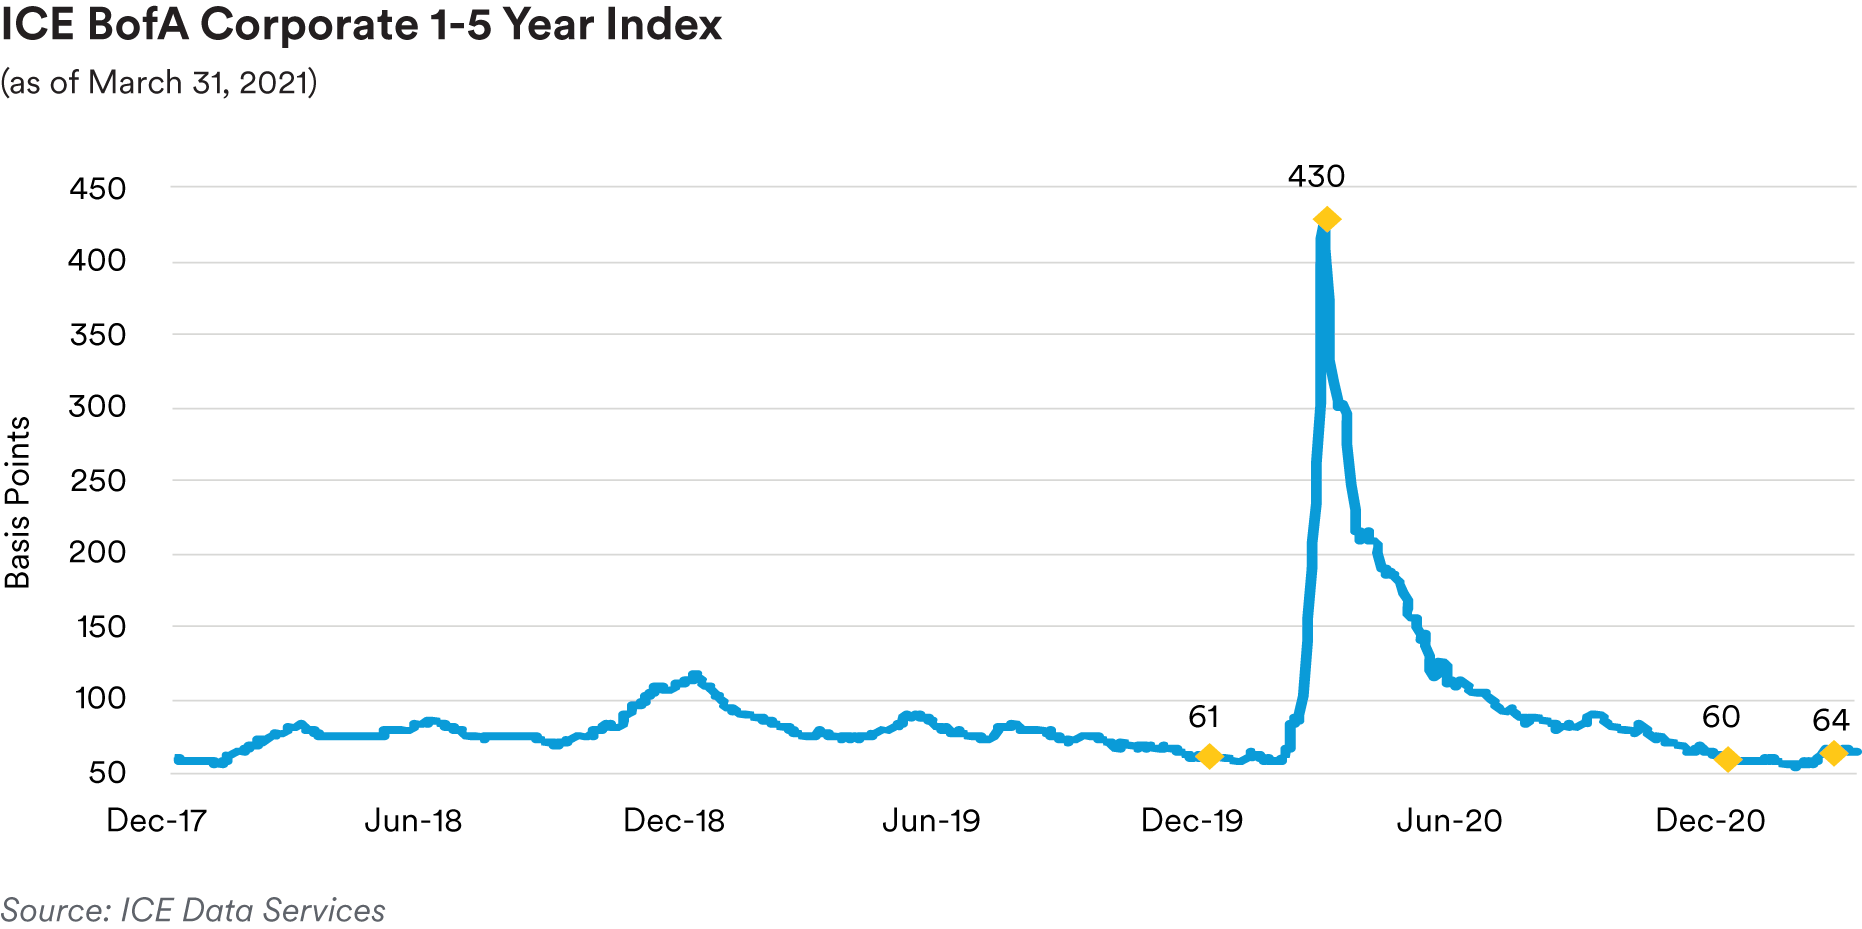
In terms of trading activity, we remained selective over the first quarter with a focus on higher-quality issuers often via the new issue calendar, chiefly in favored, more defensive subsectors such as banking, insurance, consumer non-cyclicals and electric utilities. For example, at the beginning of the year we added new issue two-year (in our shorter strategies) and five-year fixed-rate bonds (in our 1-5 year strategy portfolios) from a Canadian bank. In our shorter strategies’ portfolios, we saw value and were most active in purchasing a number of floating-rate new issues pegged off of SOFR: including two-year paper from a Canadian midstream pipeline company and three-year paper from a Swiss bank, domestic money center bank, U.S. telecommunications provider, U.S. utilities (including a first-mortgage bond) and a German automaker. Other notable new issue buys in our shorter dated portfolios included two-year fixed-rate bonds of both a Japanese telecommunications provider and U.S. utility.
In our 1-3 year strategy, we were also very active in utilizing the new issue calendar to invest in the first quarter. In January we purchased three-year fixed-rate new issues from a Japanese automaker and a U.S. oil and gas company. On the secondary side, we bought two-year and three-year fixed-rate bonds of a South Korean automaker and a U.S. midstream company’s two-year fixed-rate bonds. We also purchased two-year fixed-rate new issues from the aforementioned Japanese telecommunications provider and a German engineering company. In addition, we bought a handful of other new issues: a three-year / non-call one year fixed-rate new issue from a U.S. soda/coffee company, a three-year fixed-rate bond from a U.S. telecommunications provider, and a two-year fixed-rate bond from a utility. The three-year SOFR floating-rate new issue realm also represented a pocket of relative value for this strategy where we purchased issues from a U.S. telecommunications provider, utility (secured first-mortgage bond) and German automaker. Our purchases were often funded by selling shorter dated sector holdings which had moved to less attractive yield levels, sometimes approaching their make-whole prepayment redemption levels.
In the 1-5 year strategy, early in the quarter we bought the five-year Canadian bank new issue noted above and a five-year secured funding agreement-backed new issue from a large mutual insurance company. We also purchased in secondary two-year fixed-rate bonds of a South Korean automaker and a U.S. midstream company’s two-year fixed-rate bonds. Other notable new issue fixed-rate additions to our portfolios included a three-year / non-call one year new issue from a U.S. convenience store/gas station operator, a three-year bond from a Japanese telecommunications provider, a two-year bond from a German engineering company, a five-year bond from a U.S. telecommunications provider and a two-year bond from a utility. Like in the 1-3 year strategy, we also saw fit to add some three-year SOFR floating-rate new issues in the 1-5 year strategy portfolios: bonds from a U.S. telecommunications provider, utility (secured first-mortgage bond) and German automaker. Near the end of the first quarter after Treasury yields had risen, most notably in the five-year area, we began to add some longer dated secondary bonds, including several five-year Canadian bank issues. Our purchases were mainly funded by selling some of our lower-yielding holdings or toward the end of the quarter some of our tight trading (on a spread or yield basis) bank and industrial bonds with maturities in less attractive parts of the yield curve or maturity spectrum.
As alluded to above, in our view at current valuations, there remains a gap or disconnect between fundamentals and corporate bond spreads, not unlike that observed across various asset classes due to the unique central bank-driven liquidity environment and fiscal authority-provided support conditions in which we find ourselves as well as the lack of alternatives. While many of the extraordinary moves to supply liquidity to markets and relief to citizens were necessary to avert a deeper crisis, the willingness on the part of officials to withdraw these various means of support and restore markets to their normal function in terms of pricing risk does not appear on the near-term horizon. Accordingly, markets may remain distorted for an extended time but we are reluctant to throw caution to the wind by increasing our risk profile across strategies in assuming corporate bond spreads are on track to approach or move below the all-time tight levels not too far from where we currently sit. We are content to await a better entry point at wider spreads. While many large companies are doing well and the process of balance sheet repair and improving credit metrics is underway, the U.S. labor market is on a long road to recovery with the benefits of stimulus checks waning in the months ahead, weakening the ability of many middle-class consumers to spend and help power the rebound in economic growth to the degree many forecasters predict. There will surely be some pent up consumer demand released as reopenings take place, but we are amid an uneven recovery unlike any other and certain subsectors will likely continue to struggle, especially as the pandemic has reshaped consumer behavior.

Moving forward, we will maintain a somewhat reduced sector weighting in investment grade credit compared to our historic norm and generally concentrate on investing in more defensive, up-in-quality subsectors and issuers offering what we perceive to be “safe carry”. Our preferred subsectors include banking, consumer non-cyclicals, communications, and electric utilities.
Seeking opportunities to capture spread compression and generate excess return via the new issue calendar will remain a focus. Given the near-term favorable backdrop, we will look for attractive opportunities in BBB’s in the front end of the maturity spectrum where fundamentals and balance sheet liquidity are sound, and spreads offer sufficient compensation. Given the reshaping of the yield curve and pickup in interest rate volatility with short-term interest rates remaining anchored, we continue to see value in floating-rate securities. As well, with the backup in interest rates and curve reshaping, to the extent we see further steepening, we may continue to look for opportunities to barbell portfolios or extend duration with longer dated investment grade credit securities, specifically in the 1-3 and 1-5 year strategy portfolios.
Performance: The investment grade credit sector was a positive contributor to relative performance across all our strategies in the first quarter. Excess return contributions were driven by broad-based spread tightening in the sector with stand-out performances from our overweights in Banking and Health Care (including hospital issues traded in the Municipals market but categorized as investment grade corporates) and generally as well as positioning in the Wirelines, Electric Utility, Diversified Manufacturing, Midstream, and Automotive subsectors.
Treasuries / Agencies
Recap: The first quarter was marked by a significant increase in Treasury yields as economic optimism linked to vaccine rollouts in the U.S. and another round of fiscal stimulus pushed 10-year yields as high as 1.77%. While the realized data did not reveal a surge in economic activity or inflation, expectations for a strong rebound pushed both inflation breakeven rates and real yields meaningfully higher. Although Treasury rates moved significantly higher, the Federal Reserve remained quite dovish. The most salient takeaway from the March FOMC meeting was the lack of change to the Fed “dots”, which continued to show a median projection of Fed Funds at the lower effective bound through the end of 2023. Committee members across the dove / hawk spectrum signaled comfort with the increase in yields given that the repricing was based on an improving economy and showed no indication of preparing to offset the selloff in Treasuries. In the very front end of the yield curve, a massive supply of cash in the market led to significant downward pressure on short dated interest rates during the quarter. This was not only a function of the Fed’s quantitative easing purchases, but also due to paydowns of Treasury Bills and a declining Treasury General Account. With some repo rates trading negative, the end of the quarter saw a meaningful increase in the usage of the Fed’s Reverse Repurchase facility.
Looking at longer rates, the first quarter was very bearish with 10-year Treasury yields moving sharply higher throughout the quarter. The trading range was once again redefined as the 10-year Treasury ended the quarter at a 1.74% yield after beginning the year at 0.91%. In terms of the Treasury Inflation-Protected Securities (TIPS) market, surging inflation expectations was the defining characteristic of the U.S. rates market early in the quarter. Real yields also moved significantly higher during the quarter, although they remained deeply negative as the Fed continued to commit to keeping monetary policy accommodative for the next several years. The 10-year breakeven inflation rate was 38 basis points higher and closed the quarter at 2.37%, well above the Federal Reserve’s 2% target and as high as it’s been since mid-2013. The 10-year real yield closed the quarter 46 basis points higher at -0.63%. However, this move did not trigger any undue tightening in financial conditions. Nominal Treasury notes finished the quarter with the two-year Treasury yield at 0.16%, the five-year Treasury at 0.94% and the ten-year Treasury at 1.74% as mentioned previously. The five-year less two-year Treasury interest rate differential ended the quarter at a spread of 78 basis points, 54 basis points higher than the end of 2020. The longer dated ten-year less two-year differential moved 79 basis points higher to 158 basis points.
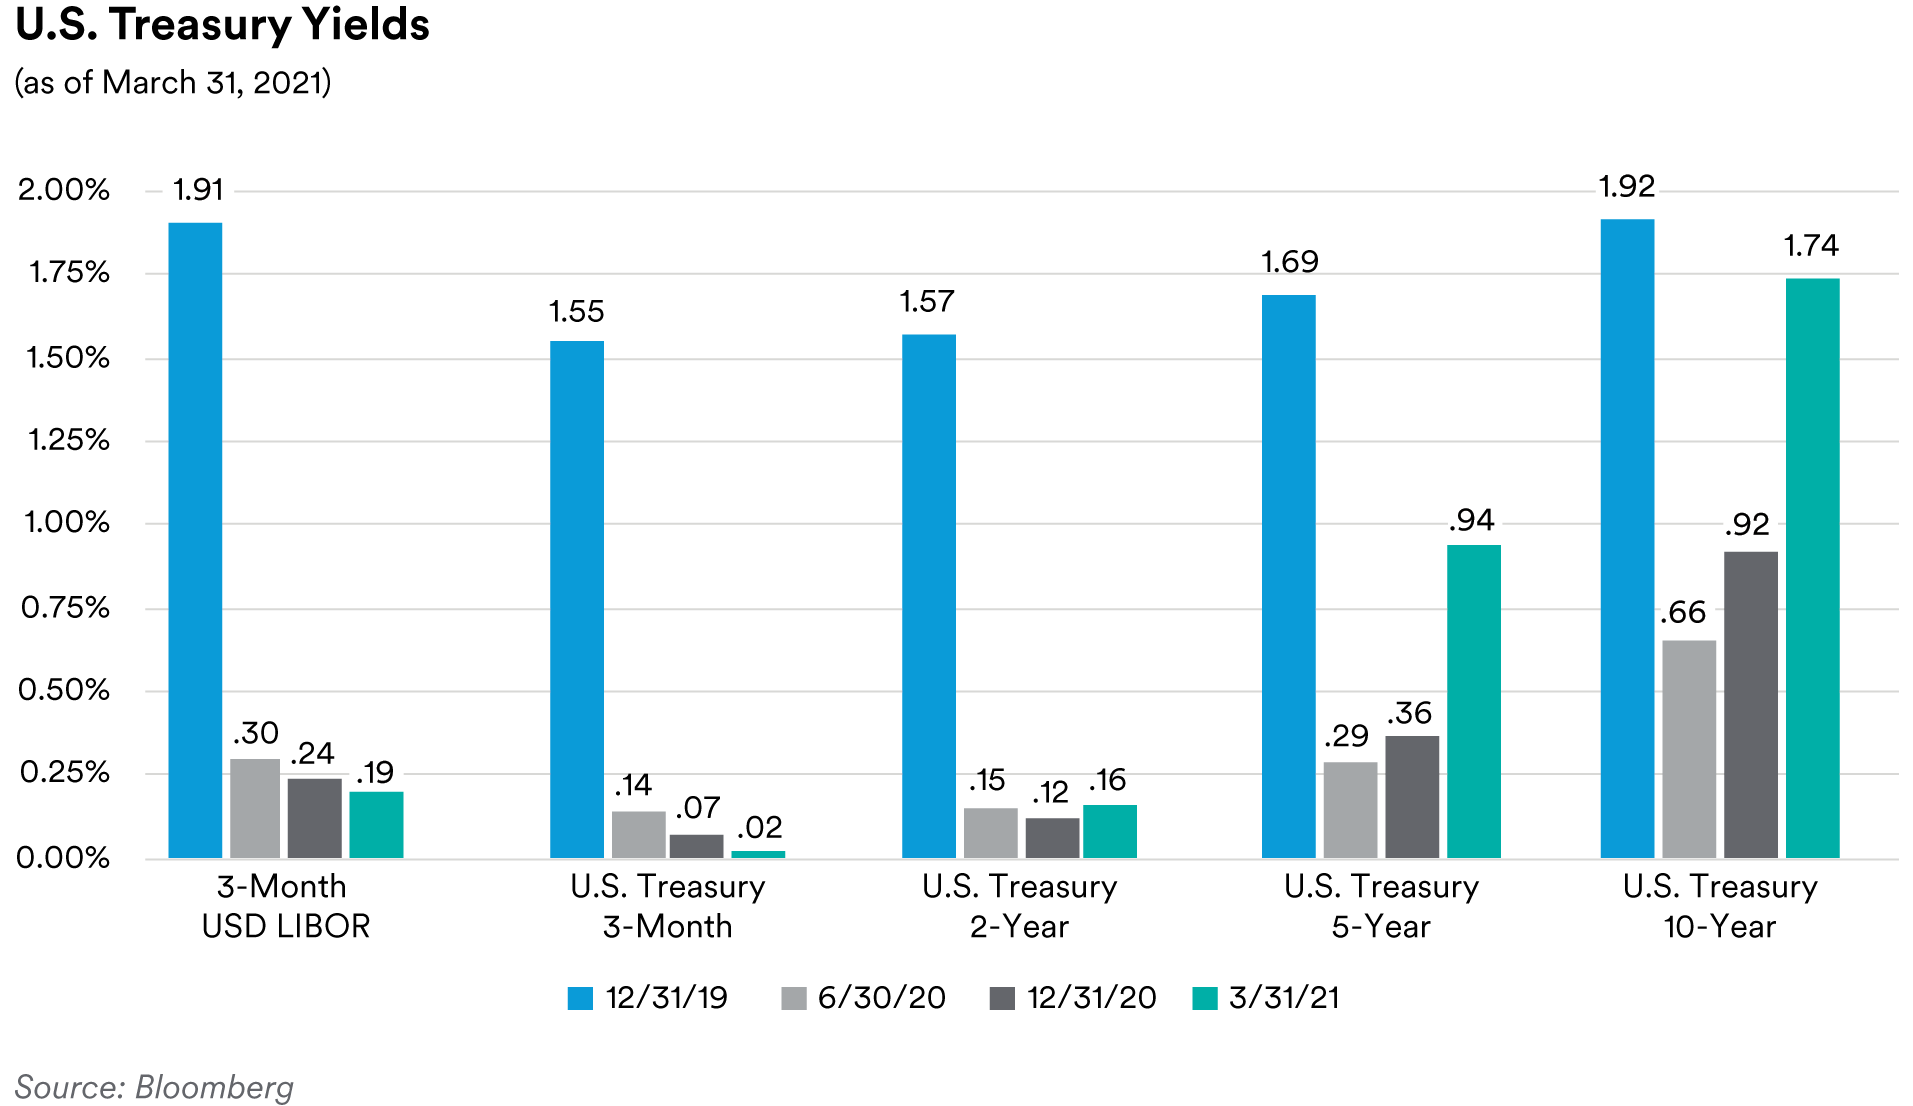
In the very front end, the yield on the three-month Treasury bill decreased by four basis points to 0.02% while 3-month Libor also decreased by five basis points to end the quarter at 0.19%. In the Agency sector, a key concern over the quarter was if the move higher in Treasury yields could put pressure on rate spread products such as U.S. agencies and Supranational, Sovereign and Agencies (SSAs). However, we saw spreads continue to grind tighter over the quarter. Front-end Government-Sponsored Enterprise (GSE) debt spreads moved lower as the option-adjusted spread (OAS) of the ICE BofA 1-5 Year U.S. Bullet (fixed maturity) Agency Index ended the first quarter at two basis points, two basis points tighter over the quarter. U.S. dollar-denominated SSA fixed-maturity securities’ spreads were also two basis points tighter and finished the quarter at a spread of 23 basis points over comparable-maturity Treasuries.
Portfolio Actions & Outlook: Over the quarter we reduced our allocation to nominal U.S. Treasuries in the front end as a means to fund the increase in spread sectors in the portfolios. We closed out our remaining TIPS positions that had rolled down into the three-year area in the quarter as inflation breakevens continued to move higher. In addition, we decreased our allocation to the agency sector as spreads tightened further to hover near multi-year tights.
As mentioned, we expect a dovish Fed will continue to keep front-end rates pinned for the foreseeable future. At times the market may try to pull forward the path of rate hikes causing Treasury yields to move higher, but these higher yields may be viewed as an opportunity to add duration as it may still be too early for sustained higher rates in the front end of the maturity spectrum. We feel the yield curve should continue to remain directional with rates flattening or compressing if yields decline and steepening if yields move higher. Regarding the TIPS market, the Fed’s willingness to embrace higher inflation should continue to help support an inflation risk premium but with breakeven rates at multi-year highs across the curve, much of that may already be priced into the market and TIPS may perform more in line with nominal Treasuries.
Looking forward, we expect GSE supply to decrease as Fannie Mae and Freddie Mac remain constrained by their $300 billion issuance caps, have completed terming out debt per their liquidity rules and forbearance has been less severe than originally projected. Federal Home Loan Bank (FHLB) issuance will remain low due to a decline in advances. The demand for FHLB advances remains extremely low as the Fed has inundated the financial system with reserves. We look for the following issuance trends to persist: front-end debt to remain low with the backdrop for demand in discount notes to be less favorable, steady increase in callable issuance as investors continue to search for additional yield coupled with an increase in implied volatility coming off its historically low levels. Therefore, we anticipate positive net callable issuance and expect to largely see the impact of the supply decline concentrated in fixed-maturity, bullet issues. With the rise of implied volatility, we will look for further widening of agency callable spreads vs. duration-matched bullets for attractive opportunities.
Turning to the SSA space, we expect USD funding to become more appealing for major European issuers on a EUR/USD cross-currency basis with issuers enjoying the funding benefit of issuing in USD and swapping into EUR. Supply should continue to pick up in April as Japanese issuers and Canadian provinces start their new fiscal year on April 1. GSE and SSA spreads should continue their tightening trend despite more supply as the reach for yield continues.
Performance: Performance from our yield curve posture was negative as the curve steepened over the quarter while our slight short in duration vs. the respective benchmarks helped offset the performance drag from our curve positioning. Closing out our remaining TIPS positions that rolled down into the three-year area and holding our longer positions maturing in 2029 in our intermediate accounts generated positive excess return as breakeven yields continued to move higher. The Agency sector also performed well, contributing favorably to excess returns as spreads tightened across the various subsectors.
ABS
Recap: Spreads on short-tenor ABS tranches moved wider over the course of the first quarter in the face of healthy supply and rising interest rates. Over the quarter, spreads on two-year, fixed-rate AAA-rated credit card, prime auto, and subprime auto tranches moved 8, 11 and 3 basis points wider to end the quarter at 18, 26 and 33 basis points over Treasuries, respectively. Bucking the trend were three-year, floating-rate FFELP student loan tranches which tightened 15 basis points over the quarter to end at a spread of 45 basis points over LIBOR. In our view, the tightening in FFELP tranches likely reflects investor desire for the protection of floating-rate paper in anticipation of rising interest rates. Despite the ongoing impact of the pandemic, ABS issuance was heavy with almost $60 billion of new deals coming to market. In comparison, with the emergence of the pandemic in the first quarter of 2020, only $47 billion priced and in the first quarter of 2019, $58 billion of deals priced. As usual, the auto subsector was the largest contributor with $34 billion of deals coming to market in the first quarter. This was followed by $10 billion of issuance in the “other ABS” subsector (which includes collateral like cell phone payment plans, timeshares, mortgage servicer advances, insurance premiums, aircraft leases, etc.) and $7 billion of new equipment ABS issuance.
Bolstered by seasoned, prime underlying account receivables, credit card trust performance continues to show little impact from the pandemic. Data from the March remittance reporting cycle as measured by the JP Morgan credit card performance indices showed charge-offs and delinquencies on credit card ABS master trusts continue to trend at or below pre-pandemic levels while payment rates and excess spread remain elevated, supporting ABS tranche performance. We continue to monitor ABS credit card master trust data and anticipate some deterioration in credit metrics as a result of the pandemic. However, as we have noted in prior commentaries, we do not anticipate any material impact on AAA-rated credit card tranches due to their significant levels of credit enhancement.
New vehicle sales numbers rebounded at the end of the quarter, printing at a 17.8 million SAAR (seasonally-adjusted annualized rate) pace in March, the highest since 2017 and well ahead of economists’ consensus projection of a 16.4 million SAAR pace. With widening vaccine access improving consumer sentiment, we expect healthy auto sales numbers in the near term as consumers receive tax refunds and government stimulus checks. However, auto production slowdowns resulting from microchip shortages could produce some headwinds. Used vehicle prices also enjoyed a solid quarter, with the Manheim Used Vehicle Index climbing to new highs. The index increased 5.8% in March to end the quarter at a record high of 179.2, a 26.2% year-over-year increase. Manheim noted that all major market segments saw prices rise on a year-over-year basis in March, with pickup trucks outperforming the overall market.
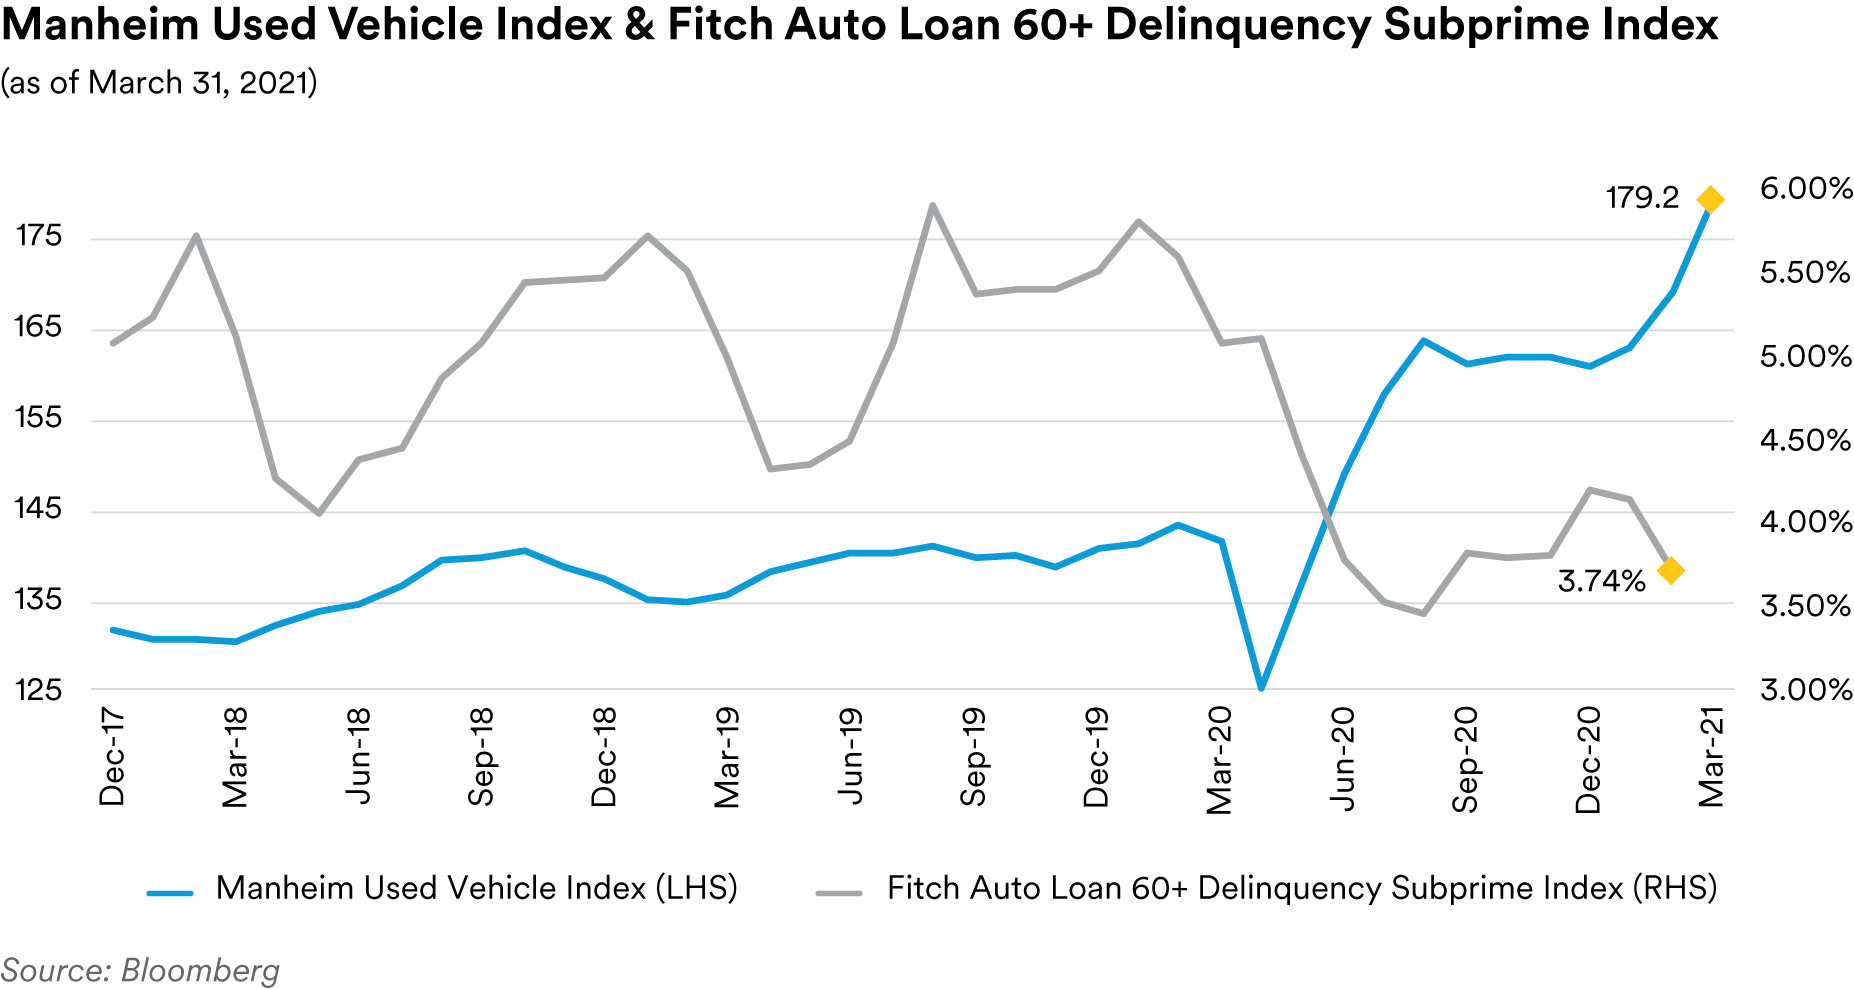
The healthy auto market, government stimulus payments and loan forbearance programs continue to provide support to ABS auto trust performance metrics. Through February, the 60+-day delinquency rates on the Fitch Auto ABS indices were 0.23% for the prime index and 3.74% for the subprime index, which reflect decreases from year-ago levels of 7 basis points and 188 basis points, respectively. Likewise, annualized net loss rates for the indices stand at 0.36% for the prime index and 5.48% for the subprime index, 19 basis points and 394 basis points lower year-over-year, respectively. As we have noted previously, we believe auto trust performance will begin to deteriorate once stimulus payments are exhausted and forbearance programs are wound down. However, with the administration continuing to use government stimulus payments to battle the pandemic and support the economy, we do not expect this in the near term and, regardless, we believe that the short-tenor tranches held in our portfolios have ample credit enhancement to offset deteriorating collateral credit performance.
Portfolio Actions & Outlook: Over the course of the first quarter we generally maintained our ABS exposure in our shorter strategies while increasing our exposure in our longer strategies. Moreover, across all strategies we increased our exposure to floating-rate CLOs while reducing exposure to fixed-rate prime auto and credit card tranches. In addition, continuing our strategy from the last quarter, in our longer duration portfolios we added to our exposure in fixed-rate private student loan tranches. As before, we are limiting our purchases to the short-tenor tranches of deals collateralized by prime credit quality borrowers from benchmark sponsors. In subprime autos, we modestly increased exposure in our shorter strategies while reducing exposure in our longer strategies. In our view, subprime auto spreads are not particularly attractive outside of the very short, front pay tranches that fit our shorter strategies best. Also, of note, we generally avoided adding to our AA-rated subordinate subprime auto holdings. In notable new issue trades, we participated in the inaugural prime auto deal from a credit union sponsor and the AAA-rated tranche of a CLO collateralized by a portfolio of infrastructure loans.
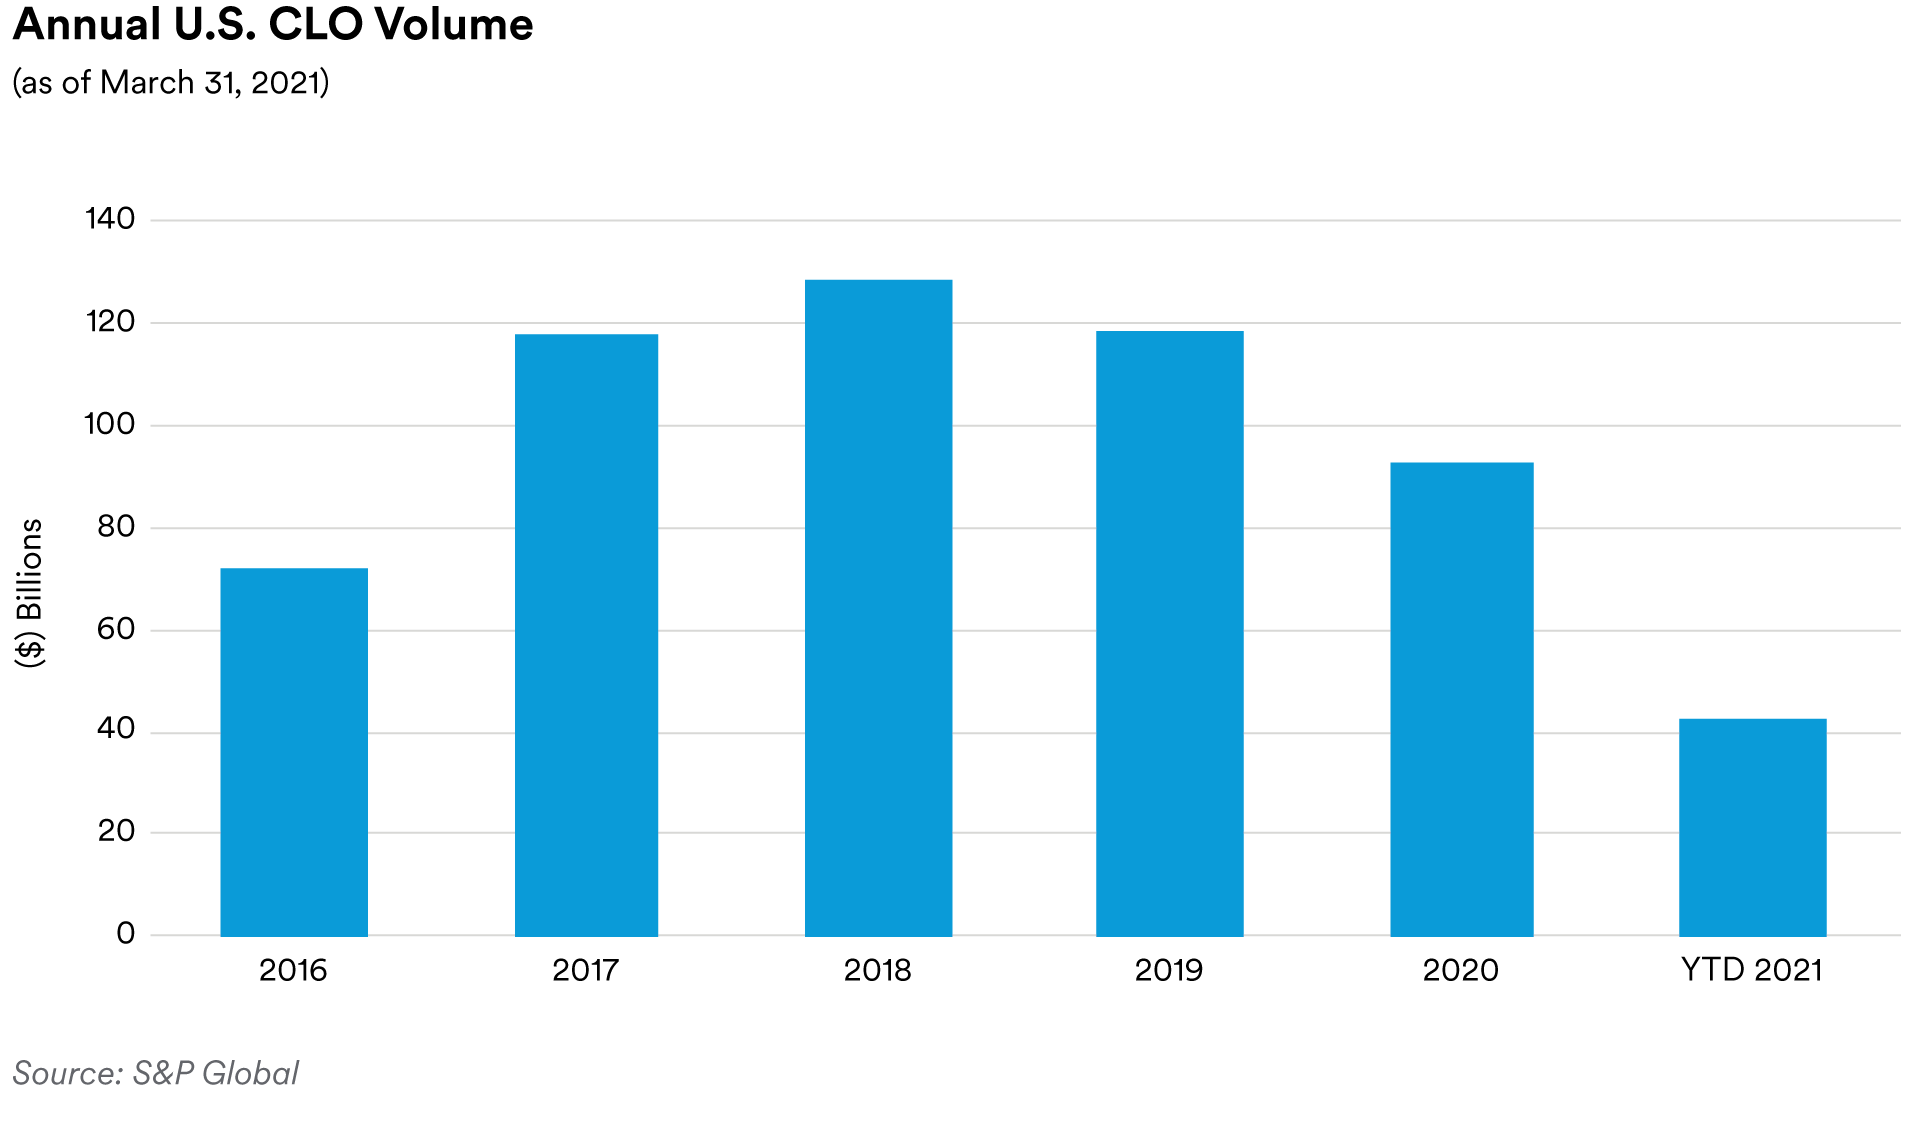
In our view, the current tight spreads in prime autos and credit cards continue to provide opportunities to rotate into higher-yielding alternatives whether in CLOs, private student loans or other spread sectors away from ABS. Going forward we expect to continue this strategy with a focus on selling fixed-rate auto tranches with 1.0 to 2.0-year average lives and purchasing floating-rate alternatives. Within CLOs, we remain focused on short-tenor AAA-rated senior tranches. At current spreads, we do not anticipate materially increasing our exposure to fleet lease or dealer floorplan securitizations.
Performance: Despite wider benchmark spreads, our ABS holdings still generated positive performance across all of our strategies in the first quarter after adjusting for their duration and yield curve exposure. All subsectors were positive with our fixed-rate, private student loan positions generally the best performers. Our auto holdings were positive with our subprime auto positions outpacing our prime auto positions. Overall, our fixed-rate investments generally outperformed our floating-rate holdings including our CLO holdings which were essentially flat.
CMBS
Recap: In comparison to like-duration Treasuries, CMBS securities showed mixed performance over the course of the first quarter. At the end of the quarter, three-year conduit tranches stood at a spread of 39 basis points over Treasuries (11 basis points wider). Three-year Freddie Mac “K-bond” tranches showed a similar relationship, ending the quarter at spreads of 43 basis points over Treasuries (4 basis points wider). Over the course of the quarter, over $75 billion of new issue CMBS came to market, well ahead of the $60 billion seen in the first quarter of 2020. The increase is attributable to heavy agency CMBS issuance, with over $52 billion of agency deals coming to the market in the first quarter of 2021, compared to $34 billion in last year’s first quarter. In non-agencies, the quarter was marked by heavy issuance in the “Other” category (a catchall subsector that includes CRE CLOs). Almost $9 billion of “Other” non-agency CMBS priced in the first quarter, along with $6 billion of conduit deals and $9 billion of single-asset, single-borrower (“SASB”) transactions.
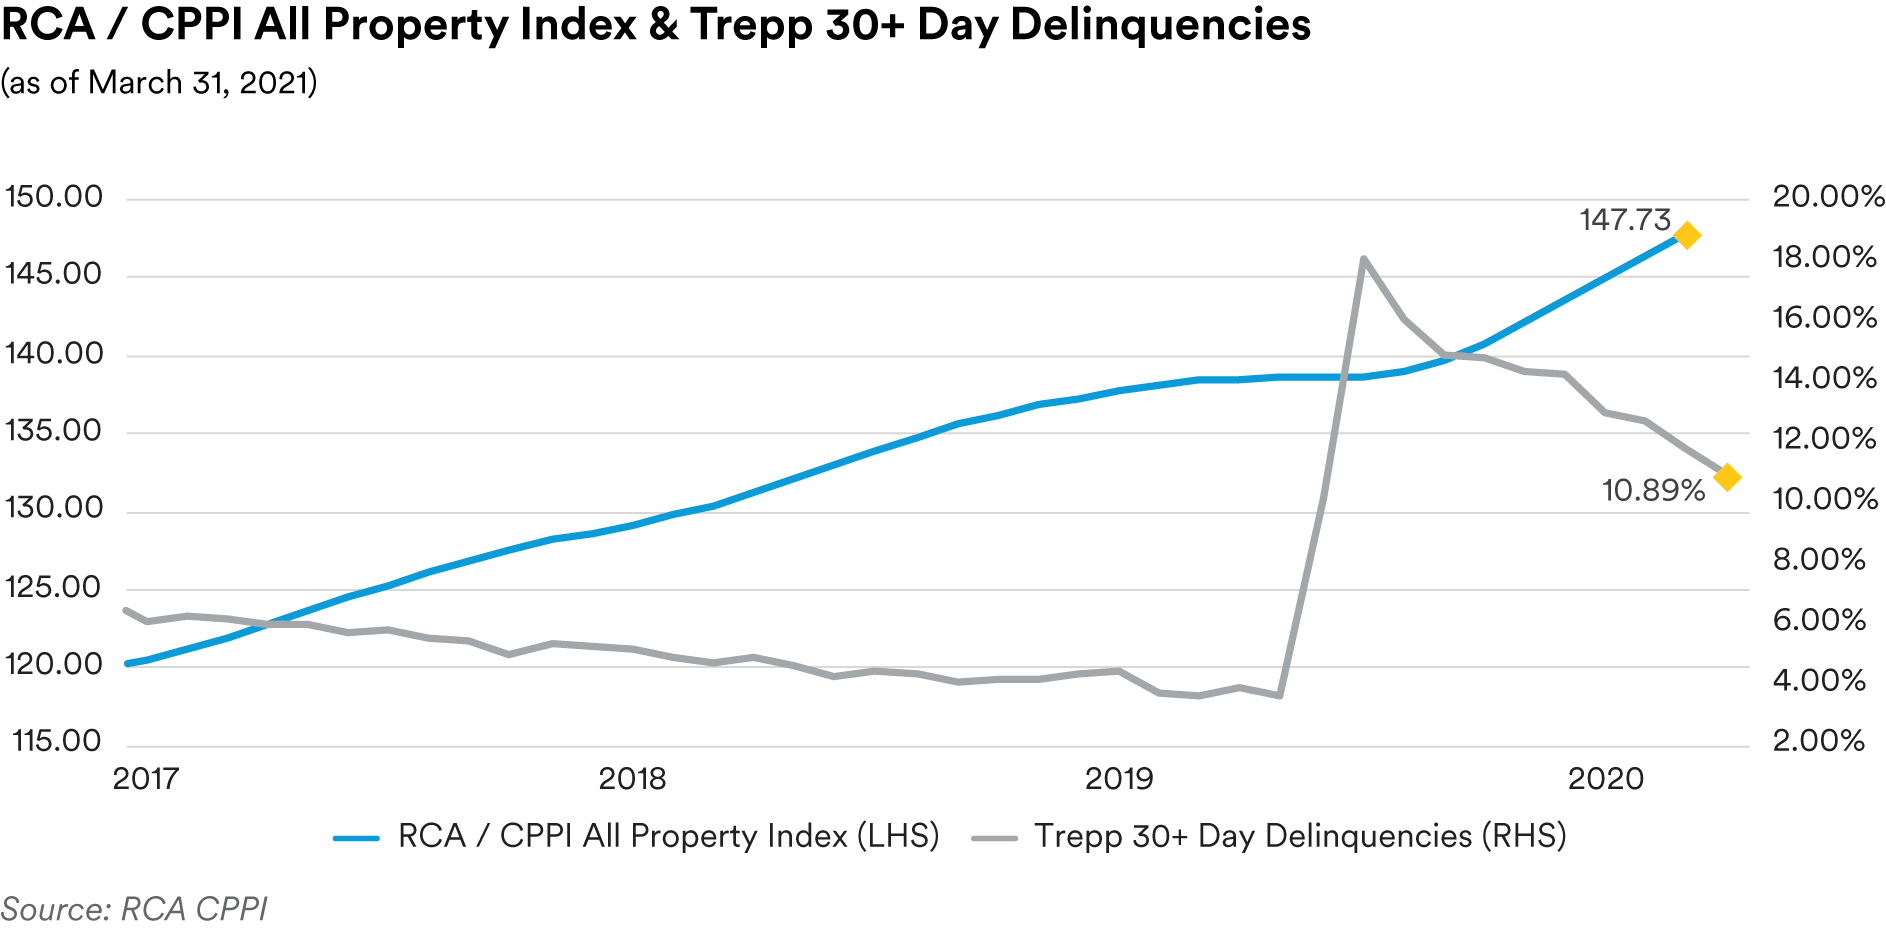
Continuing a trend seen since June of last year, CMBS delinquencies continued to decline over the course of the first quarter. The Trepp 30+-day delinquency rate ended the quarter at 6.58%, reflecting a drop of 22 basis points in March and a drop of 123 basis points in the first quarter. As a result of the pandemic, delinquencies had surged, reaching a peak of 10.32% in June (only slightly below July 2012’s 10.34% all-time high) but have since moved lower. Lodging properties remain the worst performing subsector despite lodging delinquencies dropping 385 basis points over the quarter to 15.95%. One year ago, prior to the pandemic, lodging delinquencies stood at only 1.53%. Retail properties saw delinquencies drop 205 basis points over the quarter to 10.89%. In comparison, retail delinquencies stood at only 2.89% at the end of last year’s first quarter. Industrial properties remained the best performers with delinquencies falling 41 basis points over the quarter to 0.73%. Notably, multi-family properties saw delinquencies rise 84 basis points in March to end the quarter at 3.14%, an increase of 39 basis points over the quarter. While the increase in multi-family delinquencies bears watching, we do not believe it presents a meaningful risk to our portfolios due to the healthy demand for rental properties and large-scale government stimulus programs supporting consumers.
Commercial real estate prices continued their climb higher over the first quarter with the March release of the RCA CPPI National All-Property Composite Index showing prices rose 6.8% on an annualized basis through February to 147.7, a growth rate comparable to that seen in the months immediately prior to the pandemic. The retail sector was the only property type showing price declines, with retail property prices dropping 1.4% year-over-year. However, in the report RCA noted that the pace of retail price declines seems to be abating as retail property prices were falling at a nearly 3% pace at the end of 2020. Industrial properties showed the highest growth with prices rising 8.1% year-over-year, supported by the logistics sector which is seeing increased demand for warehouse space due to the growth in online shopping and cold storage space needed for vaccines. Interestingly, RCA also noted that the spread between price gains in the six Major Metros (Boston, Chicago, Los Angeles, New York, San Francisco and Washington, D.C.) and the Non-Major Metros (all secondary and tertiary markets) continues to widen, with the non-majors gaining 8.04% year-over-year, in comparison to only a 1.7% gain in the majors.
Portfolio Actions & Outlook: Over the course of the quarter we generally maintained or increased our CMBS exposure across our strategies. The exception was in our longest duration strategy where we modestly reduced exposure. This was accomplished through reinvesting the paydowns on our existing holdings into other spread sectors rather than actively selling CMBS positions. Overall, we generally increased our exposure to the non-agency sector, adding both fixed-rate conduit tranches and floating-rate SASB tranches. In our view, bank demand has driven agency CMBS spreads to levels where better relative value can be found in non-agencies. In addition, given the current shape of the yield curve, we favor floating-rate securities over 1-2 year fixed-rate alternatives. Accordingly, our 1-2 year agency CMBS holdings were prime candidates to sell to fund the purchases of floating-rate investments (both in CMBS and other spread sectors). In furtherance of this strategy, we added several floating-rate SASB tranches over the quarter, including purchases of AAA and AA-rated bonds collateralized by industrial and multi-family properties.
We expect to continue this strategy for the foreseeable future. We are actively seeking to increase our exposure to floating-rate SASB tranches in deals with high-quality sponsors that offer attractive spreads and are backed by select property types. In that regard, at the present time we are still avoiding retail, lodging and office properties in favor of industrial, healthcare and multi-family alternatives.
Performance: Our CMBS holdings added to performance across all strategies over the quarter after adjusting for duration and yield curve positioning. Our non-agency holdings were generally the best performers in our shorter strategies, while our agency CMBS positions were the best in our longer duration strategies. Within non-agencies, performance was fairly balanced between our fixed-rate conduit holdings and our floating-rate SASB positions. As a group, our AAA-rated SASB tranches performed better than our AA-rated tranches. This was due to the recovery in several 2019 vintage AAA-rated holdings collateralized by extended care facilities that had suffered price deterioration from the pandemic. Ignoring the effect of those particular tranches, our AA-rated SASB holdings generally outperformed our AAA-rated holdings, which is to be expected given their higher coupon income.
RMBS
Recap: Residential mortgage-backed securities’ spreads showed mixed performance over the course of the first quarter with the Fed’s ongoing QE purchase program blunting the impact of rising nominal interest rates. Bonds backed by 15-year and 30-year collateral ended the quarter at spreads of 45 basis points over five-year Treasuries (10 basis points wider) and 29 basis points over ten-year Treasuries (14 basis points tighter), respectively. Non-agencies were wider in spread with prime, jumbo front cashflow tranches ending the quarter at a spread of 122 basis points over Treasuries (14 basis points wider).
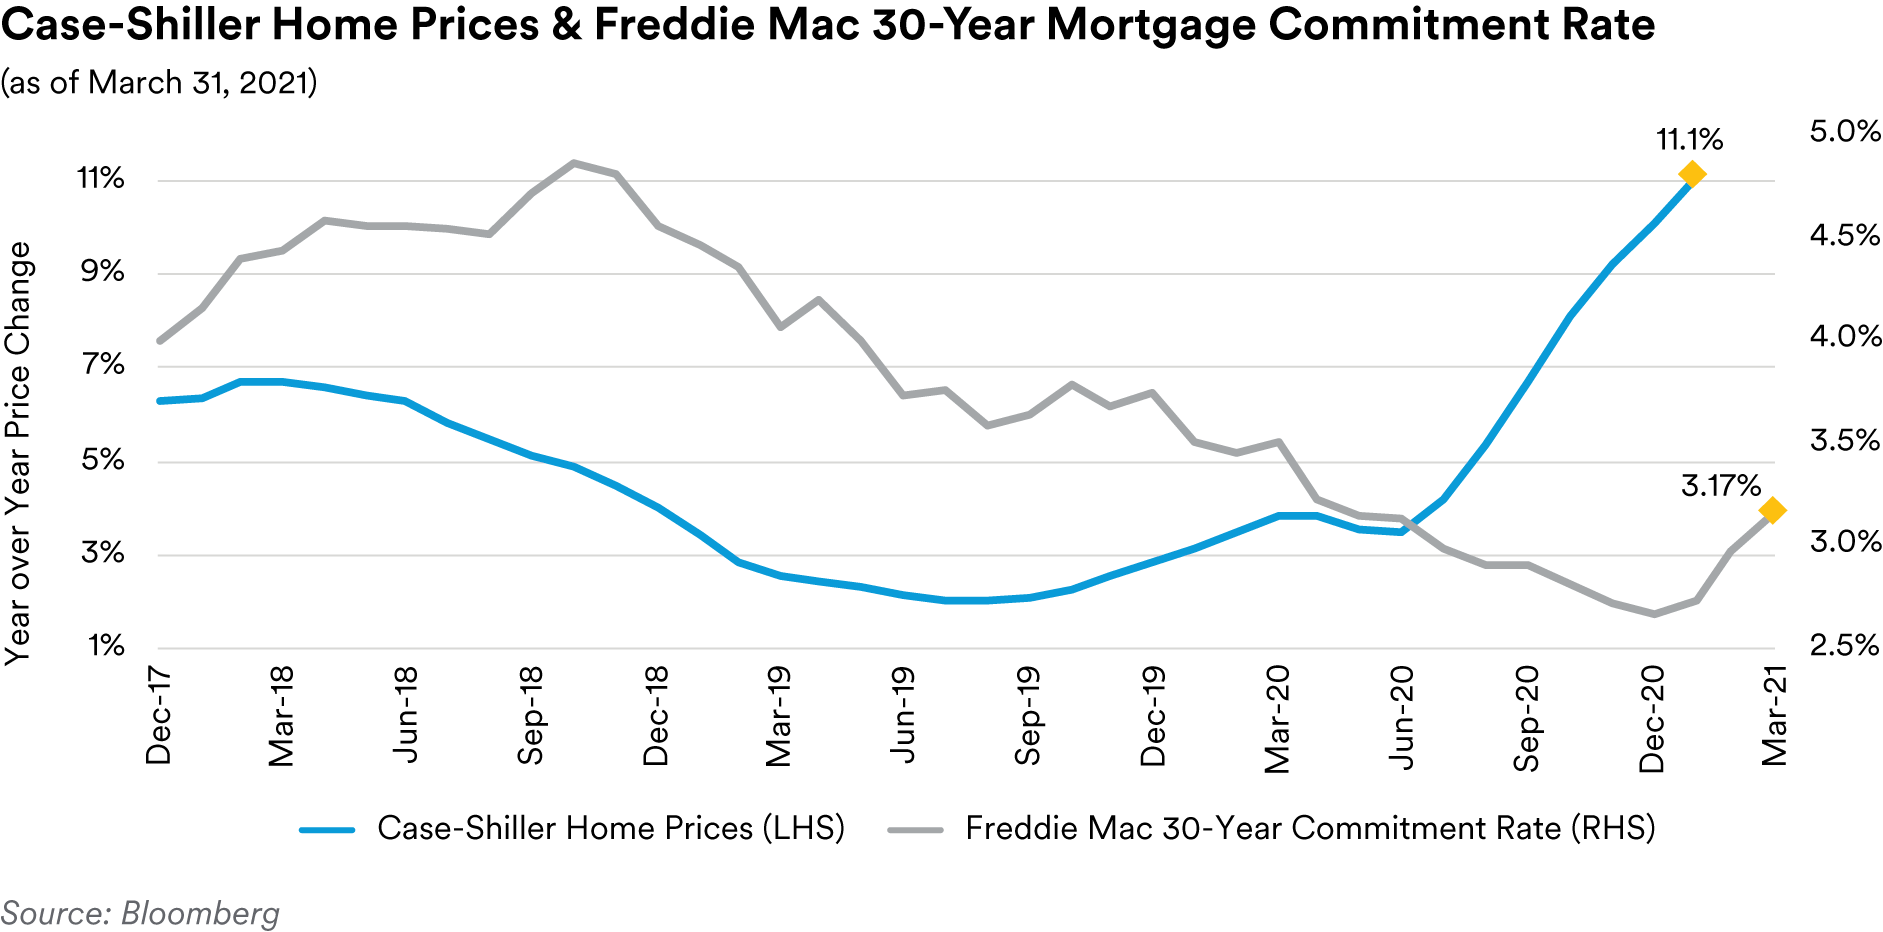
With interest rates moving higher over the quarter, mortgage rates followed suit after hitting record lows in the fourth quarter of last year. The Freddie Mac 30-year mortgage commitment rate stood at 3.17% at the end of March, 51 basis points higher than at the start of the year and only 15 basis points below last year’s March level of 3.33%. Despite the pullback, mortgage rates are still very low by historical standards which, when combined with tight inventory levels, has provided strong support to housing prices. The latest release of the S&P CoreLogic Case-Shiller 20-City Home Price Index showed home prices rising at an 11.1% annualized pace through January in the twenty cities tracked by the index with price gains accelerating over the prior eight months. On a national level, Case-Shiller’s data showed prices rose 11.2% year-over-year, the largest gain since February 2006.
Home sales trended lower over the quarter, pulling back from the dramatic pace seen in the second half of last year. March’s release showed existing home sales dropping to a six-month low in February, coming in at a 6.2 million annualized pace, the result of a record 29.5% decline in inventory when compared to year-ago inventory numbers. Housing inventory stood at just over 1 million units in February, which at the current sales pace would take only two months to clear. Anything below five months of supply is considered indicative of a tight market. New home sales have also softened with March’s release showing sales printing at a 775,000 annualized pace through February, a nine-month low. In addition to tight inventories, we attribute some of the slowdown in home sales to the abnormally cold weather seen in many parts of the country (Texas, in particular) during the quarter.

On the regulatory front, in March, Republican Senator Pat Toomey released guidelines towards ending government control of Fannie Mae and Freddie Mac. However, his proposals would require support from Democrats which we consider unlikely. In fact, Democratic Senator Sherrod Brown, Chairman of the Senate Banking Committee, has instead signaled a preference for Fannie and Freddie to be treated more like government-controlled utilities with the goal of expanding access to affordable housing and increasing racial equity. This aligns with goals outlined in a recent paper authored by Lewis Ranieri, a former bond trader regarded by many as the “father of mortgage-backed securities”. In our view, significant GSE reform is unlikely to gain much traction for the foreseeable future.
Portfolio Actions & Outlook: Over the course of the quarter we generally reduced our exposure to RMBS in our shorter strategies while maintaining or increasing our exposure in our longer duration strategies. The reduction in our shorter portfolios was generally accomplished by reinvesting the proceeds of elevated mortgage prepayments into other sectors rather than through outright sales. In the longer strategies, we continued to invest in agency specified pools in order to maintain the liquid, defensive posture of the portfolios. However, we also opportunistically increased our exposure to non-agencies as spreads remain relatively attractive in that subsector.
Although prepayments have likely peaked and the economy is beginning to reopen broadly, we expect to continue our current defensive strategy in RMBS into the second quarter. We do not anticipate increasing our exposure in the near term as spreads remain historically tight and prepayments, although likely to drift lower, may remain high for some time. Given the continued strength of the housing market, we are very mindful of the risk that the Fed will announce a tapering or cessation of its MBS purchase activities. On balance, we look to maintain our bias in favor of seasoned 15-year specified pools and opportunistic purchases of short-tenor non-agency tranches. As always, in non-agencies we prefer tranches that we feel offer sufficient spread and structure to compensate for extreme negative convexity effects.
Performance: Our RMBS holdings showed positive performance across most of our strategies in the first quarter. The exception was in one of our shorter strategies where quarterly performance was essentially flat. The results in that strategy were hampered by a relatively heavier weighting in short-tenor agency CMOs that were adversely impacted by heightened prepayments over the quarter. Other subsectors were positive with our 15-year specified pool positions performing the best across all strategies.
Municipals
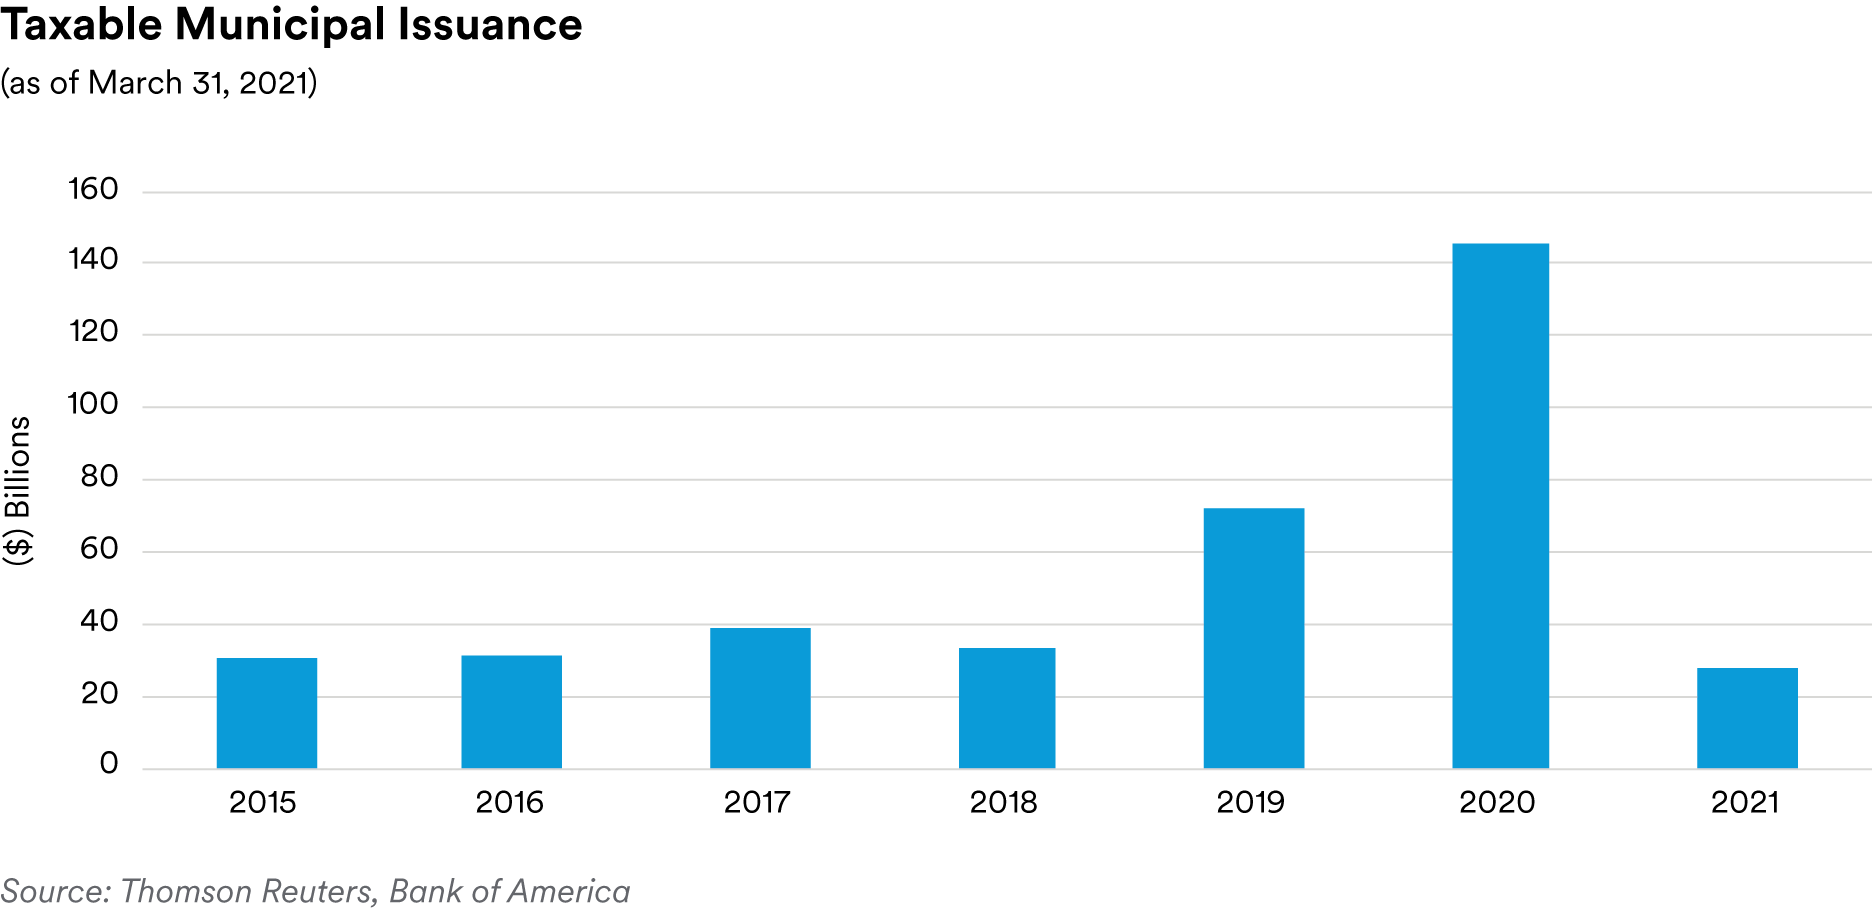
Recap: Total first-quarter municipal issuance of $104 billion was nearly $9 billion larger than last year’s first quarter issuance when the effects of the pandemic initially hit the municipal market. The $27 billion of taxable issuance in the first quarter made up a lower proportion of overall issuance compared to recent quarters, as rising interest rates made advanced refunding deals less attractive at the margin for issuers. Despite the negative absolute returns across the broad market, demand for municipals remained strong over the quarter as portfolio managers needed to invest the $31 billion dollars of net inflows into municipal bond mutual funds.
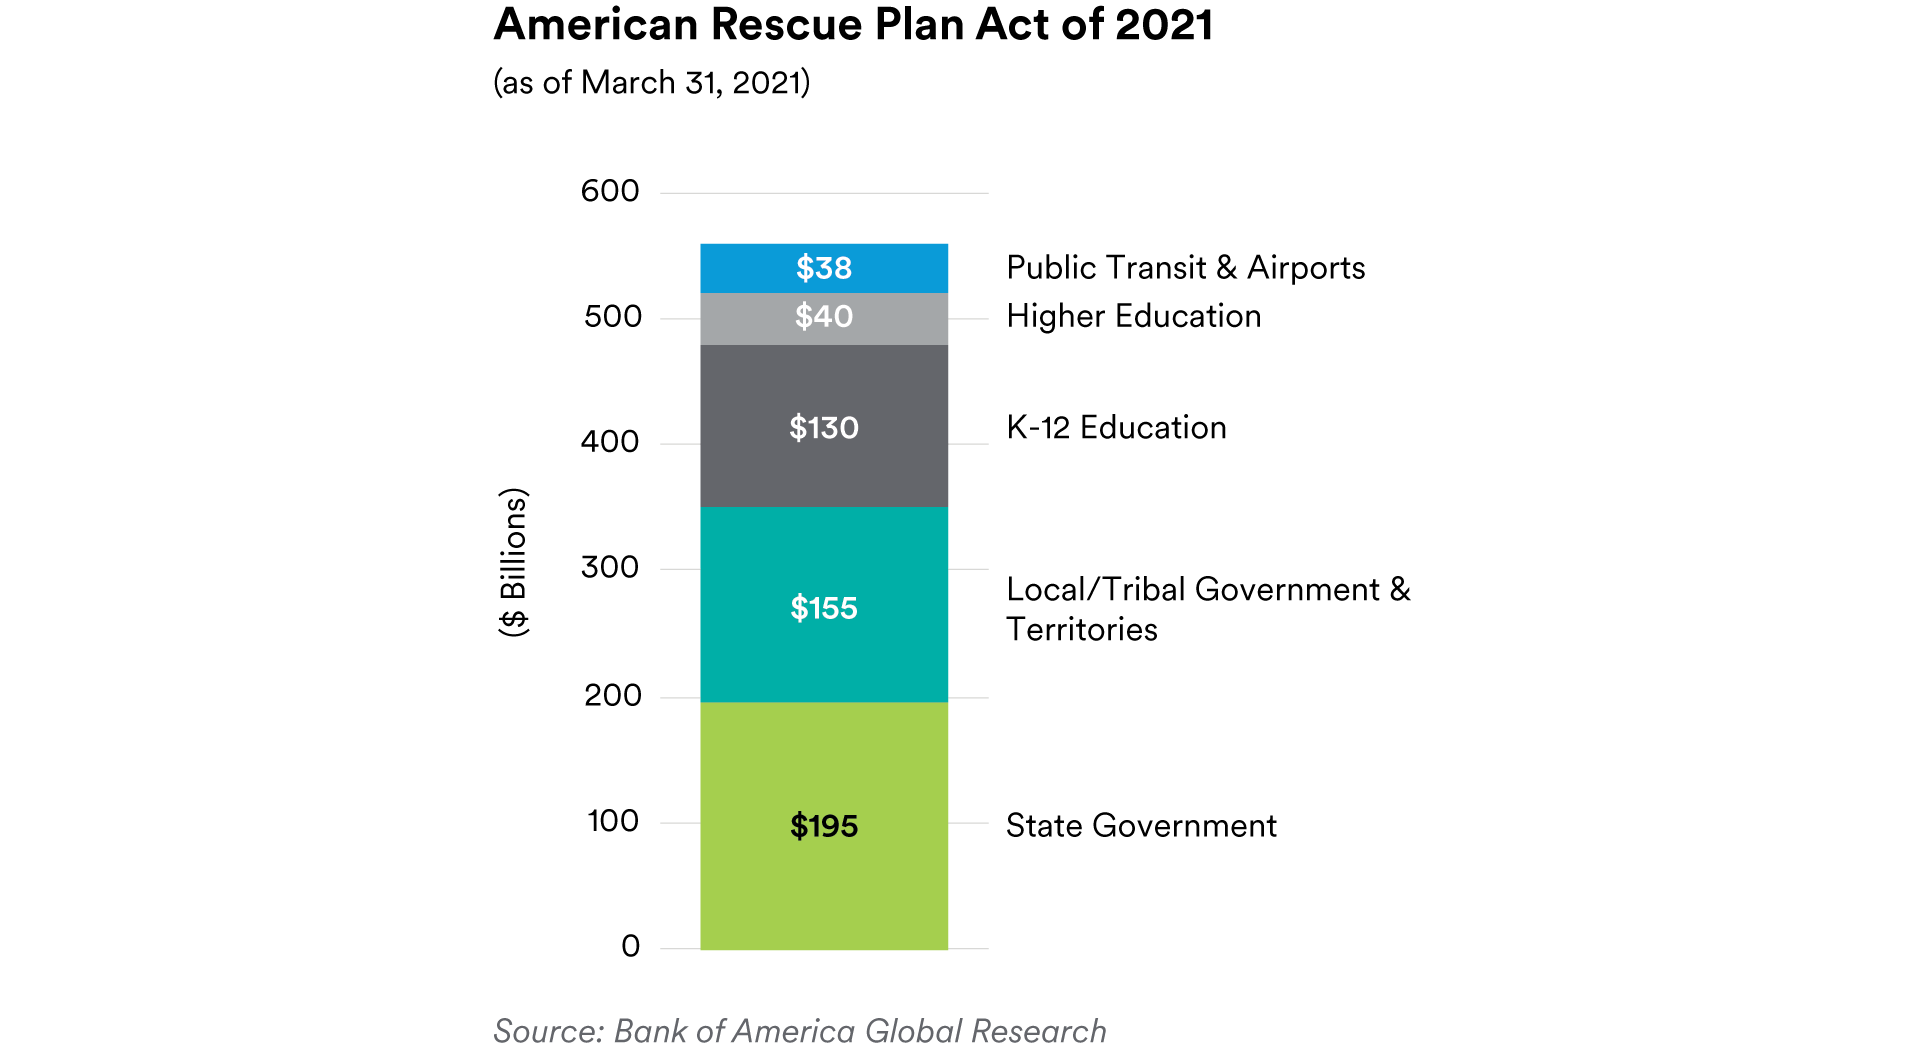
The first several months of the Biden Administration have ushered in an unprecedented number of executive orders and the passage of a $1.9 trillion stimulus package. Between managing the pandemic response and dealing with the flood of immigrants at the southern border, other initiatives such as tax reform, Medicare/Medicaid expansion and infrastructure have taken a back seat but will likely be addressed before the end of the year. The $1.9 trillion American Rescue Plan Act of 2021 included $350 billion for state and local governments, $40 billion for higher education, $30 billion for public transit, and $8 billion for airports. Many of these entities have successfully weathered the pandemic and are already in decent financial shape, so this stimulus should further boost liquidity and provide funding for previously planned projects.
Water and sewer bonds within the Public Utilities sector keep chugging along as people’s needs for these essential services have been relatively steady throughout the pandemic. Public power issuers have seen their customer usage rates increase from the lows associated with pandemic-related economic shutdowns. Industrial and commercial usage had experienced a sharp decline when people were directed to work from home if they were able, but some of that demand for power has been replaced by demand from the residential market. Despite the various policy shifts over the past five years, generation transition to renewable sources shows no signs of slowing for power providers.
Rutgers, the state university of New Jersey, was the first college to announce it will be requiring a COVID-19 vaccination for all students who wish to return to face-to-face (F2F) learning in the fall. Students enrolled in remote online degree programs will not be required to be vaccinated, and there will be medical or religious exemptions available as well. We expect other colleges and universities to follow suit and most institutions of higher education anticipate a return to normal operations by this upcoming fall.
TSA throughput, or the number of passengers processed through security at airports, experienced a strong rebound in the first quarter, a credit positive for the airport subsector. After closing out 2020 down 62% from 2019 levels, TSA throughput was only down 40% at the end of the first quarter. For comparative purposes, average daily TSA throughput was 2.3 million in 2019 and the daily average from March through December of 2020 declined to 658,000. March 2021’s daily average throughput increased to 1.2 million. As we have noted previously, not all airports have enjoyed this recovery equally; warm weather, mid-continent, large hubs and airports that have historically had a low international traveler mix have fared significantly better than coastal airports and those with a higher international component. Given our estimates of breakeven enplanement levels, assuming fees and charges are held constant, airports remain in good financial shape on balance. With pent up demand for leisure travel, we can expect further improvement in enplanements as more and more people are vaccinated and feel increasingly comfortable traveling.
Portfolio Actions & Outlook: We were active in the first quarter in both the primary and secondary markets, adding to our toll road and airport exposure, as well as bonds within the local government subsector. Given the resiliency in demand for toll roads, improving trajectory of air travel numbers, reopening of the economy, and robust housing markets across the U.S., we believe these subsectors are poised to outperform. We sought to take advantage of spread tightening in the higher education, healthcare and tax-backed subsectors and sold a number of our holdings to rotate into other spread sectors.
Taxable issuance has been stable but due to higher interest rates, we would not expect supply to increase significantly without the federal government passing into law a large infrastructure spending package along the lines of the $2.25 trillion proposal announced by the administration. There are several different ways a federal infrastructure plan could affect the municipal market. When the federal government provides funding for infrastructure, state and local governments, as well as transportation agencies, often need to raise additional funding via the municipal bond market to finance their portion of a project. We would expect issuers to use the tax-exempt market to raise money when they are legally able to do so to save on financing costs, likely seeing some taxable issuance in that scenario as well. In addition, there has been talk of introducing a program, similar to the Build America Bonds (BABs) Program from 2009 – 2010, where interest payments on qualifying taxable bonds would be subsidized by the federal government. Like the BAB program over a decade ago, we would expect a significant increase in taxable supply if such a scenario comes to fruition.
The administration has made it a goal to have enough vaccines available for every American adult to be able to get at least a first shot by May 1st. Regardless of whether that deadline is met, the pace of the vaccine rollout has picked up significantly and represents a positive catalyst for municipal bonds. State and local governments have seen stronger than expected revenue recovery and the recently passed fiscal stimulus could serve as a tailwind for those subsectors. We expect a return to college campuses for F2F learning in the fall, which should help shore up finances at and maintain demand for institutions of higher education. We feel airports have managed the pandemic remarkably well and further stimulus money, while arguably unnecessary, will only help further bolster liquidity during a time when we are expecting the demand for air travel to increase.
Performance: Performance of our municipal holdings over the first quarter was positive across all our strategies. On an excess return basis, some of our best performing municipal subsectors included Transportation, Utilities, Higher Education and Healthcare as well as a few State and Local Government bonds.
Disclaimers
This document is being provided to you at your specific request. This document has been prepared by MetLife Investment Management., a U.S. Securities Exchange Commission-registered investment adviser.1
This document is being distributed by MetLife Investment Management Limited (“MIML”), authorised and regulated by the UK Financial Conduct Authority (FCA reference number 623761), registered address Level 34 One Canada Square London E14 5AA United Kingdom. This document is only intended for, and may only be distributed to, investors in the EEA who qualify as a Professional Client as defined under the EEA’s Markets in Financial Instruments Directive, as implemented in the relevant EEA jurisdiction. The investment strategy described herein is intended to be structured as an investment management agreement between MIML (or its affiliates, as the case may be) and a client, although alternative structures more suitable for a particular client can be discussed.
For investors in Japan, this document is being distributed by MetLife Asset Management Corp. (Japan) (“MAM”), a registered Financial Instruments Business Operator (“FIBO”) conducting Investment Advisory Business, Investment Management Business and Type II Financial Instruments Business under the registration entry “Director General of the Kanto Local Finance Bureau (Financial Instruments Business Operator) No. 2414” pursuant to the Financial Instruments and Exchange Act of Japan (“FIEA”), and a regular member of the Japan Investment Advisers Association and the Type II Financial Instruments Firms Association of Japan. In its capacity as a discretionary investment manager registered under the FIEA, MAM provides investment management services and also sub-delegates a part of its investment management authority to other foreign investment management entities within MIM in accordance with the FIEA. This document is only being provided to investors in Japan who are Qualified Institutional Investors (tekikaku kikan toshika) as defined in Article 10 of Cabinet Office Ordinance on Definitions Provided in Article 2 of the FIEA. It is the responsibility of each prospective investor to satisfy themselves as to full compliance with the applicable laws and regulations of any relevant territory, including obtaining any requisite governmental or other consent and observing any other formality presented in such territory.
MetLife, Inc. provides investment management services to affiliates and unaffiliated/third party clients through various subsidiaries.1 MetLife Investment Management (“MIM”), MetLife, Inc.’s institutional investment management business, has more than 900 investment professionals located around the globe. MIM is responsible for investments in a range of asset sectors, public and privately sourced, including corporate and infrastructure private placement debt, real estate equity, commercial mortgage loans, customized index strategies, structured finance, emerging market debt, and high yield debt. The information contained herein is intended to provide you with an understanding of the depth and breadth of MIM’s investment management services and investment management experience. This document has been provided to you solely for informational purposes and does not constitute a recommendation regarding any investments or the provision of any investment advice, or constitute or form part of any advertisement of, offer for sale or subscription of, solicitation or invitation of any offer or recommendation to purchase or subscribe for any securities or investment advisory services. Unless otherwise specified, the information and opinions presented or contained in this document are provided as of the quarter end noted herein. It should be understood that subsequent developments may affect the information contained in this document materially, and MIM shall not have any obligation to update, revise or affirm. It is not MIM’s intention to provide, and you may not rely on this document as providing, a complete or comprehensive analysis of MIM’s investment portfolio, investment strategies or investment recommendations.
No money, securities or other consideration is being solicited. No invitation is made by this document or the information contained herein to enter into, or offer to enter into, any agreement to purchase, acquire, dispose of, subscribe for or underwrite any securities or structured products, and no offer is made of any shares in or debentures of a company for purchase or subscription. Prospective clients are encouraged to seek advice from their legal, tax and financial advisors prior to making any investment.
Confidentiality. By accepting receipt or reading any portion of this Presentation, you agree that you will treat the Presentation confidentially. This reminder should not be read to limit, in any way, the terms of any confidentiality agreement you or your organization may have in place with Logan Circle. This document and the information contained herein is strictly confidential (and by receiving such information you agree to keep such information confidential) and are being furnished to you solely for your information and may not be used or relied upon by any other party, or for any other purpose, and may not, directly or indirectly, be forwarded, published, reproduced, disseminated or quoted to any other person for any purpose without the prior written consent of MIM. Any forwarding, publication, distribution or reproduction of this document in whole or in part is unauthorized. Any failure to comply with this restriction may constitute a violation of applicable securities laws.
Past performance is not indicative of future results. No representation is being made that any investment will or is likely to achieve profits or losses or that significant losses will be avoided. There can be no assurance that investments similar to those described in this document will be available in the future and no representation is made that future investments managed by MIM will have similar returns to those presented herein.
No offer to purchase or sell securities. This Presentation does not constitute an offer to sell or a solicitation of an offer to buy any security and may not be relied upon in connection with the purchase or sale of any security.
No reliance, no update and use of information. You may not rely on this Presentation as the basis upon which to make an investment decision. To the extent that you rely on this Presentation in connection with any investment decision, you do so at your own risk. This Presentation is being provided in summary fashion and does not purport to be complete. The information in the Presentation is provided to you as of the dates indicated and MIM does not intend to update the information after its distribution, even in the event that the information becomes materially inaccurate. Certain information contained in this Presentation, includes performance and characteristics of MIM’s by independent third parties, or have been prepared internally and have not been audited or verified. Use of different methods for preparing, calculating or presenting information may lead to different results for the information presented, compared to publicly quoted information, and such differences may be material.
Risk of loss. An investment in the strategy described herein is speculative and there can be no assurance that the strategy’s investment objectives will be achieved. Investors must be prepared to bear the risk of a total loss of their investment.
No tax, legal or accounting advice. This Presentation is not intended to provide, and should not be relied upon for, accounting, legal or tax advice or investment recommendations. Any statements of U.S. federal tax consequences contained in this Presentation were not intended to be used and cannot be used to avoid penalties under the U.S. Internal Revenue Code or to promote, market or recommend to another party any tax-related matters addressed herein.
Forward-Looking Statements. This document may contain or incorporate by reference information that includes or is based upon forward-looking statements within the meaning of the Private Securities Litigation Reform Act of 1995. Forward-looking statements give expectations or forecasts of future events. These statements can be identified by the fact that they do not relate strictly to historical or current facts. They use words and terms such as “anticipate,” “estimate,” “expect,” “project,” “intend,” “plan,” “believe,” “will,” and other words and terms of similar meaning, or are tied to future periods in connection with a discussion of future performance. Forward-looking statements are based on MIM’s assumptions and current expectations, which may be inaccurate, and on the current economic environment which may change. These statements are not guarantees of future performance. They involve a number of risks and uncertainties that are difficult to predict. Results could differ materially from those expressed or implied in the forward-looking statements. Risks, uncertainties and other factors that might cause such differences include, but are not limited to: (1) difficult conditions in the global capital markets; (2) changes in general economic conditions, including changes in interest rates or fiscal policies; (3) changes in the investment environment; (4) changed conditions in the securities or real estate markets; and (5) regulatory, tax and political changes. MIM does not undertake any obligation to publicly correct or update any forward-looking statement if it later becomes aware that such statement is not likely to be achieved.
This strategy is not available to investors outside the U.S.
1 Subsidiaries of MetLife, Inc. that provide investment management services include Metropolitan Life Insurance Company, MetLife Investment Management, LLC, MetLife Investment Management Limited, MetLife Investments Limited, MetLife Investments Asia Limited, MetLife Latin America Asesorias e Inversiones Limitada, MetLife Asset Management Corp. (Japan), and MIM I LLC.