Fixed income markets largely enjoyed a remarkable rally to close out 2023 with positive returns across all asset classes. Entering 2023, expectations leaned optimistic given the rout of 2022 from higher rates but sentiment would quickly erode as the effects of higher rates took casualties in the banking sector and shined the light on challenges of those closely related sectors. Nonetheless, while the challenges in some sectors and opportunities in others were fundamental drivers of return, technicals were an overwhelmingly persistent theme throughout. So much so, that our Long Duration team published a detailed review in their work, “The Year of the Long Bond” focusing on those technical dynamics in the long maturity space. Overall strong demand for fixed income was supported by positive fund flows for all but 2 weeks in 2023.1 Demand was met with relatively healthy supply, however the composition of that supply favored short-dated maturities and defensive sectors contributing to the technical pressures.2
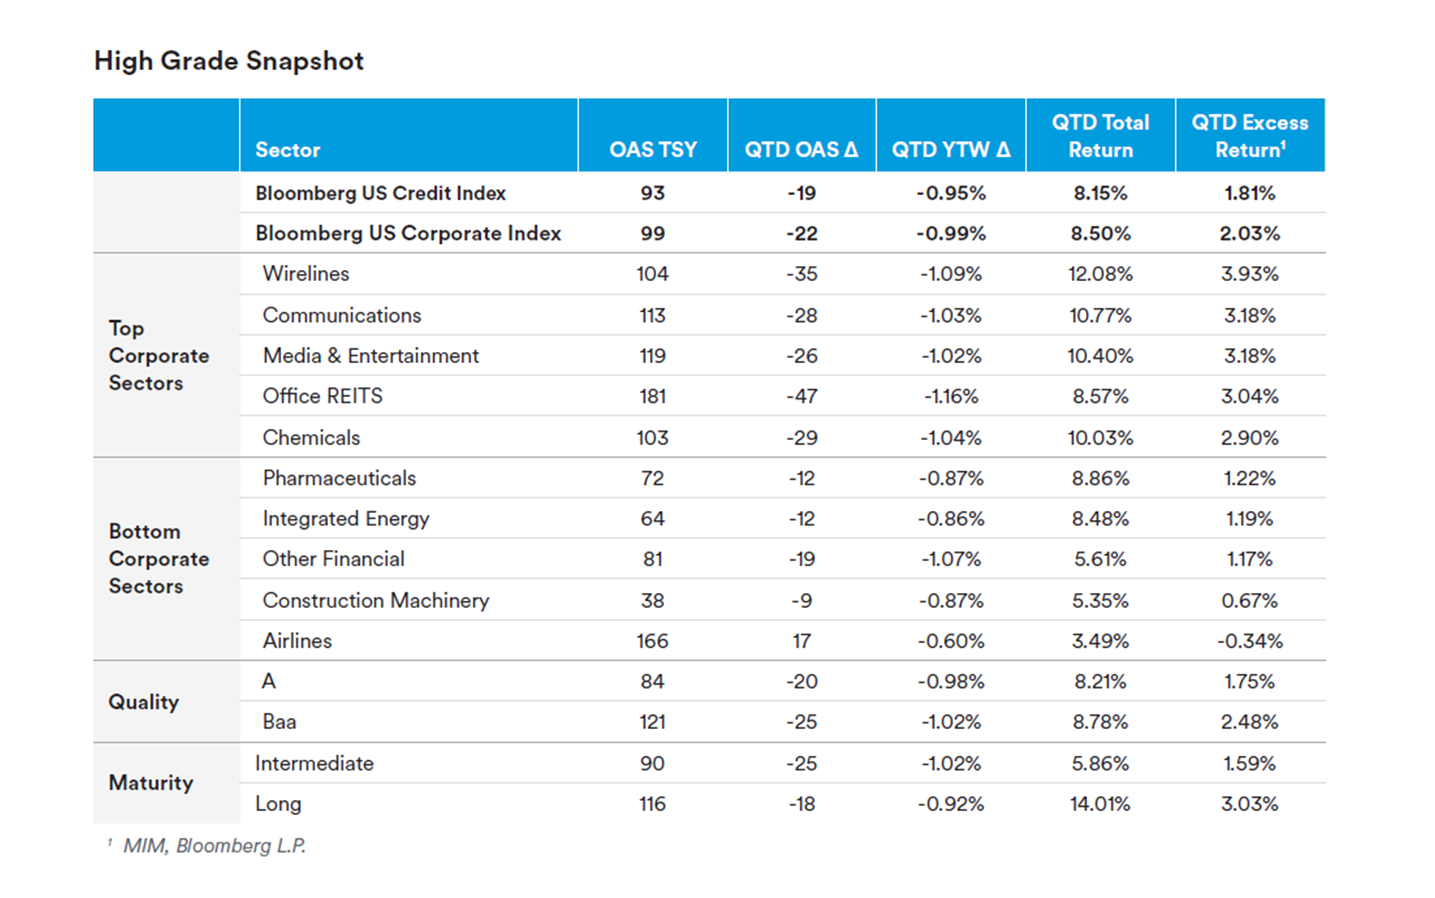
In the 4th quarter of 2023, the Bloomberg Corporate Index yield peaked on October 19 at 6.43% with 130 basis points (bps) of option adjusted spread (OAS).2 The Corporate Index OAS since then tightened 25 basis points in November followed by a grind tighter in December to levels as low as 98 basis points—well below the 10- year average of 124 basis points for the index. The move tighter in spreads was not limited to just corporates, mortgages as well as other structured asset classes took part as well with a move 29 bps tighter on spread in mortgages on top of the gains from rates overall. Following positive prints on the data front (CPI, Payrolls, Wages) and dovish commentary from the Fed, the 10Yr US Treasury yield rallied more than 100 basis points from a high of 4.99% in October further supporting the positive momentum in all risk assets. While the treasury yield curve remains inverted, the 2s10s curve steepened off the lows to -37 bps. Non-financial corporate credit curves remained flat despite modest a modest steepening in the 5s/10s—primarily in large US Banks curves and lower rated non-financials.
With the Fed not yet declaring victory in its long-running battle against inflation nor pushing back on loosening conditions, many participants have speculated that they are likely done with further rate hikes. This speculation around the “Fed Pivot” spurred a broad rally in markets to close out the year as investors were eager to put excess cash to work. Data supporting the pivot appear to be slowing gains in nonfarm payrolls coupled with resilient GDP growth, CPI (both Core and broad based) well off the peaks and trending towards the goal coupled with the annualized trend of 3-month PCE now reading 2.2% - a figure the Fed, in our opinion, can certainly gain comfort with given their preferred measure for inflation being Personal Consumption Expenditure (PCE). However, with the widely held market narrative shifting to a soft-landing scenario and the timing of the first rate cuts, exuberant markets pulled the pricing of cuts forward as soon as March 2024 with six total cuts priced in a divergence from the Fed’s dot plot (3 cuts expected as of December 2023) and hawkish messaging albeit an overall dovish tone from Chairman Powell.
Following the most recent earnings cycle, broad corporate fundamentals remained resilient with some mixed results for both operating performance and credit metrics. The gross leverage ratio change quarter-over-quarter ticked higher on the margin while interest coverage experienced a greater deterioration, as expected with the rising interest costs and revenue contractions. At the sector level, Pharmaceuticals saw the largest y-o-y change in leverage which can be attributed to the Pfizer and Amgen debt issues this year while Diversified Media captured some of the largest y-o-y decrease in leverage attributable to Warner Bros Discovery and Oracle amongst others. Another development in the metrics was that cash paid to shareholders has declined, a plus for bond holders, as corporations looked to conserve cash in the current environment given looming uncertainties.
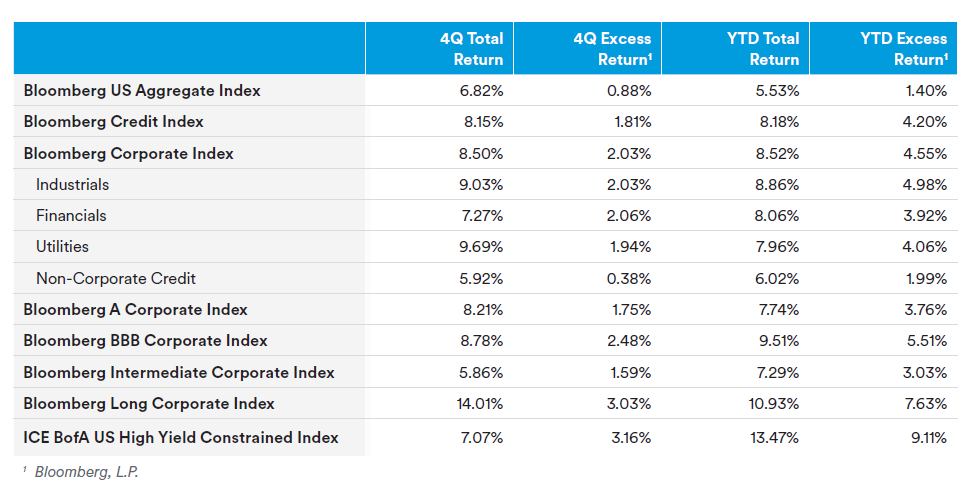
Over the quarter, excess returns were substantial with the Corporate Index returning 200 basis points above duration matched treasuries. Lower quality (BBB, 2.48% excess) outpaced single A (1.75% excess) delivering roughly 75 basis points in additional excess return throughout the rally.2 Within Wirelines, larger contributors to the moves were AT&T and Verizon, while Office REITs enjoyed a rebound from the broad move in risk assets. Paramount and Warner Bros Discovery following news of merger discussions were larger movers in the Media & Entertainment while Charter Communications aided Communications sector performance. Laggards within the index were the Pharmaceutical sector, Integrated Energy dragging from lower oil prices and Airlines despite positive demand for travel. Away from idiosyncratic momentum, much of the move in spreads was attributable to the aforementioned strong technical backdrop with robust demand from investors chasing the historically attractive all-in yields in Investment Grade Credit. With spreads wrapped around their year-to-date tights, we believe valuations are full at these levels.


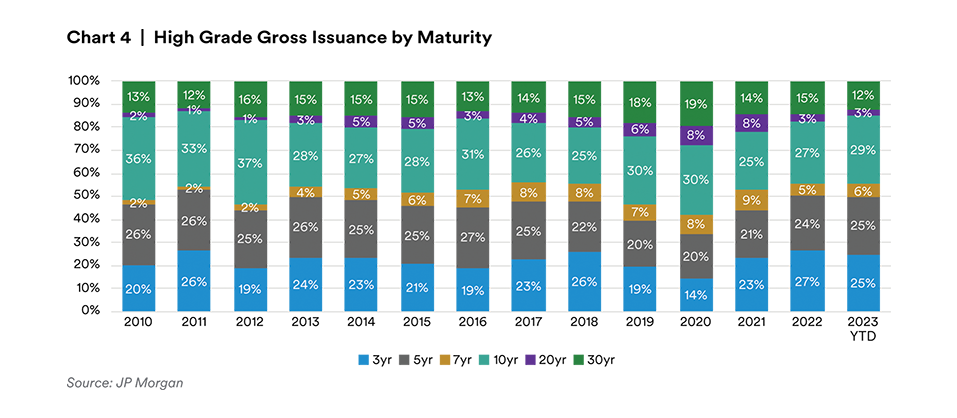
The fourth quarter’s print of $208bn was the slowest quarter of the year in terms of issuance—an overall figure that is down 2% compared with the past four-year average of $212bn. This compares with 3Q23 supply of $286bn, 2Q23 of $316bn and 1Q23 of $396bn with 2023 total issuance closing at $1,207bn. As previously alluded to, the share of long maturity issuance (10+ yrs) in 2023 stands out at just 14% of the total supply. This share is the lowest since 2011 when it was only 12%. The short-dated bias in issuance pushed the average tenor of new issues to 9.6 years down from 10.1 in 2022, 10.7 in 2021 and 12.6 in 2020. Although this trend is not unexpected given issuers terming out debt in 2020 and the upwards direction of rates in the past two years; the decline in in the share of long end-maturities 2023 (14%) vs. 2022 (16%), 2021 (21%) and 2020 (26%) has led to a dominant technical. Among sectors, Non-Financials were more active this year, issuing $719bn or 60% of the total issuance while Financial supply was only $488bn. More granularly, Yankee Banks ($229bn, 19% share of total supply) and US Banks ($171bn, 14%) were the largest issuers within Financials while the Healthcare/Pharma ($120bn, 10%) and Utilities ($117bn, 10%) accounted for the largest sectors of the Non-Financials. M&A funding in HG markets was active this year with $175bn, or 14% of the total supply. The largest deal was priced by Pfizer of $31bn in mid-May in relation to its acquisition of Seagen. The second largest deal also came in relation to M&A in Healthcare/Pharma from Amgen’s acquisition of Horizon Therapeutics in mid-February for $24bn.3


4Q 2023 Market Outlook—Corporate
Before we turn the page to 2024 we would be remiss not to be introspective on what we got wrong and right in 2023. Admittedly there was plenty of the former. We were subscribers to what one year ago was pegged as the highest probability of recession on record (according to a Federal Reserve survey of professional forecasters). We reasoned that the velocity of the rate hiking cycle would eventually filter through and ultimately stall the economy, which coupled with tightened lending standards would impede both consumer and business investment. This outcome may still be realized, but what we clearly misjudged was the extended timeline of the impact of policy tightening, and more recently, the Federal Reserve’s willingness to declare (prematurely?) victory on achieving a soft landing. November saw the largest easing in US financial conditions of any single month in the past four decades—a condition that in prior months this year would have prompted pushback from the Fed. The absence of such rebuttal this time likely highlights the Fed’s comfort in no longer policing these market moves. This catalyzed a risk-on move to end the year that was squarely the outcome we found most improbable—which was an aggressive move tighter in spreads (and risk assets in general). Our view on the macro backdrop this year led us to carry an elevated allocation to Treasuries which we could redeploy back into credit risk at more attractive valuations. Those conditions never presented themselves—save for a brief flareup around the regional bank crisis. We do not fashion ourselves as “macro” investors, but certainly we must have broad views on the what the macro conditions mean for credit, and our view in 2023 was wrong.
Where we do believe we can consistently add value, regardless of market conditions, is through security selection. We believe we largely got that right, which served as a valuable ballast to our overly conservative positioning. The vast majority of our key overweights generally delivered outsized returns. Our selective participation in the primary market generally added value through the realization of occasionally generous new issue concessions. Our focus on monetizing strong performance in down-in-quality and less liquid credits in favor of those which are likely to prove more durable in a sell-off has positioned the portfolio well for 2024.
We considered a few different recent corollaries from a valuation perspective in framing our outlook. We believe 2024 will begin with the OAS of the Bloomberg Corporate Index inside 100bp. Not far off from the 96bp OAS where we began 2021—coming off a remarkable year by any standard, but one in which credit was entering a period of economic expansion (buoyed by unprecedented stimulus) with a focus on corporate balance sheet repair. The same conditions are not present today, in our view. Even the most bullish growth forecasts for US GDP are 2%, versus the nearly 6% achieved in 2021. Companies did an admirable job back then of taking advantage of historically low rates to term out debt or just add almost free long-term financing (Google printed a 30-year at 2.05%!). Today, the average coupon of new issues is almost 3% above that of maturing bonds. Interest expense has risen 17% y/o/y, and those companies most sensitive to this jump in interest expense are high yield companies, which are staring at the largest 2-year maturity wall on record. In retrospect, we would argue that 2021 was about as favorable a backdrop as you may will find for credit given the starting level of valuations —yet spreads mustered a mere 4bp of spread tightening and a 1.6% excess return. A better comparison is probably 2022, a year with a similarly tight starting spread (92bp), but one which saw a more challenged economic backdrop that contributed to spreads moving 38bp wider.
This somewhat simplistic exercise is not to suggest that 2024 must mirror a previous time period, as much as it is to highlight that today’s valuations are a real impediment to spread tightening. 2023—and really the last two months of 2023—have priced the rosiest of outcomes. That outcome would see inflation continue its unabated move lower, which allows the Fed to embark on consistent and deep rate cuts that will support the economy before last year’s policy tightening has a chance to really stunt growth. If this outcome is achieved, we are probably looking at a “carry” year at best. We really struggle to outline the scenario in which we could breach, or even approach, the post-GFC tights in spread of 80bp (June 2021).
We believe the asymmetry of spreads has even further tilted in favor of spread widening—while also offering attractive opportunities along the curve. When spreads (duration adjusted) are at this level or tighter, 77% of the time the Corporate Index sees negative excess returns. For the Long Corporate Index, it’s 100% of the time. It’s only 48% of the time for the Intermediate Index, and as such, we still favor building a yield advantage on the front end of the curve, while remaining underweight the long end which has been the beneficiary of the incredibly positive technicals elevated demand versus the lightest issuance since 2011. Technicals can be overpowering—until they’re not. We would suggest a reversal of these technicals in 2024 is one of the larger risks to valuations.
Additionally, we believe fundamentals are eroding, albeit slowly. Though one particular area of concern (and opportunity) that we would highlight is the potential for a meaningful increase of M&A. 2023 was the weakest year for dealmaking in the last decade, but December saw a bevy of acquisitions announced, and the Fed’s dovish pivot and the growing chorus of soft landing predictions will likely further boost the appetite for M&A activity. We believe this activity will likely come from the highest quality issuers with balance sheets that can support such deals, which is a cohort of the market that we are underweight but could look to take advantage of the often-times overly generous concessions on large M&A financings to add exposure to those issuers.
One area we anticipate fundamentals may improve (perhaps paradoxically given our view on credit) is in the lowest rung of credit quality amongst high grade issuers. We believe those issuers rated BBB- have the most incentive to retain or improve their credit ratings, and in many cases, credible paths to deleveraging. We believe this area of the market, even absent a broader rally in the credit, to likely be the most ripe for spread compression, and is accordingly where we have our largest overweight in select high conviction credit ideas.
One dynamic we clearly missed in 2023 was the outperformance from high yield. HY delivered a 13.5% return in 2023 (as did levered loans), with 2/3rds of that performance coming in the final 2+ months of the year. High yield spreads now sit in the bottom decile across most post-GFC time periods, which despite yield levels closer to historical averages still do not appropriately compensate investors for the impending maturity wall and the likelihood of elevated defaults. We would expect our utilization of this “plus” sector to remain light for those portfolios that allow for that exposure.
Timing remains the most challenging variable in the market, but the asymmetry is as great as we can recall. A bias to the front of the curve and the associated yield advantage we can build from that positioning, allows us the patience to wait for a correction in spreads. We allow that the worst case scenario for the economy looks far less likely than it did a year ago, but we also believe there to be far too much optimism priced into spreads. We believe a higher quality posture and healthy liquidity in the portfolio leave us well positioned to take advantageof a more appropriately valued credit market.
Endnotes
1 EPFR Global, Bank of America Merrill Lynch
2 Bloomberg
3 JP Morgan
Disclaimer
This material is intended solely for Institutional Investors, Qualified Investors and Professional Investors. This analysis is not intended for distribution with Retail Investors. This document has been prepared by MetLife Investment Management (“MIM”)1 solely for informational purposes and does not constitute a recommendation regarding any investments or the provision of any investment advice, or constitute or form part of any advertisement of, offer for sale or subscription of, solicitation or invitation of any offer or recommendation to purchase or subscribe for any securities or investment advisory services. The views expressed herein are solely those of MIM and do not necessarily reflect, nor are they necessarily consistent with, the views held by, or the forecasts utilized by, the entities within the MetLife enterprise that provide insurance products, annuities and employee benefit programs. The information and opinions presented or contained in this document are provided as of the date it was written. It should be understood that subsequent developments may materially affect the information contained in this document, which none of MIM, its affiliates, advisors or representatives are under an obligation to update, revise or affirm. It is not MIM’s intention to provide, and you may not rely on this document as providing, a recommendation with respect to any particular investment strategy or investment. Affiliates of MIM may perform services for, solicit business from, hold long or short positions in, or otherwise be interested in the investments (including derivatives) of any company mentioned herein. This document may contain forward-looking statements, as well as predictions, projections and forecasts of the economy or economic trends of the markets, which are not necessarily indicative of the future. Any or all forward-looking statements, as well as those included in any other material discussed at the presentation, may turn out to be wrong.
All investments involve risks including the potential for loss of principle and past performance does not guarantee similar future results. Property is a specialist sector that may be less liquid and produce more volatile performance than an investment in other investment sectors. The value of capital and income will fluctuate as property values and rental income rise and fall. The valuation of property is generally a matter of the valuers’ opinion rather than fact. The amount raised when a property is sold may be less than the valuation. Furthermore, certain investments in mortgages, real estate or non-publicly traded securities and private debt instruments have a limited number of potential purchasers and sellers. This factor may have the effect of limiting the availability of these investments for purchase and may also limit the ability to sell such investments at their fair market value in response to changes in the economy or the financial markets
In the U.S. this document is communicated by MetLife Investment Management, LLC (MIM, LLC), a U.S. Securities Exchange Commission registered investment adviser. MIM, LLC is a subsidiary of MetLife, Inc. and part of MetLife Investment Management. Registration with the SEC does not imply a certain level of skill or that the SEC has endorsed the investment advisor.
This document is being distributed by MetLife Investment Management Limited (“MIML”), authorised and regulated by the UK Financial Conduct Authority (FCA reference number 623761), registered address 1 Angel Lane, 8th Floor, London, EC4R 3AB, United Kingdom. This document is approved by MIML as a financial promotion for distribution in the UK. This document is only intended for, and may only be distributed to, investors in the UK and EEA who qualify as a “professional client” as defined under the Markets in Financial Instruments Directive (2014/65/EU), as implemented in the relevant EEA jurisdiction, and the retained EU law version of the same in the UK.
For investors in the Middle East: This document is directed at and intended for institutional investors (as such term is defined in the various jurisdictions) only. The recipient of this document acknowledges that (1) no regulator or governmental authority in the Gulf Cooperation Council (“GCC”) or the Middle East has reviewed or approved this document or the substance contained within it, (2) this document is not for general circulation in the GCC or the Middle East and is provided on a confidential basis to the addressee only, (3) MetLife Investment Management is not licensed or regulated by any regulatory or governmental authority in the Middle East or the GCC, and (4) this document does not constitute or form part of any investment advice or solicitation of investment products in the GCC or Middle East or in any jurisdiction in which the provision of investment advice or any solicitation would be unlawful under the securities laws of such jurisdiction (and this document is therefore not construed as such).
For investors in Japan: This document is being distributed by MetLife Asset Management Corp. (Japan) (“MAM”), 1-3 Kioicho, Chiyoda-ku, Tokyo 102-0094, Tokyo Garden Terrace KioiCho Kioi Tower 25F, a registered Financial Instruments Business Operator (“FIBO”) under the registration entry Director General of the Kanto Local Finance Bureau (FIBO) No. 2414, a regular member of the Japan Investment Advisers Association and the Type II Financial Instruments Firms Association of Japan. As fees to be borne by investors vary depending upon circumstances such as products, services, investment period and market conditions, the total amount nor the calculation methods cannot be disclosed in advance. Investors should obtain and read the prospectus and/or document set forth in Article 37-3 of Financial Instruments and Exchange Act carefully before making the investments.
For Investors in Hong Kong S.A.R.: This document is being issued by MetLife Investments Asia Limited (“MIAL”), a part of MIM, and it has not been reviewed by the Securities and Futures Commission of Hong Kong (“SFC”). MIAL is licensed by the Securities and Futures Commission for Type 1 (dealing in securities), Type 4 (advising on securities) and Type 9 (asset management) regulated activities.
For investors in Australia: This information is distributed by MIM LLC and is intended for “wholesale clients” as defined in section 761G of the Corporations Act 2001 (Cth) (the Act). MIM LLC exempt from the requirement to hold an Australian financial services license under the Act in respect of the financial services it provides to Australian clients. MIM LLC is regulated by the SEC under US law, which is different from Australian law.
MIMEL: For investors in the EEA, this document is being distributed by MetLife Investment Management Europe Limited (“MIMEL”), authorised and regulated by the Central Bank of Ireland (registered number: C451684), registered address 20 on Hatch, Lower Hatch Street, Dublin 2, Ireland. This document is approved by MIMEL as marketing communications for the purposes of the EU Directive 2014/65/EU on markets in financial instruments (“MiFID II”). Where MIMEL does not have an applicable cross-border licence, this document is only intended for, and may only be distributed on request to, investors in the EEA who qualify as a “professional client” as defined under MiFID II, as implemented in the relevant EEA jurisdiction. The investment strategies described herein are directly managed by delegate investment manager affiliates of MIMEL. Unless otherwise stated, none of the authors of this article, interviewees or referenced individuals are directly contracted with MIMEL or are regulated in Ireland. Unless otherwise stated, any industry awards referenced herein relate to the awards of affiliates of MIMEL and not to awards of MIMEL.
1 As of December 31, 2023, subsidiaries of MetLife, Inc. that provide investment management services to MetLife’s general account, separate accounts and/or unaffiliated/third party investors include Metropolitan Life Insurance Company, MetLife Investment Management, LLC, MetLife Investment Management Limited, MetLife Investments Limited, MetLife Investments Asia Limited, MetLife Latin America Asesorias e Inversiones Limitada, MetLife Asset Management Corp. (Japan), MIM I LLC, MetLife Investment Management Europe Limited, Affirmative Investment Management Partners Limited and Raven Capital Management LLC.