The front end of the corporate bond market outperformed the overall market as some of the most liquid pockets of the market like shorter maturity Financials, especially money center bank bonds, rallied with their spreads tightening meaningfully. Corporate bond issuance was strong in the back halves of both October and November as issuers capitalized on lowered benchmark yields, aforementioned reduced rate volatility and a return of market stability before quieting down in December with issuers moving to the sidelines dissuaded by the climb higher in Treasury yields in addition to characteristically diminished late-year investor appetite.
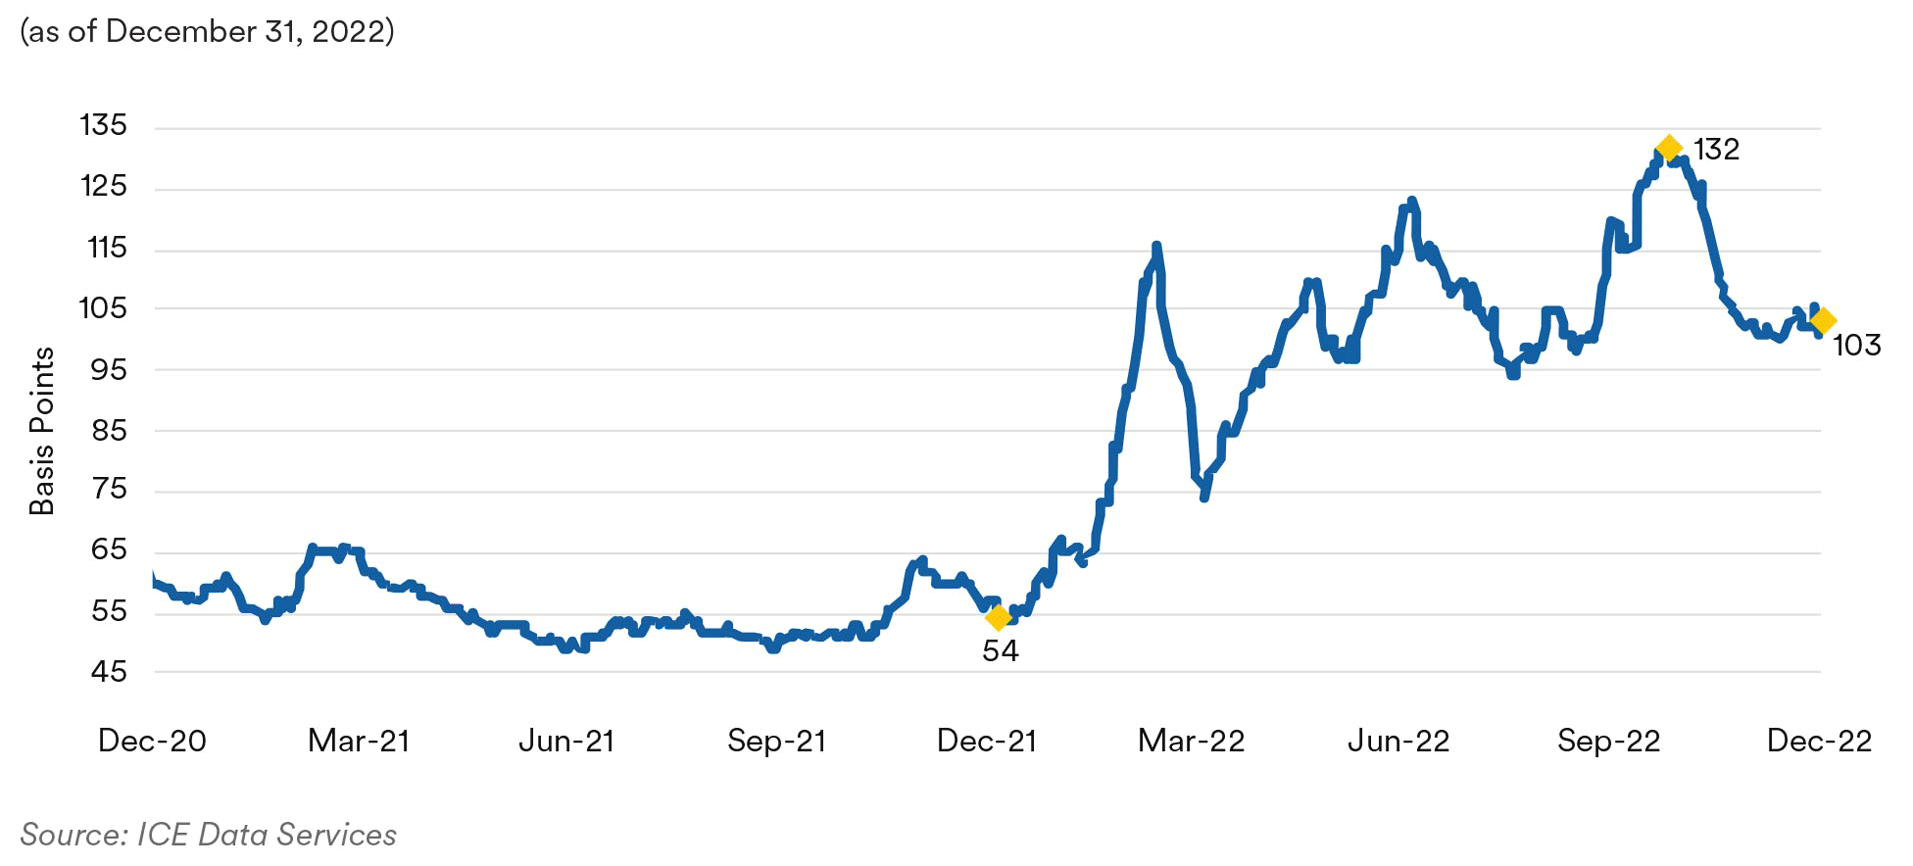
ICE BofA Corporate 1-5 Year Index
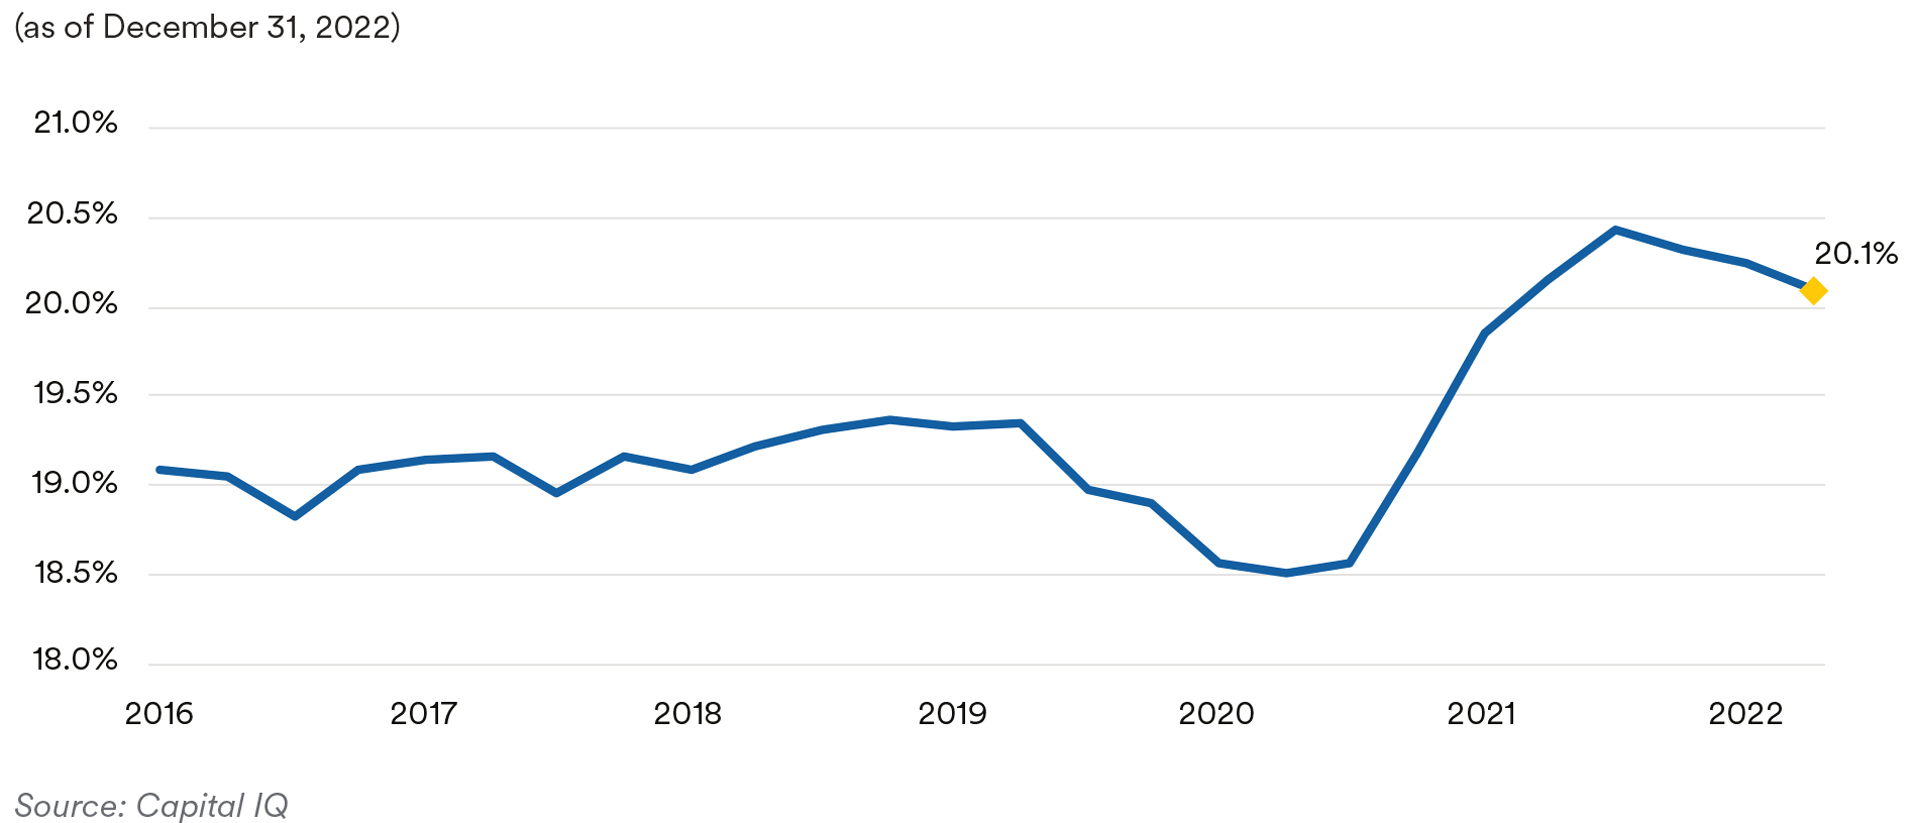
Third-quarter earnings reports, which trickled in throughout the fourth quarter, continued to evidence weakening fundamentals with corporate earnings and operating margins across a number of subsectors succumbing to the pressure of higher labor costs, input inflation and lingering supply chain bottlenecks as well as demand headwinds in certain pockets. For the S&P 500 index’s constituent companies excluding Energy sector members, third-quarter EPS was slightly negative, indicative of the increasing headwinds companies are facing. Another barometer of management teams seeing further pressure on margins and bottom lines from higher expenses and a potentially softening demand outlook lies in the growing number of layoff announcements companies have made over the past several months. Also of note, recent pertinent economic data like retail sales and consumer confidence do not paint a rosy picture and indicate to us that the U.S. consumer’s ability and willingness to drive economic growth is fading as Americans feel the squeeze from inflation and have drawn down a chunk of their excess savings built up during the pandemic. This has been somewhat mitigated by the substantial drop in gas prices from their mid-year highs.
Corporate Profit Margins
Portfolio Actions: Our bellwether front-end investment grade corporate index, the ICE BofA 1-5 Year U.S. Corporate Index, ended the fourth quarter at an option-adjusted spread (OAS) of 103 basis points, 17 basis points tighter compared to where the index started the quarter. As noted above, that is a bit deceiving with spreads widening in October before rallying to retrace all the widening and then some in November while finishing out the year with OAS unchanged in December. To be fair, November’s credit market rally caught us a bit by surprise given corporate fundamentals are showing increasing signs of deterioration and broadening weakness with earnings growth waning or turning negative for many companies. Coupling that with our view that a recession will develop later this year, albeit a short, shallow one is the market’s call, we would have expected spreads to resume their path higher as we had observed over 2022’s first two quarters and after the Fed’s September FOMC meeting helped prompt spreads to gap 20 basis points wider by the end of the third quarter. In the wake of scaling back on risk across strategies in the third quarter by in part reducing our sector weightings and spread durations in the investment grade corporate sector, we continued to trim our sector exposure and shave spread durations in the fourth quarter to raise our Treasury sector weightings and improve portfolios’ liquidity. Notably in our shorter-dated strategies, we sold some short maturity fixed-rate bonds and floaters to effect that shift. In the 1-3 year strategy portfolios, we swapped out of some fixed maturity securities and into roughly two-year duration money center bank TLAC callable bonds at meaningful spread pickups in October when spreads had widened. While our trading activity in the 1-3 year strategy portfolios was skewed to selling over the quarter, we also purchased a two-year financial sector AAA rated new issue at what we deemed to be an attractive spread.
Outlook: Looking ahead, at a high level we hold a cautious outlook on the investment grade credit sector. From a macro standpoint, we think the Fed’s path to tackling inflation and achieving its hoped-for soft landing is very narrow and foresee the U.S. likely entering a recession sometime in the next year even as they taper their pace of monetary policy tightening on the way to reaching their terminal rate. The lagged impact of the Fed’s already carried out rate hikes is destined to tighten financial conditions and almost assuredly weaken the labor market and consumer spending, the key driver of the U.S. economy. To the extent the market’s forecast of a short, mild recession or it being avoided altogether does not pan out, we could see a bumpier environment unfold and credit spreads push much wider from present levels. In fact, we assess the risk of credit spreads pushing significantly wider as much higher than currently appears to be priced in by investors, especially after the move lower off October’s recent highs.

Even with inflation seemingly having moved past its peak, additional Fed rate hikes in the hopper, tentative signs of a softening labor market and a darkening in the economic growth backdrop lay the groundwork for an even more challenging 2023 for the investment grade credit market as we begin the year. Given a backdrop more indicative of being late-cycle, we expect to maintain a lower credit sector weighting and reduced risk appetite, i.e. more defensive, up-in-quality positioning and reduced sector spread duration relative to our historical norms as we believe this posture will help guard against or limit the impact of wider spreads. In our view, the next few quarters ahead will require being nimble as we focus on security selection and avoiding credits less well-positioned in the face of a more challenging landscape. Specifically, we favor more defensive subsectors like Banking, Insurance, Communications, Consumer Non-cyclicals, and Electric Utilities. Selected companies in these subsectors generally benefit from some degree of pricing power and/or more resilient or inelastic demand and are better positioned to weather the rougher economic waters we foresee.
While overall credit metrics for investment-grade issuers like debt leverage have improved to pre-COVID levels, we expect to see further deterioration in operating results over coming quarters. We have seen initial signs that wage pressures may be easing, but many companies will continue to experience margin pressures, especially as economic growth slows. The housing sector and more recently the auto sector are two examples of industries clearly facing some problems, both hurt by the dramatic rise interest rates. While many companies may enter a possible recession from a position of strength in terms of their balance sheets relative to prior cycles, credit rating downgrades and an uptick in high-yield defaults that a recession inevitably brings, in addition to other unknowns that often surface like troubles in the bank loan market, for example, or other potential market unwinds, represent unforeseen shocks. At present, we also remain concerned about secondary bond market liquidity, which we saw erode in floating-rate corporate bonds over the year, reinforcing our desire to maintain exposure in more liquid subsectors and issues at this point in the cycle. Given where current valuations lie, we expect to be patient in waiting for the macro environment and underlying credit fundamentals to improve or credit spreads to widen to levels offering sufficient compensation for risk before we increase our risk appetite and look to boost our exposure in the investment grade credit sector.
Performance: The investment grade credit sector was a positive contributor to relative performance across strategies in the fourth quarter. As discussed, powered by November’s sharp move tighter in credit spreads, the OAS of our front-end benchmark, the 1-5 year U.S. corporate index, fell on a quarter-over-quarter basis, helping the index post its strongest excess return since fourth-quarter 2020. With Treasury yields drifting lower, reduced interest volatility and seasonally more favorable market technicals, the investment grade corporate bond market was able to close out a difficult year on a high note. Across our strategies, strongly performing investment grade credit subsectors driving positive excess returns included Banking, Insurance, Health Care, Midstream Energy, and Electric Utilities. Fourth-quarter weakness or slightly negative excess returns in the Banking subsector in our shorter-dated strategies stemmed from exposure to a Yankee bank whose bond spreads have been somewhat under pressure.
Treasuries / Agencies
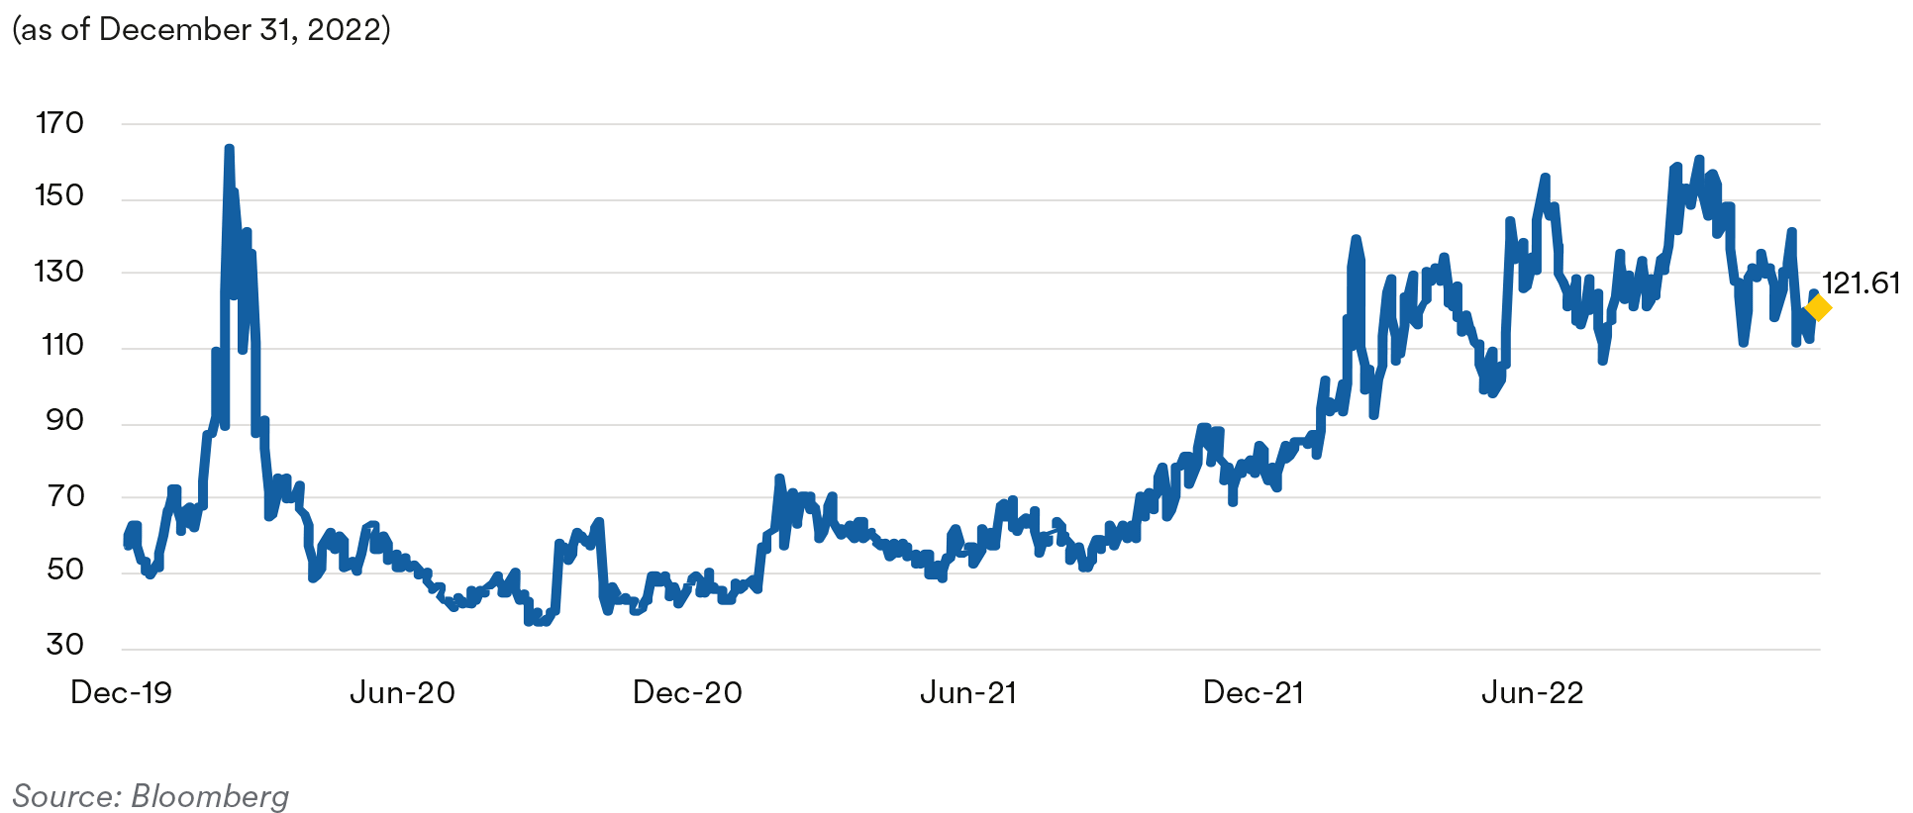
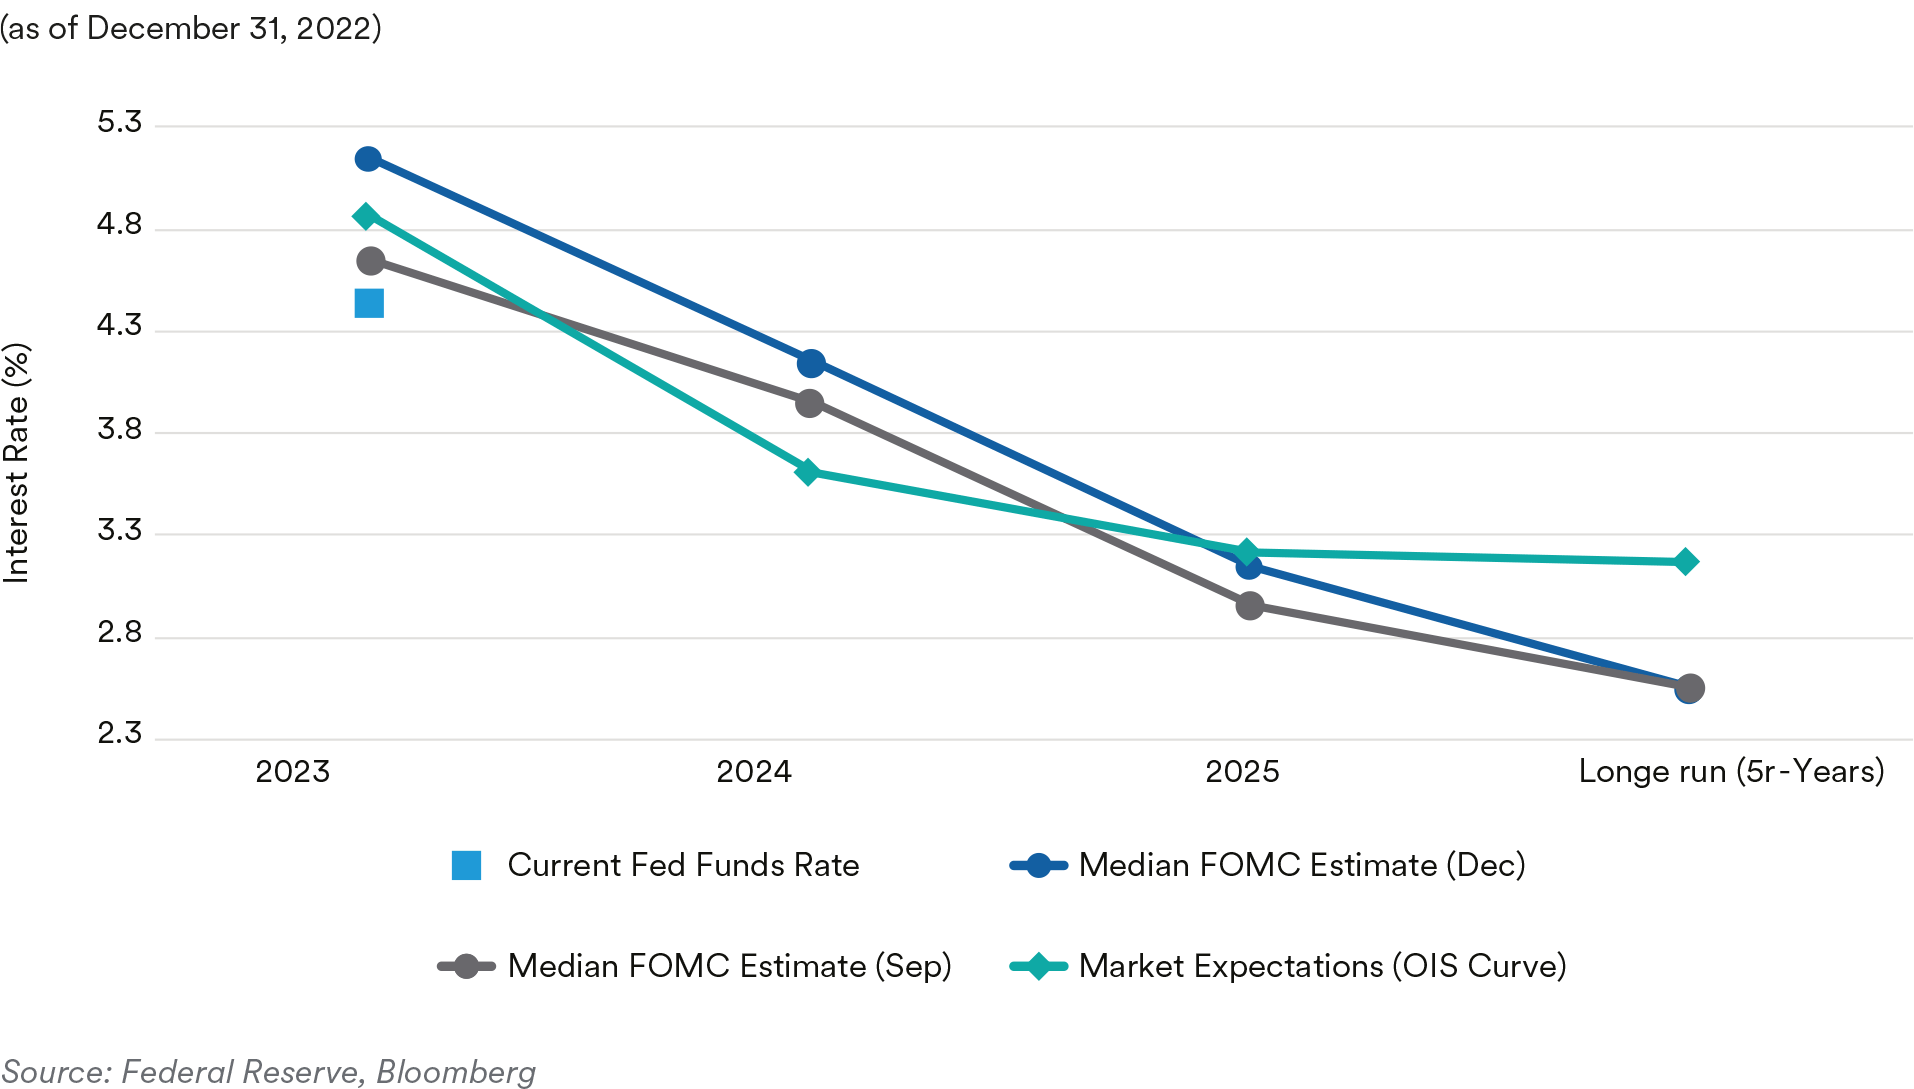
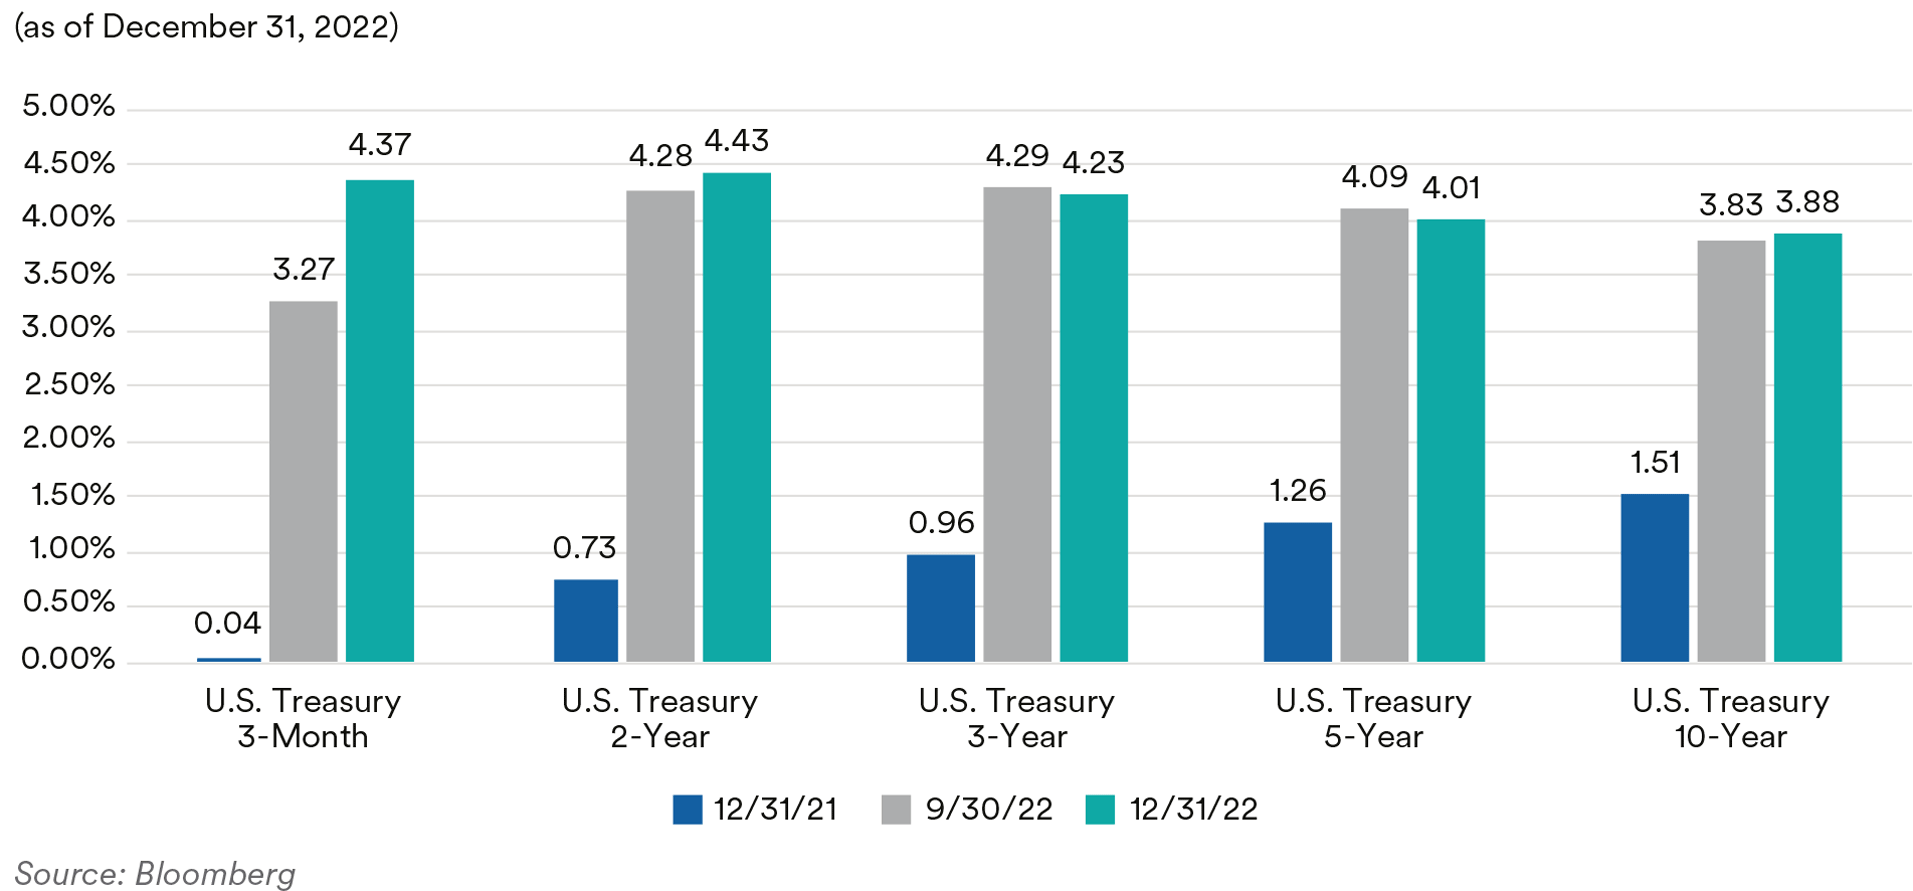
Recap: After peaking early in the quarter, Treasury rates spent the bulk of the fourth quarter moving lower as five-year yields reached 3.56% (after trading as high as 4.50%) and the ten-year yield reached 3.40% (after trading as high as 4.33%). A sharp selloff during the last two weeks of the year resulted in the five-year Treasury closing the year at 4.00% and the ten-year at 3.88%. The Fed delivered what the market was expecting with the final 75-basis point hike of the cycle in November, followed by a 50-basis point hike in December. The Summary of Economic Projections (SEP) from the December meeting showed FOMC members projecting a terminal rate of 5.125%. Market expectations that the Fed’s tightening cycle was coming to an end sometime in the first half of 2023 led to a decline in volatility for the first time in several quarters. Daily basis point moves being priced into the front end of the Treasury market moved from close to 11 basis points a day early in the quarter to under 9 basis points a day by the end of the quarter, a decrease but still over 70% higher than what we saw at the start of 2022. The decline in volatility did not help Treasury market liquidity much however, with dealers facing balance sheet constraints and investor activity waning into year end After continually repricing Fed hiking expectations since the start of 2022, the market for future fed-funds expectations finally started to stabilize in the fourth quarter, but the market continued to price in a terminal funds rate below the Fed’s target of 5.125%. We think the divergence will be reconciled with the market moving expectations higher towards the Fed’s SEP forecast. Although market expectations for the June 2023 fed-funds rate (peak fed-funds rate) started the quarter around 4.50%, however, since the end of October, that rate stabilized in the 5% area as the market focus shifted to when the next easing cycle would begin. The market is currently pricing rate cuts in the back end of 2023, not believing the Fed will be able to reach the terminal rate and then hold steady. We believe the memories of past Federal Reserve missteps will haunt the current Fed as they rue cutting prematurely.
The Merrill Lynch Option Volatility Estimate (MOVE) Index
Federal Reserve Dot Plot
The very front end of the market led the sell-off in the fourth quarter as short rates responded to the promise of more rate hikes to come. The three-month, six-month and one-year Treasury bill yields were 109 basis points, 85 basis points and 75 basis points higher during the quarter, respectively. Two-year Treasuries moved 15 basis points higher during the quarter, ending the year at 4.43%. Five-year Treasuries rallied 9 basis points in the quarter and ended the year at 4.00%. Ten-year Treasuries sold off slightly, moving 5 basis points higher during the quarter to end the year at 3.88% while the yield curve continued its flattening trend in the fourth quarter. The spread between the 10-year Treasury and the 2-year Treasury moved from -45 basis points at the start of the quarter to -55 basis points at the end of the year and traded as flat as -85 basis points. The spread between the five-year Treasury and three-month Treasury moved from +80 basis points at the start of the quarter to -40 basis points at the end of the year.
U.S. Treasury Yields
TIPS breakeven yields started the quarter moving higher, tracking the rise in nominal Treasury yields. However, after peaking in mid-October, a continued hawkish Fed combined with growing recession fears led to a decline in inflation breakeven rates in the latter half of the quarter, although breakevens still ended the quarter higher. Five-year TIPS breakeven rates went from 216 basis points at the beginning of the quarter to 238 basis points by the end of the quarter; 10-year TIPS moved from 215 basis points to 230 basis points in the same period. With TIPS breakeven rates moving higher, real yields (yield adjusted for inflation expectations) generally moved lower during the quarter. The five-year real yield started the quarter at 1.99% and ended the quarter at 1.65%while the 10-year real yield went from 1.67% to 1.58% during the same period.
Front-end Government-Sponsored Enterprise (GSE) agency spreads moved marginally wider over the fourth quarter as the option-adjusted spread (OAS) of the ICE BofA 1-5 Year U.S. Bullet (fixed maturity) Agency Index ended the quarter at 8 basis points, 4 basis points wider from the start of the quarter. In the SSA subsector, U.S. dollar-denominated fixed-maturity security spreads were mostly unchanged and finished the fourth quarter, on average, at 30 basis points over comparable-maturity Treasuries. Agency callable spreads continued to look attractive relative to Treasuries despite short-dated and short-expiry volatility in the upper left portion of the volatility surface falling from their recent peak in October. At the end of the quarter, we saw two- and three-year maturity callables with shorter call features of three months offer spreads over Treasuries of 90 and 125 basis points, respectively.
Portfolio actions: In the fourth quarter, we continued to increase the Treasury weights in our portfolios to historical highs as we sold down various spread product sectors. We opportunistically bought nominal Treasuries to add duration, targeting points on the curve with maturities of longer than one-year across our portfolios. As Agency callable spreads widened, we seized the opportunity to add to our callable positions across our shorter dated strategies over the quarter at what we believe to be attractive levels.
Outlook: As we start the new year, market expectations are for the Fed to tighten monetary policy through the middle of the year and then start to slowly cut rates in the latter half of the year. As we touched on earlier, we believe the market is a bit too optimistic as to when the Fed will cut rates. While we may be within six months of the last rate hike of the cycle, we anticipate the FOMC will need to continuously message to the market that the fed-funds rate will remain elevated through the remainder of 2023.
We believe front-end rates, specifically the one-year and shorter part of the curve will remain elevated throughout this year. We also see different points of the yield curve trading in defined technical ranges and expect the curve will remain inverted. Although we may have seen the highs in volatility, we believe it will remain elevated and callable Agencies will continue to be attractive. Looking ahead, in SSAs, we expect approximately $230 billion of gross supply in 2023 based on the expectation of higher funding needs from a few major issuers, coupled with an increasing share of dollar issuance as anticipation of USD funding conditions ease and make it more attractive for issuers to fund in dollars. As we look at the seasonal factors, most of the SSA supply will come in the first half of the year. From a duration standpoint, the market seems fairly priced now with no strong bias towards higher or lower yields, but we will continue to look for attractive entry points if technical levels are reached to add more duration to our portfolios.

Given the recent spectacle that played out in the House of Representatives in terms of the prolonged selection process for its next Speaker, and what it may portend for a Republicancontrolled House, a heightened focus has been placed on the federal debt limit. We think the outcome of the House Speaker election will influence the internal GOP dynamics going forward, particularly the power ceded to some of the GOP’s fiscal conservatives, and may essentially impact the debt limit negotiations which were already setting up to be contentious. We see the Treasury deploying its “extraordinary measures” by the end of February as we expect the Treasury would be back up against the statutory debt limit around that time. There is some uncertainty about the “x-date” (the date the Treasury runs out of cash on hand, unable to raise new funds via public debt issuance, and is unable to meet all of its financial obligations), however, the extraordinary measures should help the Treasury make payments until at least October. Although we think the debt ceiling issue will ultimately be resolved, it will not be without chaotic developments as some members of Congress might see an advantage in aligning the debt-ceiling and government-shutdown deadlines to produce maximum leverage for their agendas.
Performance: Our slightly short to neutral duration posture was additive to excess returns in our 1-3 year and 1-5 year strategies but detracted from performance in our shorter and intermediate strategies. On the other hand, our barbell-biased yield curve positioning relative to benchmark indices was a positive contributor across all portfolios. We note that the performance from our yield curve strategy more than offset the underperformance from duration in our shorter and intermediate strategies. The Agency sector saw modestly negative excess returns as front-end rates rose and extended the duration of our callable positions.
ABS
Recap: Pressured by concerns about the impact of inflation on the consumer, emerging signs of stress in the labor market and a hawkish Fed, spreads on short-tenor ABS tranches, with the exception of credit card tranches, moved wider over the fourth quarter. Spreads on two-year, fixed-rate AAA-rated prime and subprime auto tranches ended the quarter at 86 basis points and 117 basis points over Treasuries, respectively. Three-year, floating-rate FFELP student loan tranches were also wider, ending the quarter at 175 basis points above SOFR, 73 basis points wider. Credit card tranches, in contrast, were tighter. Two-year, fixed-rate AAA-rated credit cards ended the quarter at a spread of 46 basis points over Treasuries, 6 basis points tighter. We attribute the outperformance of credit cards to investors’ preference for the most liquid, high-quality investments as they headed into year-end in an environment of uncertainty. Notably, all of the tightening in credit card spreads occurred in December as two-year credit cards stood at a spread of 72 basis points over Treasuries at the end of November, 20 basis points wider than the start of the quarter. In fact, December was kind to all short-tenor ABS tranches with spreads tightening across all the benchmark subsectors. Fourth-quarter ABS new issue volume was muted with only $47 billion of new deals coming to market, a decline of 15% compared to the $56 billion seen in the third quarter and down 16% relative to last year which saw $63 billion of new issue deals. As usual, the auto subsector was the largest contributor to new supply, with almost $20 billion of new deals coming to market. This was followed by $11 billion of issuance in the “other ABS” subsector (a catch-all category that includes deals collateralized by cell phone payment plans, timeshares, mortgage servicer advances, insurance premiums, aircraft leases, etc.) and $7 billion of new credit card issuance.
Credit card trust performance metrics continued to show signs of deterioration over the fourth quarter. Data from JP Morgan credit card performance indices reflecting the December remittance reporting period showed charge-offs and 60+-day delinquencies on bank credit card master trusts rising 11 basis points and 7 basis points respectively, to 1.16% and 0.64%, over the quarter. However, despite the increase the indices continue to see charge-offs and delinquencies remain well below historical norms. We expect to see continued deterioration in credit card performance metrics going forward, however, as rising unemployment, dwindling savings, higher interest rates and persistent inflation impact consumers. Despite these headwinds we do not foresee a material impact on our credit card holdings due to their robust levels of credit enhancement. In addition, we believe that ABS credit card trusts are likely to perform better than broader credit card portfolios due to their significantly more seasoned accounts. For example, the charge-off rate for commercial bank credit card portfolios was 2.20% in the third quarter, compared to 1.05% for bank credit card master trusts.
The most recent Fed Senior Loan Officer Opinion Survey, reflecting sentiment as of October 2022, showed banks reporting tighter lending standards for credit cards and other consumer loans, while auto loan standards were unchanged. A moderate share of banks reported stronger demand for credit card loans, while a significant share reported weaker demand for auto loans. Demand for other consumer loans was unchanged. The survey included a set of special questions asking banks the likelihood of approving credit card and auto loan applications by borrower FICO score in comparison to the beginning of the year. A significant share of banks reported they were less likely to approve both for borrowers with FICO scores of 620 and a moderate share of banks reported they were less likely to approve credit card and auto loan applications for borrowers with FICO scores of 680. In our view, the banks’ responses support our thesis that lower income consumers are more likely to face greater challenges from rising rates, inflation and a slowing economy than those with higher incomes.
After rebounding in October, new vehicle sales declined later in the quarter to end the year at a 13.3 million SAAR (seasonally-adjusted annualized rate) as high vehicle prices and rising borrowing costs pushed consumers to cut back on spending. Despite the late-quarter decline, the current sales pace is 7% higher than at the end of 2021 year as semiconductor-related supply chain bottlenecks appear to be easing and more inventory is becoming available on dealer lots. While current sales are above the 2022 lows of 12.7 million SAAR seen in May, they are still well below the post-financial crisis high of 18.5 million SAAR seen in April last year and the 16 million average sales pace of the last decade. Used car prices, as measured by the Manheim Used Vehicle Index, were relatively stable over the fourth quarter after declining for most of the year. The index closed the year at 202.6, down 14.2% for the year. For the quarter, the index was down only 0.01%. Manheim noted that all eight major market segments saw lower year-over-year prices with sports cars showing the smallest decrease (down only 10.7%).
Manheim Used Vehicle Index & Fitch Auto Loan 60+ Delinquency Subprime Index
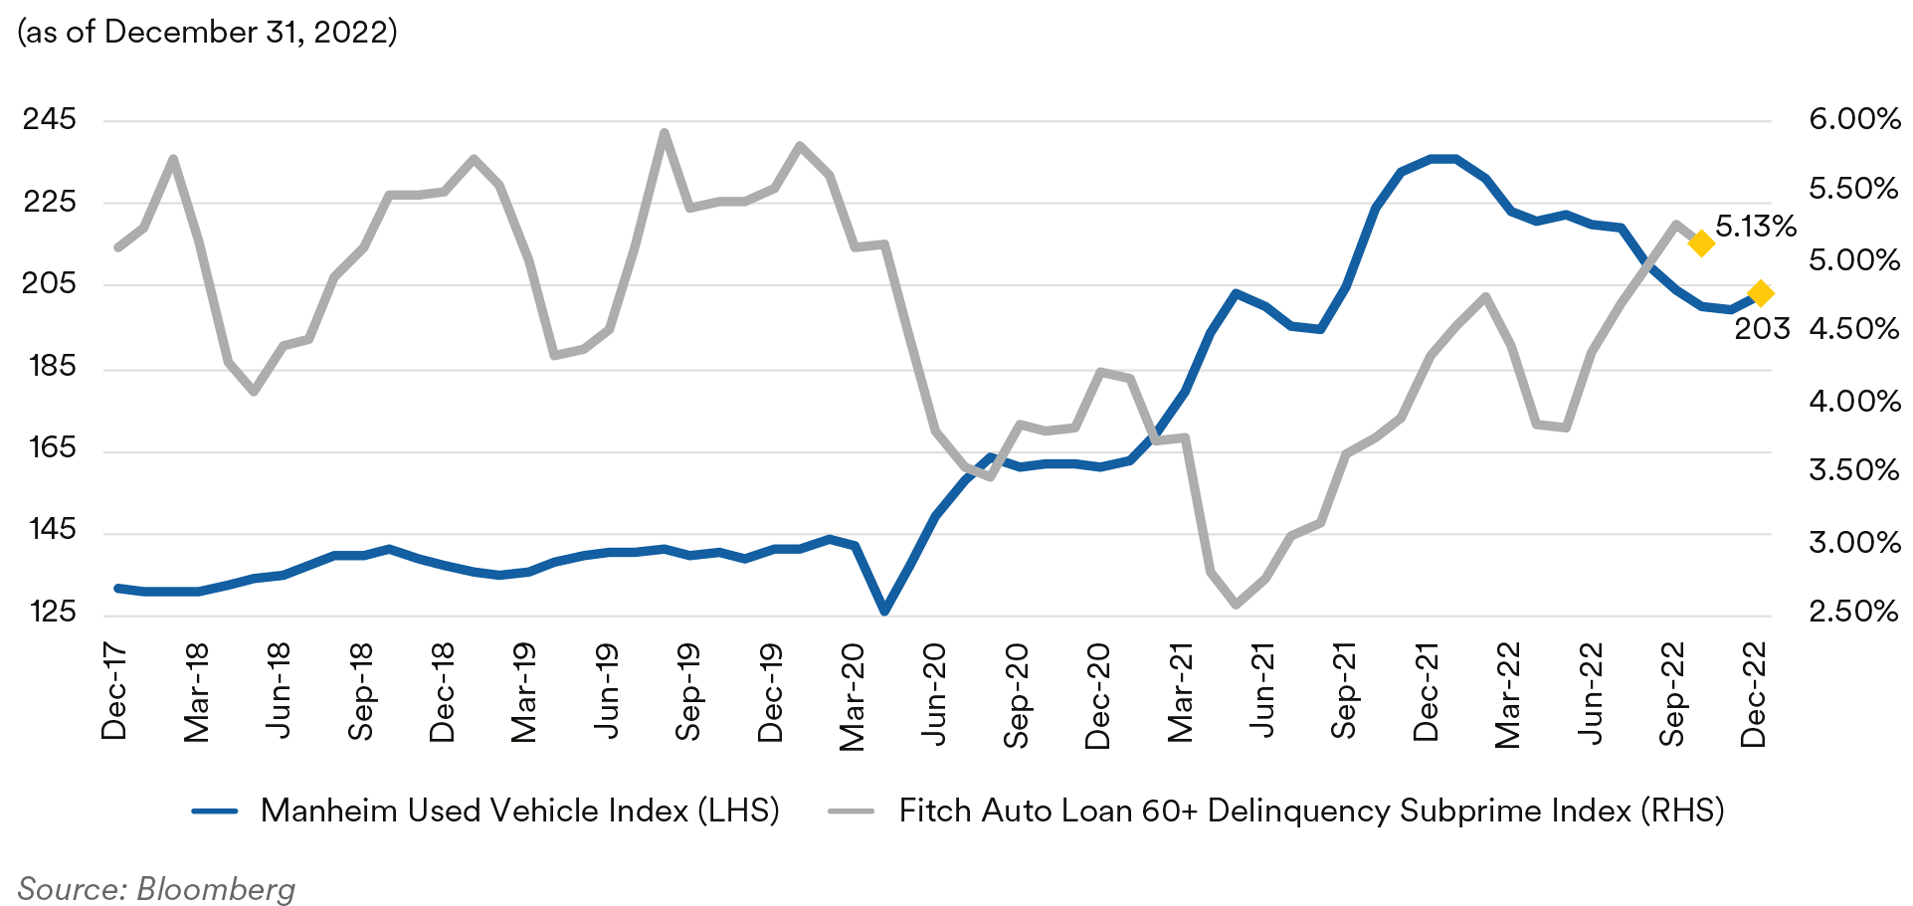
Continuing the trend we described in our third-quarter commentary, lower used car prices, combined with rising inflation and higher interest rates, have resulted in worsening performance metrics for auto ABS tranches. As of October’s data, the 60+-day delinquency rates on the Fitch Auto ABS indices were 0.23% for the prime index and 5.13% for the subprime index, levels that have increased 5 basis points and 137 basis points, respectively, when compared to prior year’s numbers. Likewise, annualized net loss rates for the indices stand at 0.25% for the prime index and 7.38% for the subprime index, reflecting year-over-year increases of 17 basis points and 318 basis points, respectively. In our view, the difference in the performance of prime and subprime tranches indicates that prime borrowers are better positioned to confront currently deteriorating economic conditions than subprime borrowers. As we have noted in the past, we are comfortable with our holdings of AAA and AA-rated auto tranches as we believe these deals have sufficient credit enhancement to protect senior bondholders despite the downturn in credit metrics.
Portfolio Actions: Over the course of the fourth quarter, we continued to maintain or modestly reduce ABS exposure across all of our strategies. We have generally scaled back our exposure to subprime auto tranches while increasing our exposure to prime auto and credit card tranches. This has been implemented by allowing our subprime holdings to pay down and reinvesting the proceeds elsewhere rather than actively selling our subprime auto holdings. As we are still seeking to avoid adding spread duration in the current environment, we continued to favor short-tenor prime auto and credit card tranches. In the new issue market we purchased several front-pay “A1” tranches for our shorter strategies and three-year credit card tranches for our longer strategies. For example, early in the quarter, we purchased a new issue, three-year AAA-rated credit card tranche at a spread of 71 basis points over Treasuries. Later in the quarter we purchased a one-year, AArated tranche of credit-risk transfer deal referencing a pool of prime auto collateral at a spread of 190 basis points over Treasuries.
Outlook: We continue to believe that the current environment of rising interest rates, falling home prices, higher inflation and worsening labor market trends portends a near-term recession which will present challenges for consumers. Accordingly, we expect to continue our current strategy of favoring defensive, liquid ABS tranches. At current spreads, we expect to modestly increase our ABS exposure across our shorter strategies while maintaining our exposure in our longer strategies. For the shorter strategies, we believe that short-tenor auto tranches still offer value compared to alternatives. We are biased to favor prime tranches over subprime but are comfortable adding very short subprime exposure to deals from a selective group of issuers that have a demonstrated history of operating through multiple credit cycles. Given the recent tightening in credit card spreads, we do not expect to materially increase our exposure in that subsector and may look to utilize our credit card holdings as a possible funding source should we find alternatives that offer more attractive risk-adjusted returns, whether in ABS or other spread sectors. However, we still find value in Canadian credit cards, which trade at a discount to domestic U.S. card programs so we may opportunistically look to increase our exposure to Canadian credit cards. At current spreads, we are content to maintain our current exposure to more spread duration-sensitive sectors like private student loans. Likewise, given our economic outlook, we do not expect to increase our exposure to CLOs.
Performance: Our ABS holdings produced negative excess returns for the quarter across all of our strategies after adjusting for their duration and yield curve exposures. Our auto ABS tranches were the main culprit owing to wider benchmark spreads in that subsector. However, performance was relatively worse in our longer strategies due to a higher exposure to private student loan tranches which also saw wider spreads. Our credit card positions were flat in our shorter strategies and positive in our longer strategies where newly purchased two to three-year positions benefitted from spread tightening. Our CLO holdings were positive contributors across all strategies, with the exception of our 1-5 year strategy. Where we had reduced our CLO exposure earlier in 2022, in connection with our desire to exit floating-rate positions and add duration to the strategy.
CMBS
Recap: Compared to like-duration Treasuries, spreads on short-tenor CMBS tranches ended the fourth quarter mixed with conduit tranches moving wider and agency tranches tighter. We attribute the disparity to bank buying of agency CMBS tranches. As higher interest rates caused their MBS portfolios to extend in duration, banks found agency CMBS an attractive alternative investment given their regulatory capital requirements. In addition to this bank sponsorship, given the uncertain outlook for the office, retail and lodging properties found within conduit deals, many CMBS investors find the stable cashflow profiles and enhanced liquidity of multifamily backed agency tranches appealing. We count ourselves among this group as we added agency CMBS exposure across most of our strategies in the fourth quarter. At the end of the quarter, spreads on three-year AAA-rated conduit tranches stood at 125 basis points over Treasuries, 14 basis points wider and spreads on fiveyear AAA-rated conduit tranches stood at 128 basis points over Treasuries, six basis points wider. While spreads on three-year Freddie Mac “K-bond” agency CMBS tranches ended the quarter at 27 basis points over Treasuries, seven basis points tighter. Over the course of the year, spreads on three and five-year conduit tranches widened 75 basis points and 64 basis points, respectively, while spreads on three-year K-bond tranches moved three basis points tighter. With interest rates moving sharply higher this year, only $38 billion of new issue CMBS came to market in the fourth quarter, a decline of 64% when compared to 2021’s $106 billion of new issuance. Continuing the trend seen in the third quarter, the largest portion of the decline was seen in the non-agency sector which had $9 billion of new issuance in the fourth quarter, compared to $55 billion in the fourth quarter of 2021, a decline of over 83%. In comparison, agency CMBS declined only 43% compared to last year with $29 billion of new agency deals pricing in the fourth quarter, compared to $51 billion last year.

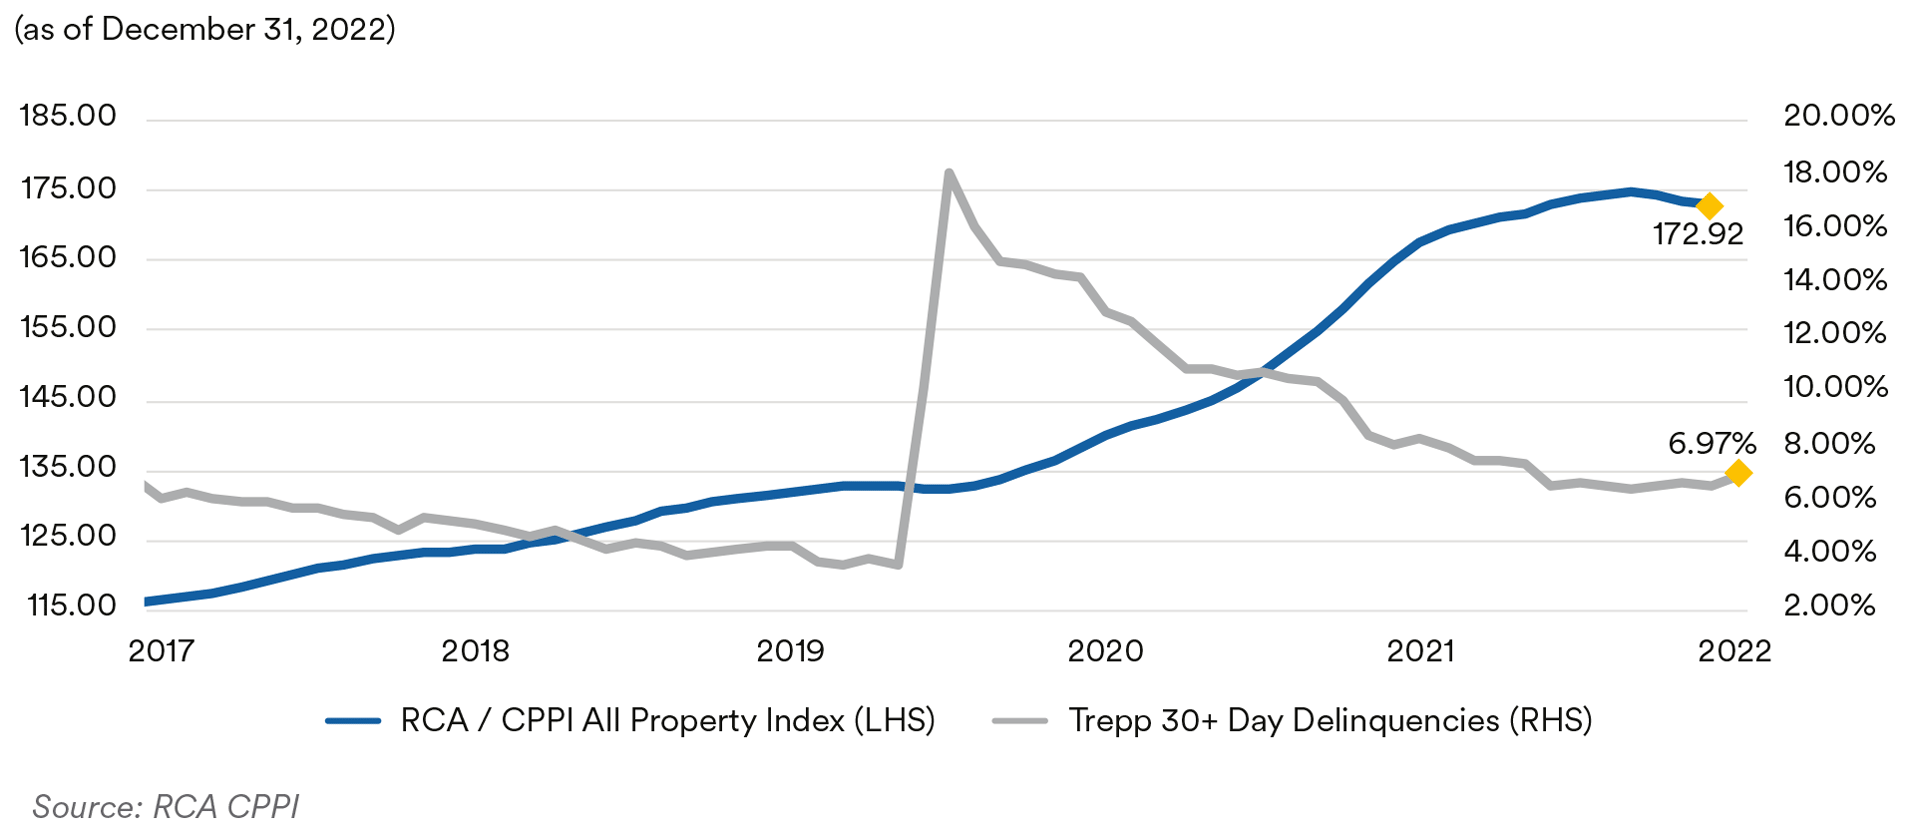
CMBS delinquencies edged up slightly over the quarter as the commercial real estate market adjusted to higher interest rates and a slowing economy. As measured by the Trepp 30+-day delinquency rate, CMBS delinquencies ended the year at 3.04%, an increase of 12 basis points for the quarter but a decline of 153 basis points year-over-year. Trepp noted that the uptick saw delinquencies exceed 3% for the first time since July and after reaching a post-COVID trough of 2.92% in September, delinquencies have inched up for the last three months. The all-time high for delinquencies was 10.34% registered in July 2012 and the COVID high was 10.32% in June 2020.
Commercial property prices appear to finally be feeling the impact of rising interest rates. The December release of the RCA CPPI National All-Property Composite Index showed prices fell 0.4% in November to 172.9 and the annualized growth rate slowed to 4.9%, the slowest pace seen in over two years. Apartment prices showed the greatest price decline in November, dropping 1.1% for the month which moved the annualized growth rate for apartment properties down to 7.4%, the first below double-digit growth rate seen for that subsector since early 2021. Industrial properties remained the best performer with an annualized growth rate of 14.4%. Office properties rose 0.2% in November and now stand at a 5.1% year-over-year growth rate, well below the 12.7% rate seen at the start of the year. Central business district (“CBD”) offices underperformed the broader office sector, with CBD prices up only 1.8% annually. In contrast, suburban office properties have risen 5.9% year-over-year. Prices in the six Major Metros (Boston, Chicago, Los Angeles, New York, San Francisco and Washington, D.C.) recorded the lowest growth rate since 2010, up only 0.7% yearover-year. RCA noted that on a monthly basis, Major Metro commercial property prices have fallen for five months in a row.
RCA / CPPI All Property Index & Trepp 30+ Day Delinquencies
The current Fed Senior Loan Officer Opinion Survey, reflecting sentiment as of October, showed that banks reported tightening standards on construction and land development loans as well as nonfarm nonresidential loans. A significant share of banks reported tightening standards on loans secured by multifamily properties and reported weaker demand for CRE loans of all types.
Portfolio Actions: During the quarter we maintained or slightly increased our exposure to CMBS across all of our strategies. Our activity was limited to the secondary market as we did not participate in any new issue CMBS deals in the fourth quarter. As noted above, we added agency CMBS tranches to most of our portfolios. The increase in agency CMBS reflects our broader overall strategy of enhancing the liquidity profile and defensiveness of portfolios in expectation of worsening economic conditions going forward. As in the third quarter, we did not add to our floating-rate single asset, single borrower non-agency holdings as we are reluctant to add spread duration given our forward outlook. However, we continued to add to our fixed-rate conduit scheduled balance “ASB” tranches with small secondary market purchases. As we believe ASB tranches are defensive and offer fairly stable average life profiles across a broad range of collateral prepayment and default scenarios.
Outlook: We expect to continue with our current strategy for the foreseeable future. Accordingly, we do not expect to materially alter our overall CMBS exposure across our portfolios. However, with agency CMBS spreads at current levels due to the heavy bank sponsorship mentioned above, we may look to rotate out of some of our agency holdings into non-agency conduit alternatives. In particular, we still find ASB tranches appealing. Given our outlook for rates and the economy, we anticipate continued challenges for retail, lodging and office properties as loans reach their maturity dates. Going forward, we expect to see widespread loan modifications and workouts with borrowers injecting equity into better quality properties. For more troubled properties, based on precedents from the Great Financial Crisis, we expect servicers to provide borrowers with concessions including term extension, lower interest rates or even restructuring the loan into an A/B structure in which the current loan is split into two parts, an “A” loan which the property’s net operating income can support and a more speculative “B” note which hopefully gets paid off at maturity when financial conditions are presumed to have improved.
Performance: Our CMBS positions posted positive performance across all of our strategies in the fourth quarter after adjusting for duration and yield curve positioning.
RMBS
Recap: Residential mortgage-backed securities generally saw positive performance over the course of the fourth quarter as spreads retraced some of the widening seen earlier in the year and mortgage rates retreated from their highs. In fact, November saw the best returns for mortgages all year with the Bloomberg mortgage index posting a 1.35% monthly excess return, partially recovering from the -1.91% monthly excess return posted in September which was the worst on record. Overall, generic 30-year collateral ended the quarter at a spread of 151 basis points over ten-year Treasuries,33 basis points tighter, while 15-year collateral ended the quarter at a spread of 70 basis points over five-year Treasuries,18 basis points wider. We attribute the relative outperformance of longer collateral this quarter to the fact that 30-year mortgages had weakened considerably earlier in the year. As we noted in last quarter’s commentary, investors have generally preferred shorter tenor collateral in the recent rising interest rate environment, while fear of sales from the Fed’s MBS portfolio has weighed on 30-year mortgages which comprise the vast majority (~88%) of the portfolio. Non-agency spreads were weaker, with prime jumbo front cashflow tranches ending the quarter at a spread of 200 basis points over Treasuries, 60 basis points wider. Notably, however, all of this widening occurred in October and non-agency spreads have stabilized since then.

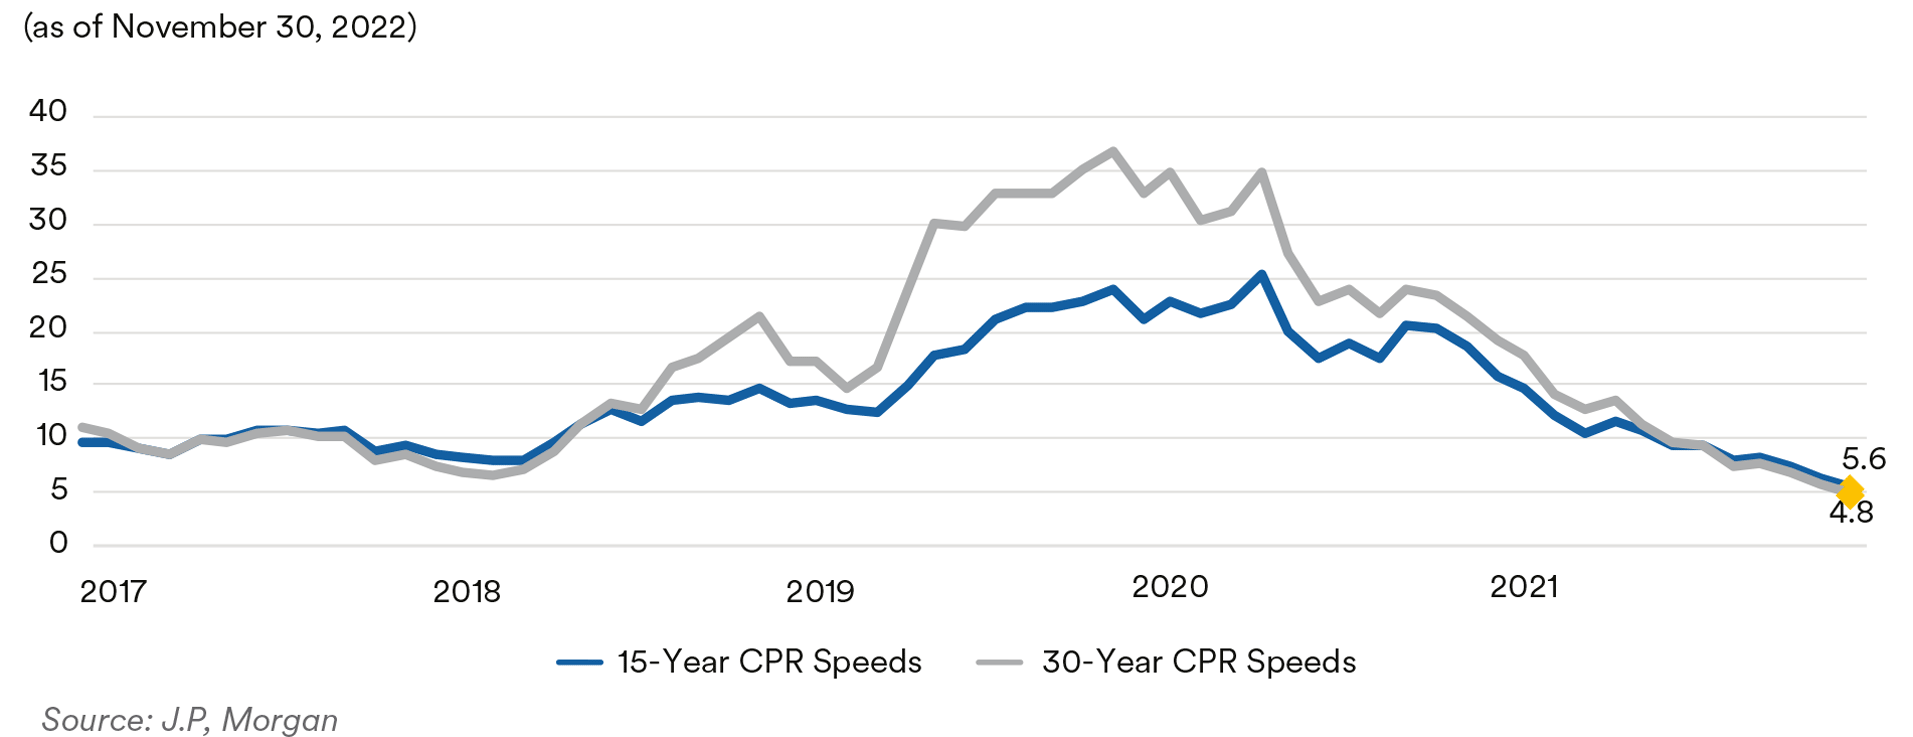
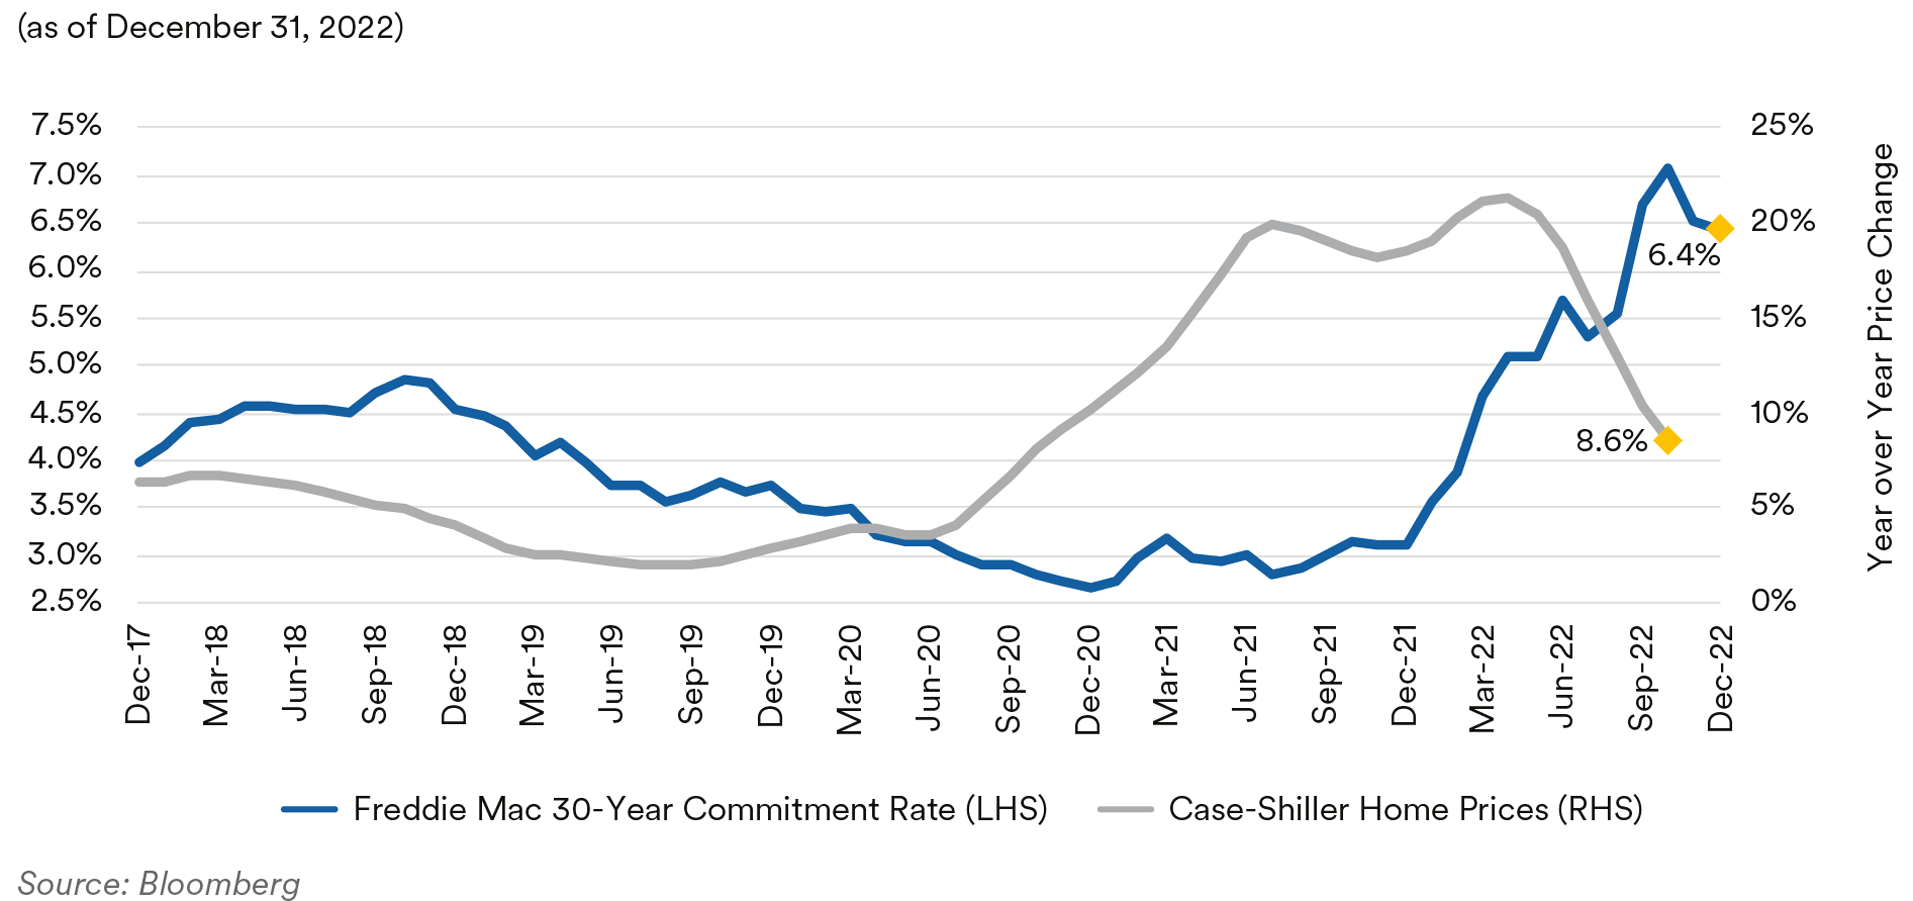
Mortgage rates drifted lower over the quarter, after ending the third quarter at levels not seen since 2007. The Freddie Mac 30-year mortgage commitment rate fell 29 basis points over the quarter to 6.41%. Despite this retracement, most mortgages still remain outside of the refinancing window and prepayment speeds continue to move lower. December’s prepayment report showed 30-year Fannie Mae mortgages paying at 4.8 CPR in November, a 16% slowdown relative to October’s 6.8 CPR print. Thirty-year prepayments have been flat or fallen each month since March in response to rising interest rates. Fifteen-year mortgage prepayments fell 13% to 5.6 CPR from 6.4 CPR in October. The current mid-6% rates are creating affordability challenges for homebuyers which is being reflected in housing prices. The December release of the S&P CoreLogic CaseShiller 20-City Home Price Index showed home prices fell 0.8% in October, a fourth straight monthly drop, with all twenty cities posting monthly price declines. On an annualized basis, prices have risen 8.6% year-over-year through October, although it was the sixth straight month of decelerating price gains for the index. On a national level, Case-Shiller’s data showed home prices fell for the fourth straight month and are now up only 9.2% year-over-year, well behind the almost 21% annualized growth rate seen in the spring. In our view, with mortgage rates higher and the labor market showing signs of slowing, lower home prices are a necessary condition to restore housing affordability which remains stretched as housing costs, relative to income, remains well above historic averages.
One Month CPR Prepayment Speeds for 15yr and 30yr Fannie Mae Mortgage Pools
Higher mortgage rates and their attendant affordability dynamics continue to weigh on home sales numbers. November’s data showed U.S. existing home sales have now fallen for a record ten straight months to a 4.1 million annualized pace, the weakest level seen since 2010, excluding the pandemic-related slump in 2020. The supply of homes for sale also dropped to 1.14 million homes, the fourth straight month of declining inventory levels. At the current sales pace it would take only 3.3 months to sell all the homes on the market. New home sales in November increased for a second straight month to a 640,000 annualized pace which was above economists’ estimates of 600,000. New home sales account for about 10% of the market and are counted when contracts are signed. They are considered a timelier barometer of market sentiment than existing home sales, which are registered at closing. Despite the uptick in new home sales, home builder sentiment continues to decline with the National Association of Home Builders sentiment index falling for the ninth straight month in December to 31. Ignoring the impact of the Covid-19 pandemic, that level is the lowest since June 2012 and the uninterrupted slide in sentiment this year is the longest series of declines on record. Builders are struggling with rising labor and materials costs and falling buyer demand due to rising mortgage rates. Builders continue to use incentives like mortgage rate buydowns, free amenities and price reductions to bolster sales numbers.
Case-Shiller Home Prices & Freddie Mac 30-Year Mortgage Commitment Rate
The current release of the Fed Senior Loan Officer Survey, reflecting sentiment as of October, showed banks generally maintaining their current lending standards for most residential real estate loans, with some banks reporting tighter standards for subprime and jumbo loans and HELOCs. Banks reported weaker demand for all residential real estate loans except for HELOCs which saw a moderate share of banks reporting increased demand. As part of a set of special questions in the survey, banks were asked how they expected their lending standards to change in the event of a recession in the next 12 months. A majority reported that they would continue to tighten residential lending standards.
Portfolio Actions: Over the course of the fourth quarter we generally maintained our RMBS exposure across most strategies. The exception was in our 1-3 year strategy where we modestly adjusted our RMBS exposure with the purchase of some seasoned 15-year specified pools.
Outlook: Going forward, we expect to maintain our current, historically low, RMBS allocation across all of our strategies. As noted above, affordability challenges for borrowers are pushing housing prices lower while elevated mortgage rates are constraining prepayments. Accordingly, we expect mortgages to remain longer duration assets. With this dynamic, at current spreads we are content to maintain our relatively low level of exposure. In addition, while we believe that the Fed is unlikely to sell MBS from its portfolio in 2023, we recognize the potential for spread widening should such sales, or even rumors of such sales, appear. Within specified pools, we still find seasoning attractive as curtailments, borrowers making slightly larger than required payments, become more impactful as pools age which should provide some support to baseline speeds, particularly in 15-year pools. On a relative value basis, seasoned 20-year pools, which are deliverable into the 30-year TBA market, offer an attractive spread pickup relative to some 15-year specified pools and we opportunistically examine the merits of swapping some of our existing 15-year specified holdings into seasoned 20- year pools. Within non-agencies, current spreads on senior AAA-rated short tenor tranches do not seem particularly compelling for non-QM and jumbo tranches. We prefer seasoned non-performing/ reperforming (“NPL/RPL”) pools which provide higher base case prepayment speeds due to more elevated defaults as the principal recovered from the sale of defaulted collateral gets returned to trusts as prepayments. We are inclined to add modestly to our NPL/RPL exposure should we see attractive bonds offered in the secondary market.
Performance: Our RMBS positions showed negative performance in the fourth quarter after adjusting for their duration and yield curve exposure. The weakness was led by our non-agency holdings which, as noted above, widened in spread in October and subsequently stabilized. Our agency CMO positions were also slightly negative. Our best performers were our 15-year seasoned specified pools which benefitted from tighter benchmark spreads and posted positive performance across all strategies.
Municipals
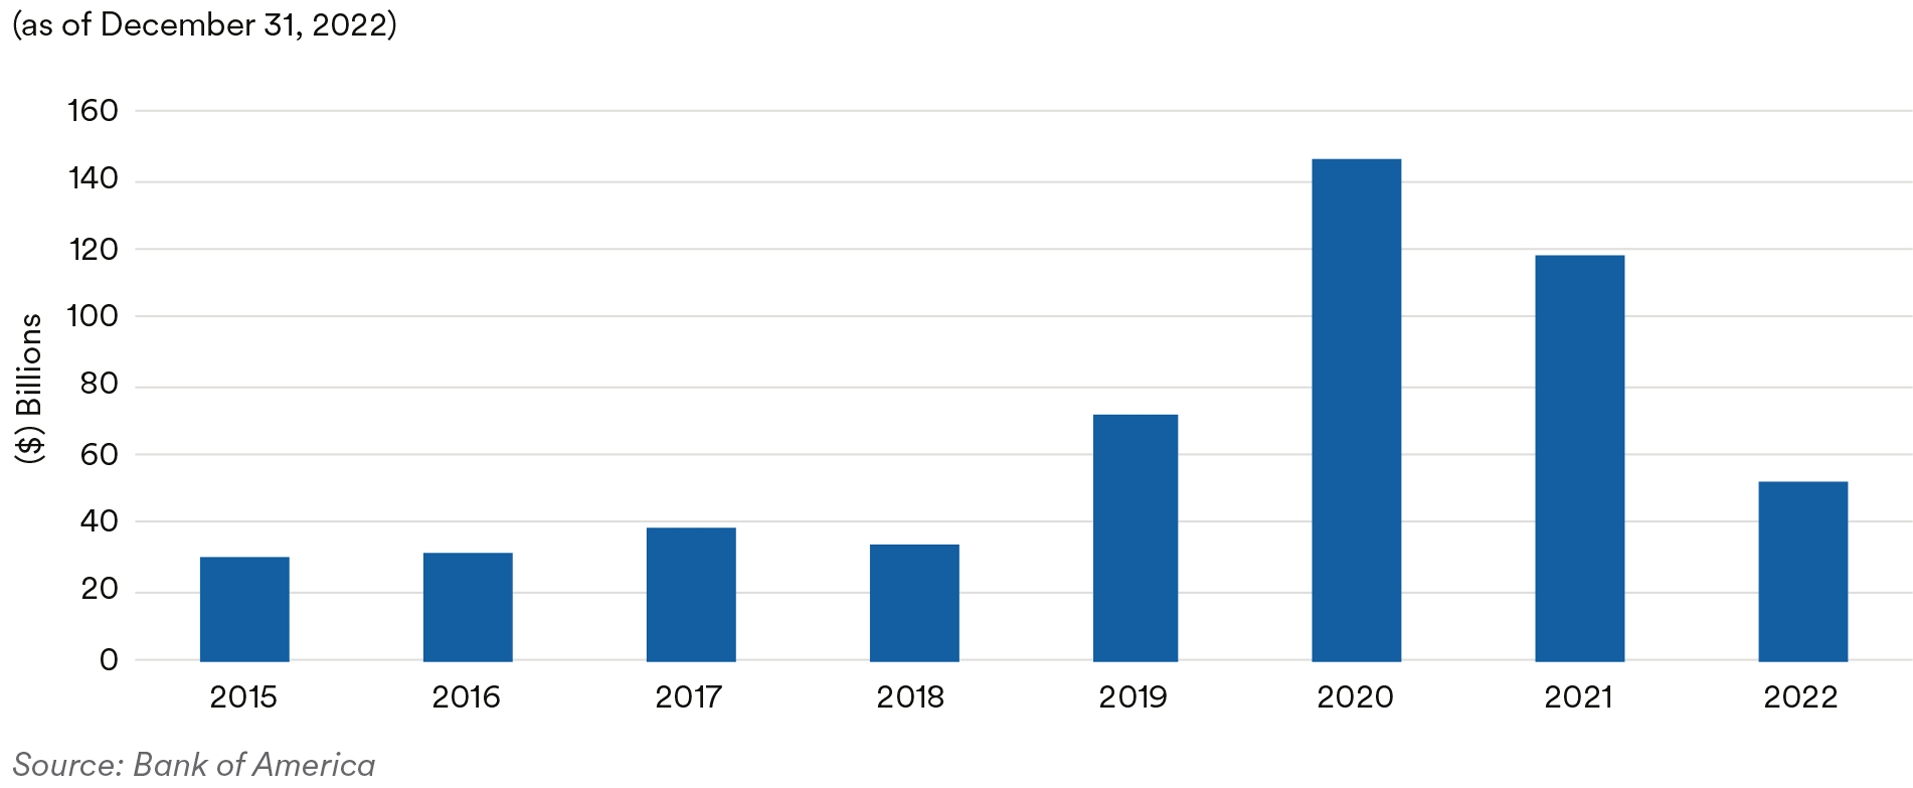
Recap: Total municipal new issue supply was $71 billion over the fourth quarter, a 41% decline from the 2021’s fourth quarter. The higher rate environment continued to hamper refunding supply resulting in a decline of 70% on a year-over-year basis. Lack of supply and increased investor demand supported the taxable municipal market, resulting in taxable municipals having positive absolute and excess returns during the fourth quarter. For the quarter, the ICE BofA 1-5 Year U.S. Taxable Municipal Securities Index total return was +1.08% versus the ICE BofA 1-5 Year U.S. Treasury Index total return of +0.95%.
Taxable Municipal Issuance
State tax collections for the third quarter were reported by the U.S. Census Bureau in midDecember. Per census data, collections were $20 billion, a year-over-year increase of 6.7%. Collections for the fourth quarter started strong with October median growth of 11%. However, weakening of the macroeconomic environment has begun to highlight revenue receipt moderation with states’ collection growth for November reported as slightly below 3%. Milliman’s Public Pension Funding Index, comprised of the 100 largest U.S. public pension plans, increased to 74.7% as of the end of November from 69.3% in September, driven by positive market gains in October and November. While the index is experiencing improvement, it remains below the 85.5% ratio as of December 2021. Notable ratings actions during the quarter include the State of Connecticut upgrade to AA- from A+ by S&P in November. S&P cited strong revenue collections, debt management, and high reserve levels as catalysts for the upgrade. A few of our holdings in the transportation sector were also upgraded over the quarter. In December, The Port Authority of NY & NJ was upgraded by Fitch to AA- from A+. The rating action reflects improved traffic volumes across the Port Authority’s bridges and tunnels, airports, and seaport facilities. Other transportation holdings that had ratings actions of note include upgrades by S&P of Denver CO Airport to AAfrom A+ in October, Houston TX Airport to A+ from A by S&P in November, and Phoenix AZ Rental Car Facilities to A from BBB+ by S&P in October.
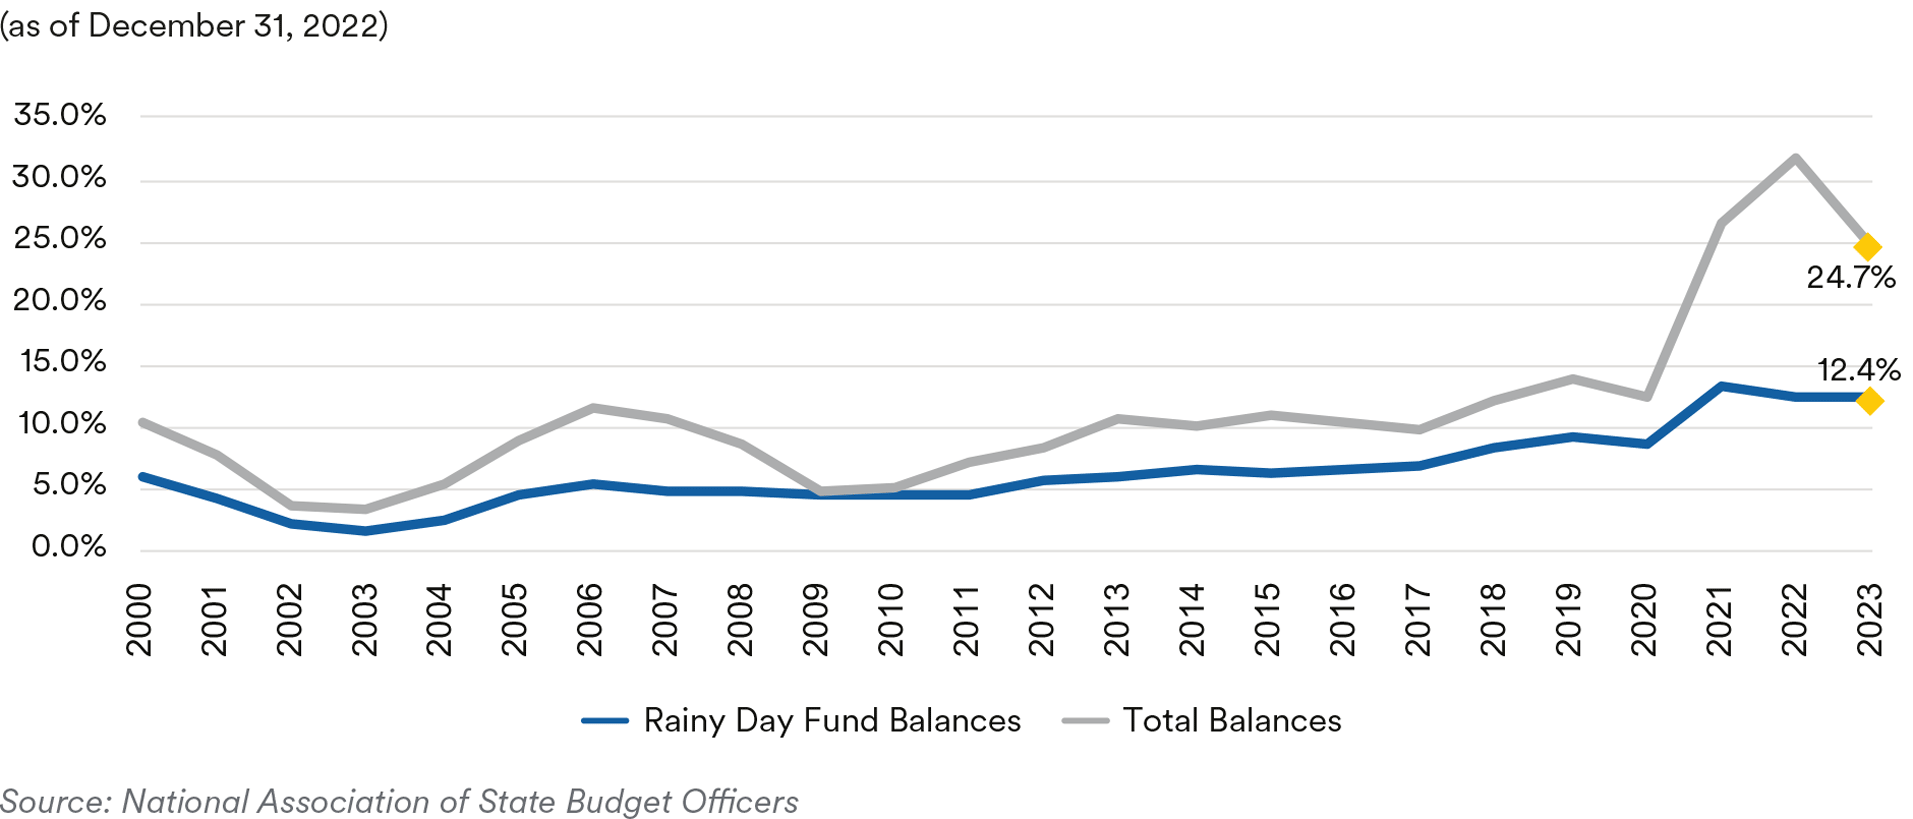
Portfolio Actions & Outlook: Our allocation to Taxable Municipals increased in our shorter duration strategies and levels were maintained in our longer strategies over the fourth quarter. Purchases in the portfolios were focused on the shorter end of the curve and in high-quality issues. We remain defensively biased and prefer to add to the state and local, transportation, and essential service sectors. State and local issuers have benefitted from increased revenues, federal stimulus measures and positive momentum in pension funding levels. Updated data from state budget offices and published in the National Association of State Budget Officers (“NASBO”) Fiscal Survey of State – Fall 2022 edition illustrate the overall improvement to historical norms for total fund balances and rainy-day funds. Based on states’ enacted budgets, projected total and rainy-day fund balances are estimated to be 24.7% and 12.4% of expenditures, compared to the most recent 10-year averages of 14.9% and 8.4%, respectively.
Rainy Day Fund Balances
We expect moderation of state revenue receipts as we move further into 2023. With that outlook, we favor state and local governments with operating and financial flexibility, diverse economies, and growing populations. We remain cautious on states with tax systems sensitive to potential recessiondriven revenue shortfalls. We seek to avoid states which do not have the ability or willingness to address outsized pension liabilities, either through increased funding or benefit reform, particularly as capital market volatility has increased asset sufficiency risks. As it relates to the transportation sector, growth in leisure travel is expected to taper due to the impact of inflation on consumer budgets. We will continue to look for opportunities to add to airports focused on international travel and those benefitting from decreased travel and COVID-19 restrictions in Asia. Toll roads were resilient during the rise in gas prices, and we view this as a stable sector. We anticipate adding to this sector with a predisposition towards systems where demonstrated demand is inelastic during prior recessionary periods. Healthcare issuers are expected to continue to be affected by high labor costs, particularly for nurses, which may present a headwind to restoring operating cash flow margins to pre-pandemic levels. Our forward-looking focus is on systems better equipped to adjust to macroeconomic weakness, favoring issuers with strong underlying fundamentals such as those with large local market share, favorable demographic trends, a growing outpatient network, effective cost control and solid balance sheets. We remain cautious on systems with high exposure to Medicaid/Medicare and those with limited ability to cut costs.
Performance: Our Taxable Municipal holdings generated mixed performance across our strategies in the fourth quarter. On an excess return basis, the sector was neutral in our shorter duration strategies and detracted from performance in our longer duration strategies. Holdings in airports and state obligations generated negative excess returns while positive contributions came from our holdings in housing, toll roads and tax-backed issues.
Disclosures
This document is being provided to you at your specific request. This document has been prepared by MetLife Investment Management LLC., a U.S. Securities Exchange Commission-registered investment adviser.
For investors in the United Kingdom, this document is being distributed by MetLife Investment Management Limited (“MIML”), authorized and regulated by the UK Financial Conduct Authority (FCA reference number 623761), registered address 1 Angel Lane 8th Floor London EC4R 3AB United Kingdom. This document is only intended for, and may only be distributed to, investors in the EEA who qualify as a Professional Client as defined under the EEA’s Markets in Financial Instruments Directive, as implemented in the relevant EEA jurisdiction. The investment strategy described herein is intended to be structured as an investment management agreement between MIML (or its affiliates, as the case may be) and a client, although alternative structures more suitable for a particular client can be discussed.
MIMEL: For investors in the EEA, this document is being distributed by MetLife Investment Management Europe Limited (“MIMEL”), authorised and regulated by the Central Bank of Ireland (registered number: C451684), registered address 20 on Hatch, Lower Hatch Street, Dublin 2, Ireland. This document is approved by MIMEL as marketing communications for the purposes of the EU Directive 2014/65/EU on markets in financial instruments (“MiFID II”). Where MIMEL does not have an applicable crossborder licence, this document is only intended for, and may only be distributed on request to, investors in the EEA who qualify as a “professional client” as defined under MiFID II, as implemented in the relevant EEA jurisdiction.
The investment strategies described herein are directly managed by delegate investment manager affiliates of MIMEL. Unless otherwise stated, any industry awards referenced herein relate to the awards of affiliates of MIMEL and not to awards of MIMEL. Unless otherwise stated, none of the authors of the articles on these pages are regulated in Ireland.
For Investors in Hong Kong: This document is being issued by MetLife Investments Asia Limited (“MIAL”), a part of MIM, and it has not been reviewed by the Securities and Futures Commission of Hong Kong (“SFC”).
For investors in Japan, this document is being distributed by MetLife Asset Management Corp. (Japan) (“MAM”), a registered Financial Instruments Business Operator (“FIBO”) conducting Investment Advisory Business, Investment Management Business and Type II Financial Instruments Business under the registration entry “Director General of the Kanto Local Finance Bureau (Financial Instruments Business Operator) No. 2414” pursuant to the Financial Instruments and Exchange Act of Japan (“FIEA”), and a regular member of the Japan Investment Advisers Association and the Type II Financial Instruments Firms Association of Japan. In its capacity as a discretionary investment manager registered under the FIEA, MAM provides investment management services and also sub-delegates a part of its investment management authority to other foreign investment management entities within MIM in accordance with the FIEA. This document is only being provided to investors in Japan who are Qualified Institutional Investors (tekikaku kikan toshika) as defined in Article 10 of Cabinet Office Ordinance on Definitions Provided in Article 2 of the FIEA. It is the responsibility of each prospective investor to satisfy themselves as to full compliance with the applicable laws and regulations of any relevant territory, including obtaining any requisite governmental or other consent and observing any other formality presented in such territory.
MetLife, Inc. provides investment management services to affiliates and unaffiliated/third party clients through various subsidiaries.1 MetLife Investment Management (“MIM”), MetLife, Inc.’s institutional investment management business, has more than 900 investment professionals located around the globe. MIM is responsible for investments in a range of asset sectors, public and privately sourced, including corporate and infrastructure private placement debt, real estate equity, commercial mortgage loans, customized index strategies, structured finance, emerging market debt, and high yield debt. The information contained herein is intended to provide you with an understanding of the depth and breadth of MIM’s investment management services and investment management experience. This document has been provided to you solely for informational purposes and does not constitute a recommendation regarding any investments or the provision of any investment advice, or constitute or form part of any advertisement of, offer for sale or subscription of, solicitation or invitation of any offer or recommendation to purchase or subscribe for any securities or investment advisory services. Unless otherwise specified, the information and opinions presented or contained in this document are provided as of the quarter end noted herein. It should be understood that subsequent developments may affect the information contained in this document materially, and MIM shall not have any obligation to update, revise or affirm. It is not MIM’s intention to provide, and you may not rely on this document as providing, a complete or comprehensive analysis of MIM’s investment portfolio, investment strategies or investment recommendations.
No money, securities or other consideration is being solicited. No invitation is made by this document or the information contained herein to enter into, or offer to enter into, any agreement to purchase, acquire, dispose of, subscribe for or underwrite any securities or structured products, and no offer is made of any shares in or debentures of a company for purchase or subscription. Prospective clients are encouraged to seek advice from their legal, tax and financial advisors prior to making any investment.
Confidentiality. By accepting receipt or reading any portion of this Presentation, you agree that you will treat the Presentation confidentially. This reminder should not be read to limit, in any way, the terms of any confidentiality agreement you or your organization may have in place with Logan Circle. This document and the information contained herein is strictly confidential (and by receiving such information you agree to keep such information confidential) and are being furnished to you solely for your information and may not be used or relied upon by any other party, or for any other purpose, and may not, directly or indirectly, be forwarded, published, reproduced, disseminated or quoted to any other person for any purpose without the prior written consent of MIM. Any forwarding, publication, distribution or reproduction of this document in whole or in part is unauthorized. Any failure to comply with this restriction may constitute a violation of applicable securities laws.
Past performance is not indicative of future results. No representation is being made that any investment will or is likely to achieve profits or losses or that significant losses will be avoided. There can be no assurance that investments similar to those described in this document will be available in the future and no representation is made that future investments managed by MIM will have similar returns to those presented herein.
No offer to purchase or sell securities. This Presentation does not constitute an offer to sell or a solicitation of an offer to buy any security and may not be relied upon in connection with the purchase or sale of any security. © 2023 MetLife Services and Solutions, LLC
No reliance, no update and use of information. You may not rely on this Presentation as the basis upon which to make an investment decision. To the extent that you rely on this Presentation in connection with any investment decision, you do so at your own risk. This Presentation is being provided in summary fashion and does not purport to be complete. The information in the © 2022 MetLife Services and Solutions, LLC Presentation is provided to you as of the dates indicated and MIM does not intend to update the information after its distribution, even in the event that the information becomes materially inaccurate. Certain information contained in this Presentation, includes performance and characteristics of MIM’s by independent third parties, or have been prepared internally and have not been audited or verified. Use of different methods for preparing, calculating or presenting information may lead to different results for the information presented, compared to publicly quoted information, and such differences may be material.
Risk of loss. An investment in the strategy described herein is speculative and there can be no assurance that the strategy’s investment objectives will be achieved. Investors must be prepared to bear the risk of a total loss of their investment.
No tax, legal or accounting advice. This Presentation is not intended to provide, and should not be relied upon for, accounting, legal or tax advice or investment recommendations. Any statements of U.S. federal tax consequences contained in this Presentation were not intended to be used and cannot be used to avoid penalties under the U.S. Internal Revenue Code or to promote, market or recommend to another party any tax-related matters addressed herein. Forward-Looking Statements. This document may contain or incorporate by reference information that includes or is based upon forward-looking statements within the meaning of the Private Securities Litigation Reform Act of 1995. Forward-looking statements give expectations or forecasts of future events. These statements can be identified by the fact that they do not relate strictly to historical or current facts. They use words and terms such as “anticipate,” “estimate,” “expect,” “project,” “intend,” “plan,” “believe,” “will,” and other words and terms of similar meaning, or are tied to future periods in connection with a discussion of future performance. Forward-looking statements are based on MIM’s assumptions and current expectations, which may be inaccurate, and on the current economic environment which may change. These statements are not guarantees of future performance. They involve a number of risks and uncertainties that are difficult to predict. Results could differ materially from those expressed or implied in the forward-looking statements. Risks, uncertainties and other factors that might cause such differences include, but are not limited to: (1) difficult conditions in the global capital markets; (2) changes in general economic conditions, including changes in interest rates or fiscal policies; (3) changes in the investment environment; (4) changed conditions in the securities or real estate markets; and (5) regulatory, tax and political changes. MIM does not undertake any obligation to publicly correct or update any forward-looking statement if it later becomes aware that such statement is not likely to be achieved.
1 MetLife Investment Management (“MIM”) is MetLife, Inc.’s institutional management business and the marketing name for subsidiaries of MetLife that provide investment management services to MetLife’s general account, separate accounts and/ or unaffiliated/third party investors, including: Metropolitan Life Insurance Company, MetLife Investment Management, LLC, MetLife Investment Management Limited, MetLife Investments Limited, MetLife Investments Asia Limited, MetLife Latin America Asesorias e Inversiones Limitada, MetLife Asset Management Corp. (Japan), and MIM I LLC and MetLife Investment Management Europe Limited.


