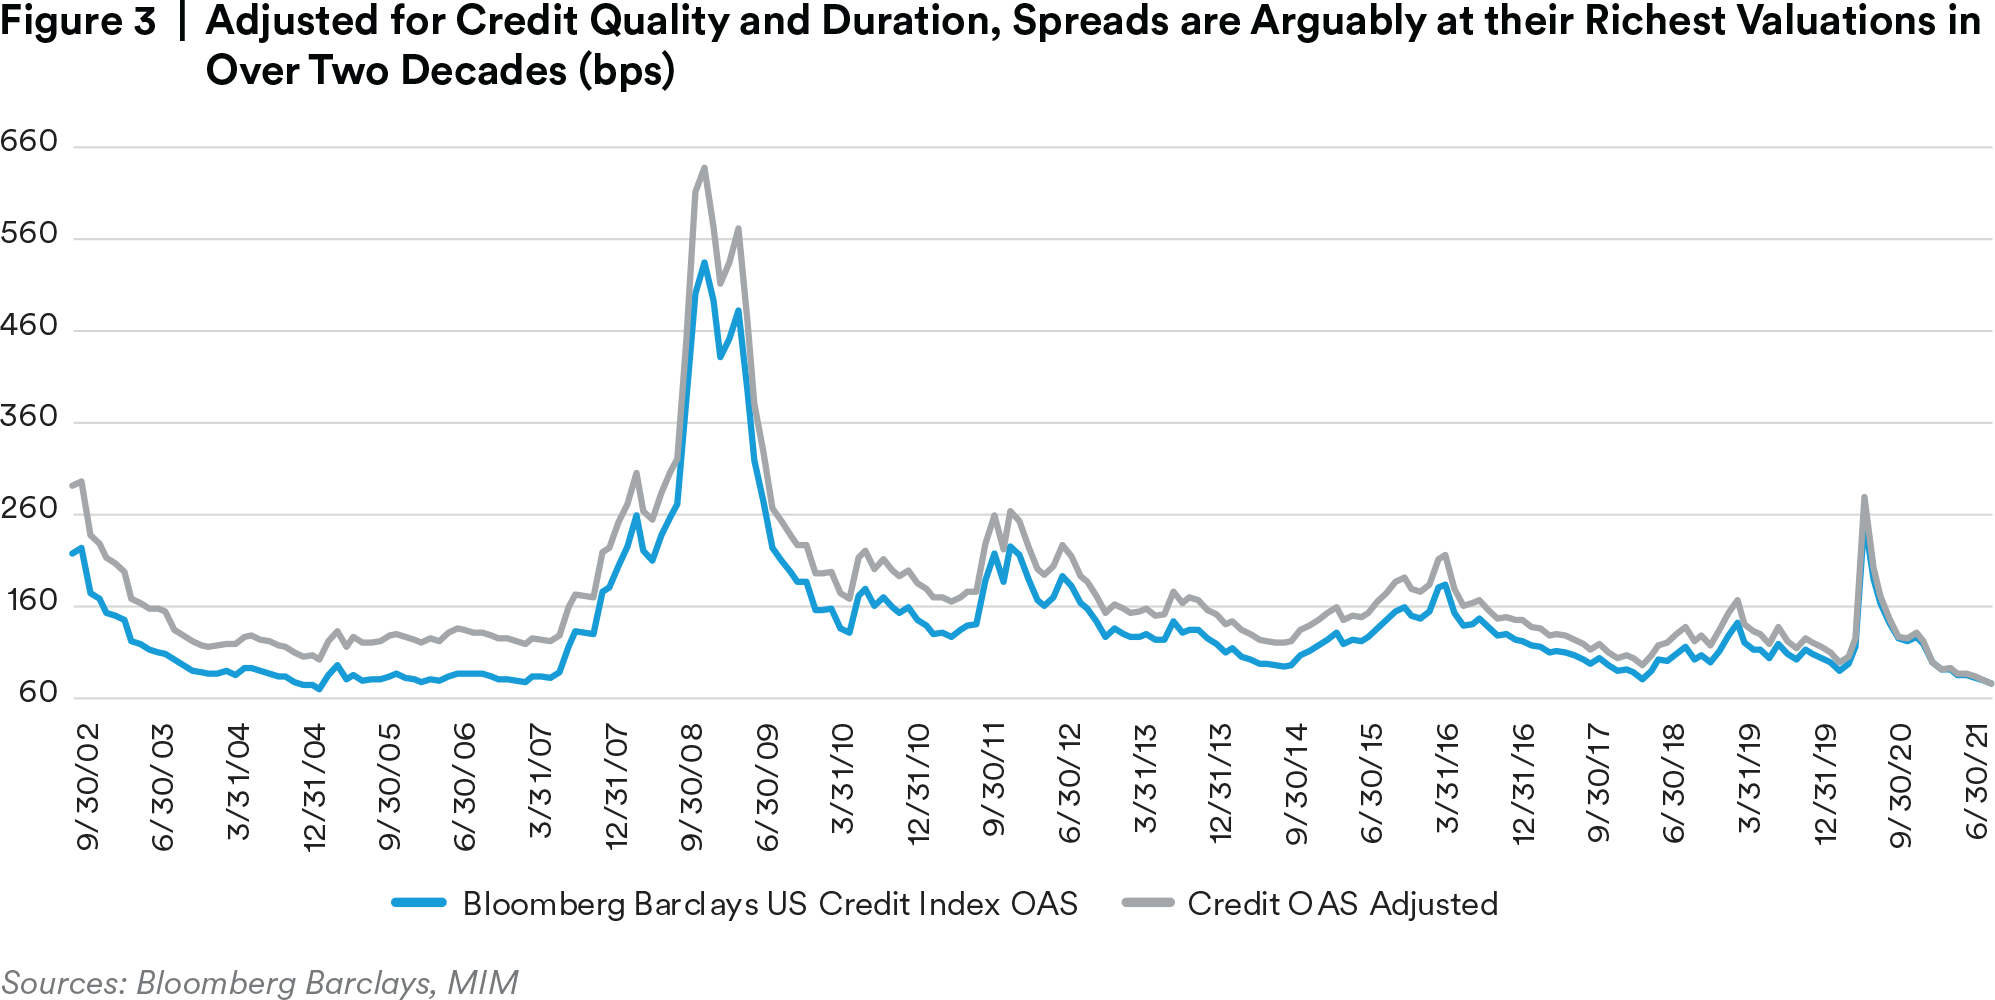
Corporate earnings continued to rebound in the first quarter and EPS growth jumped more than 50% year over-year for the S&P 500. Actual results were much better than the expected 23% growth, and corporate profitability is expected to continue to improve through the remainder of the year, with estimates of 63% for the second quarter and 36% for year-end. The S&P 500 gained 8.2% and the NDX 100 caught up aftera sluggish first quarter and rose 11.18%, both posting new all-time highs during the quarter. The VIX index declined 18% to 15.8, although equities experienced sporadic bouts of volatility whereas credit spread volatility subsided. Crude oil jumped 24.2% and reached the highest level since October 2018. The US 10-year rate declined 27 basis points to 1.47%. Finally, spreads tightened further across credit markets asexcess liquidity from easy financial conditions and low rates continues to support very tight valuations. US investment grade spreads ended the quarter at new post 2008 tights, and as shown in Figures 2 and 3, adjusted for credit quality and duration, spreads are arguably at their richest valuations in overtwo decades.4

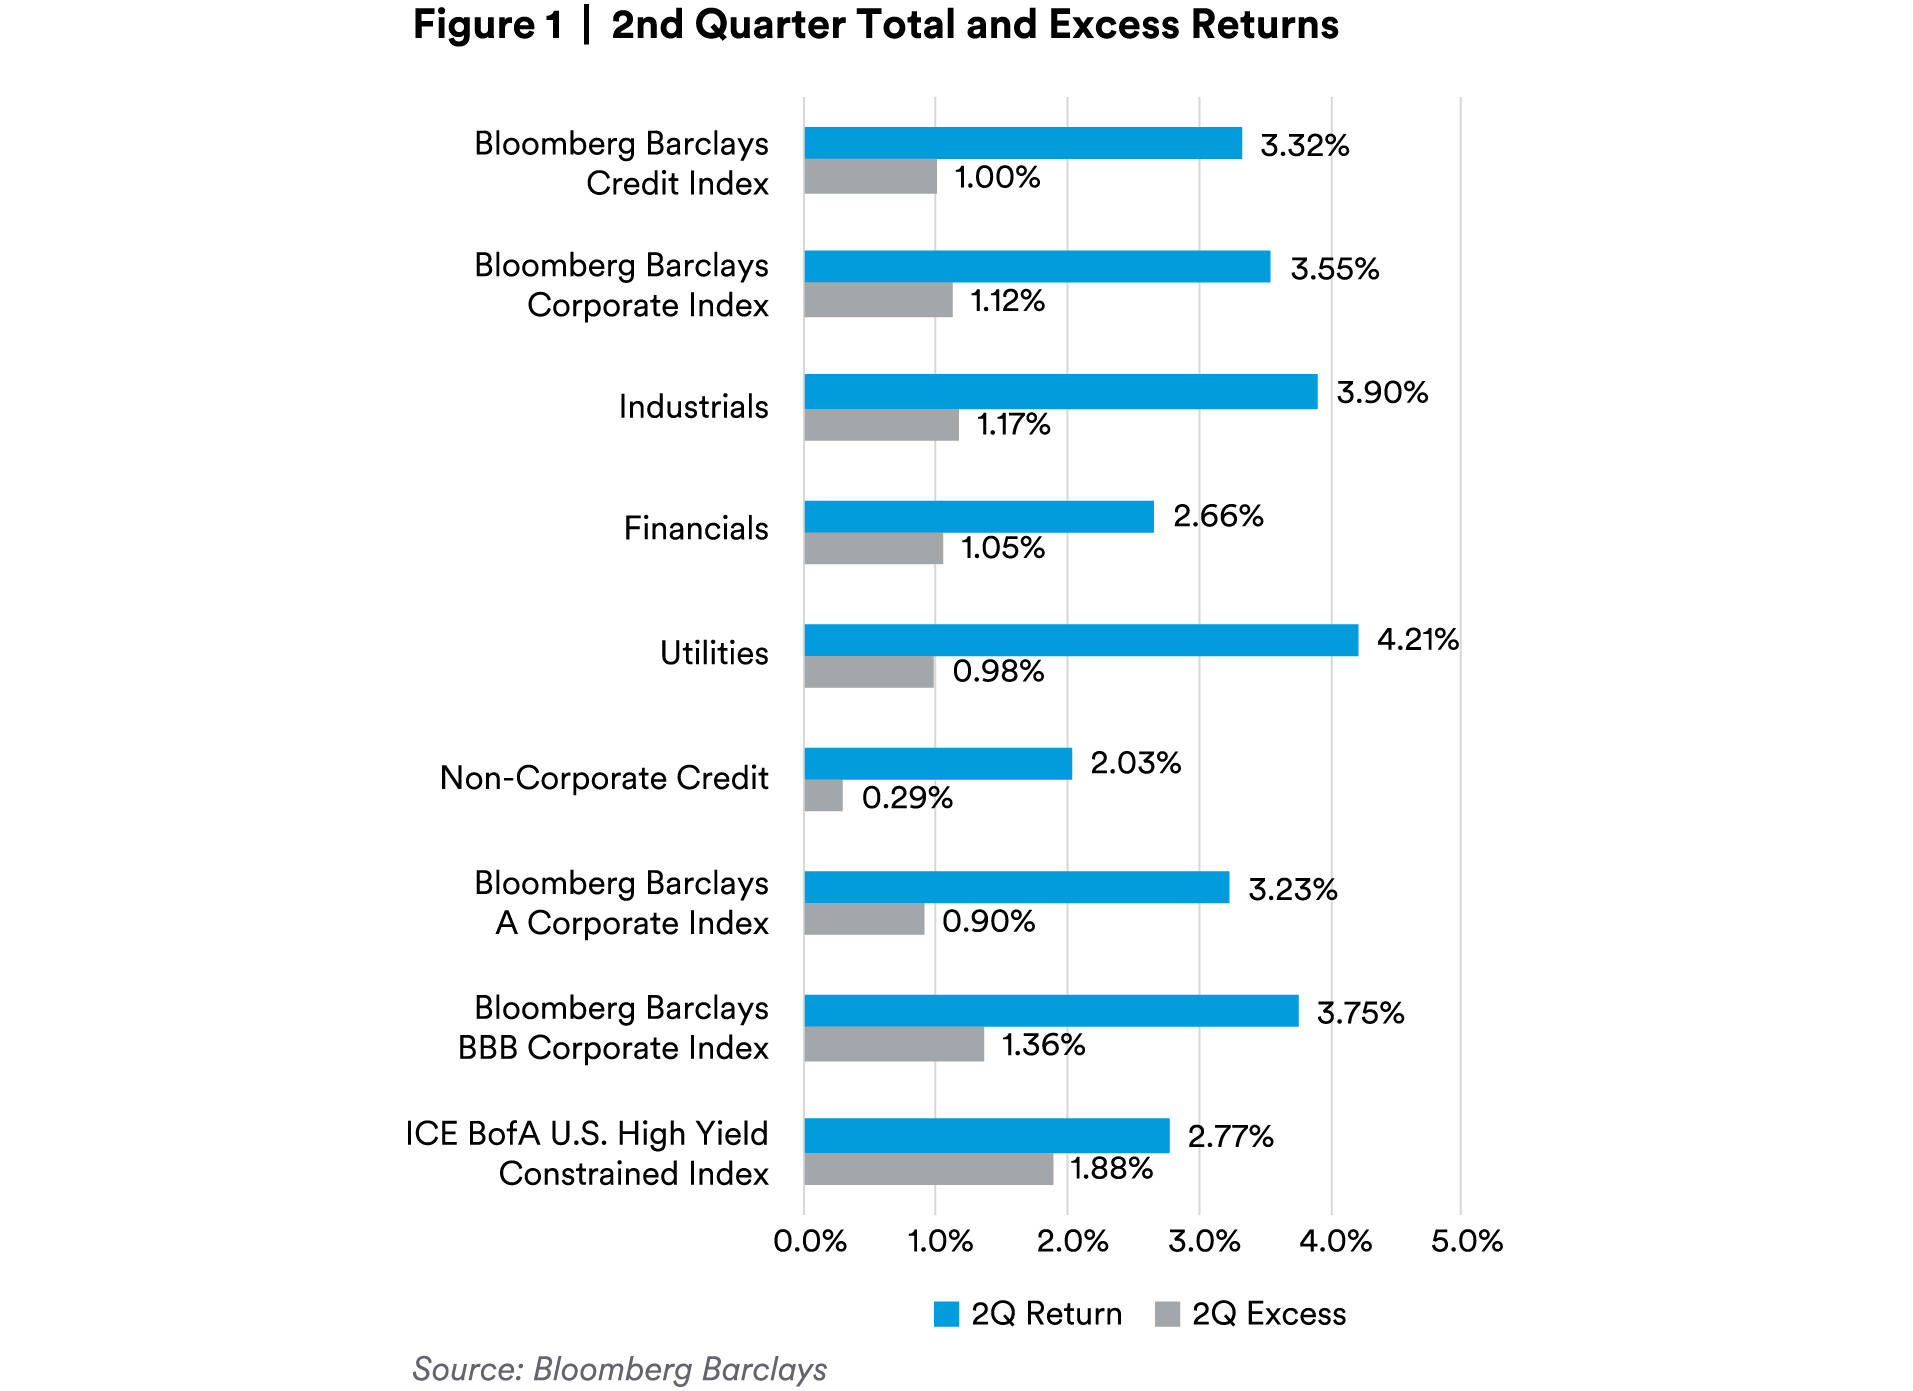
The Bloomberg Barclays US Credit Index OAS ended the quarter nine basis points tighter at 77 basis points. The Index generated an excess return of 1.00%, extending year to date excess return to 1.90%. Afterone of the worst quarterly losses on record in the first quarter, total return recovered strongly on declinin grates as the index yield fell 22 basis points to 1.97%.5 As the Treasury curve flattened overall, the 2s/10s curve flattened 36 basis points to end the quarter at 122 basis points, while the 10s/30s curve flattened five basis points to 62 basis points6. In sharp contrast to the first half of 2020, rising star volumes are significantly outpacing fallen angels with $1.4 billion of fallen angels and $20.9 billion of rising stars in the first half of 2021, and as shown in Figure 4, market expectations are for this trend to continue7.

Excess returns were broadly positive as spreads narrowed across the investment grade corporate market. Corporate BBBs continue to outperform higher quality credits posting an excess return of 1.25% versus 0.85% for their A-rated counterparts. The credit curve steepened as front-end spreads and intermediate spreads tightened 14 and 13 basis points, respectively, while long-end spreads tightened eight basis points. However, we note that credit curves are still very flat overall. Looking at the intermediate portion of the curve, the 5s/10s spread curve steepened three basis points to end the quarter at +35 basis points. At the sector level, commodity-related and long duration sectors outperformed. Energy sectors notably outperformed as oil prices significantly increased. Midstream, Oil Field Services, Independent, and Refining posted strong excess returns in the range of 1.99% to 2.62%. Outside the Energy sectors, long duration sectors also generated strong performance led by Wirelines, Diversified Manufacturing, and Metal and Mining. Other outperforming sectors include Finance Companies and REITs. Conversely, higher quality and defensive sectors underperformed, but still generated positive excess returns. Tobacco, Consumer Cyclical Services, Health Insurance, Cable Satellite, Pharmaceuticals, and Healthcare wereamong the underperforming sectors. Overall, Corporate credit continues to outperform Non-corporates with excess returns of 1.10% and 0.29%, respectively.8

Primary market activity slowed during the second quarter. IG supply was $350 billion, which was 17% below the pace of 1Q21 and 13% below the historical 2Q average issuance of $401 billion during the past four years (2017-2020). Net supply was $336 billion, down 57% from the first half of the year, driven by gross supply decline and an increase in maturities. As we have previously seen in European markets, ESG has become a greater focus in the US. According to Bloomberg, ESG bond issuance including green, social, sustainability and sustainability-linked bonds was $547 billion globally and $37 billion in the US during the first half of the year. Market expectations are for ESG issuance to continue to grow. From a ratings perspective, BBB issuance accounted for only 36% of the new issuance versus the average of 53% over the past four quarters. A-rated issuers were more active with 57% of total issuance in 2Q21 versus the average of 39% over the past four quarters. Driven by an increase of short end maturities, the average maturity of IG new issuance year-to-date was 10.7 years, down from 12.6 years in 2020. Finally, as we have seen in recent periods, demand for investment grade credit remained very strong, notably enhanced by flows from offshore investors benefiting from a pick-up in yield even after accounting for currency hedging. In the quarter, investment grade credit funds posted robust net inflows of over $100 billion, extending year to date net inflows to a first half of the year record of $207 billion.

With the first half of 2021 having passed rapidly by, our outlook for credits preads for the balance of the year is tepid, at best.
Despite generally supportive fundamentals and continued strong technical demand, current valuations are generally unattractive. Investment Grade and High Yield credit spreads currently reside at or near their historical richest levels. In fact, and as we noted previously, adjusted for credit quality and duration, we suggest spreads have never been richer. Additionally, real yields for credit have never been lower, with IG credit yields firmly below both 5- and 10-year breakeven rates.
The direction of credit spreads in recent weeks has been most impacted by risk assets external to the fixed income market and we anticipate our markets will continue to follow the lead of equities, commodities, and other risk assets. Spread volatility remains subdued and market participants on both buy and sell side are “on-sides” from a positioning perspective. So, while we can’t be enthusiastic about credit, we also don’t see an internal imbalance or catalyst to change the landscape.
Widening the lens, we see a broader market and economy that is in a phase transition from pandemic to whatever lies in the future. Recent economic data and indicators have been quite literally off the charts as compared to severely depressed 2020 base effects. Even beyond year over year comparisons, sequential data too remains quite strong as vaccination campaigns have accelerated return economic activity to something closer to ‘normal’. This acceleration, combined with stressed supply chains and pandemic related changes in demand patterns, has caused a spike in prices (anecdotally and in official data) that has been a high focus of market participants. Our view remains that absent durable wage or employment growth, sustained and problematic inflationary pressures are unlikely. In fact, in the near term we see significant hurdles to continued price pressures. Currently over half the states in the country have pulled out of the federal enhanced unemployment benefits and those that haven’t face expiration in September. Additionally, the federal eviction moratorium is slated to expire at the end of July. We see a confluence of expiring benefits and re-opening induced demand balance shifting from goods towards services as factors driving lower wage workers back into the workforce, the impact of which will be downward pressure on aggregate wages. Furthermore, with every passing month, the economic metrics and corporate earnings (annual or sequential) get harder to ‘beat’, which will effectively slow the upside rate of change of such data. We have just begun to start seeing data miss lofty estimates and GDP projections stair step lower for 2H2021 and 2022. Accordingly, rates have mirrored the tempering outlooks, having declined at the 10yr point from 1.75% on first day of the quarter to 1.35% at the time of publication.
The big question on our minds, and certainly that of other investors, is the reaction function of the Federal Reserve. Currently the Fed continues to monetize the debt and simultaneously pour gasoline on the red-hot housing market with monthly purchases of $120bln of treasury and mortgage securities. Curiously, they have begun to unwind the (albeit relatively tiny) Secondary Market Corporate Credit Facility, which in our opinion only further highlights the ridiculousness of ongoing treasury and mortgage Quantitative Easing. We can easily envision the Fed beginning to taper such asset purchases, or communicate the tapering, later this quarter. Against the backdrop of aforementioned decelerating economic conditions and record valuations of any risk asset that exists, the potential of rising volatility is quite real, an outcome we are sure Jerome Powell desperately wants to, but may be unable to, avoid.
It is difficult to pinpoint catalysts that will push credit spreads significantly tighter. In line with our previous quarterly outlook, the expectation of improving fundamentals has begun to materialize. Leverage has started to stabilize and should continue to improve as EBITDA rises and debt growth slows across companies. Similarly, technicals also remain supportive of investment grade corporate spreads and solid supply. In terms of demand, US credit markets remain attractive globally from a relative value perspective. The factors, however, are currently known and the market is priced for perfection. Therefore, we remain conservatively positioned through less credit risk.
We continue to prefer BBBs versus As within credit. With the spread between these two ratings cohorts near historical tights, we fear higher quality companies lack incentive to preserve that once-coveted single-A rating. To date, we have seen some high-profile signs of re-leveraging from this higher quality segment of the market which underpins our preference to selectively overweight lower quality credit. As the pressure to increase leverage is most acute in the higher rated cohort, we reject the notion of consolidation into higher rated credit as an “upgrade trade” and prefer to own BBBs and an increased allocation to Treasuries.
Looking forward, security selection will continue to play a crucial role in portfolio construction, and alpha generation will likely be driven by opportunistic positioning in select names and select points on the curve. Additionally, we continue to target companies who have indicated a preference and willingness to further deleverage their balance sheet. High yield spreads have reached new post crisis tights with the differential between high yield and investment grade spreads at the tightest level ever, but record volumes in the high yield primary market have presented opportunities to recycle positions and capture attractive new issue concessions.
Finally, with the steepening of the intermediate part of the curve, we have found opportunities to swap shorter dated positions out to the 8 to 10-year part of the curve, picking up additional yield with marginal duration extension.
Overall, while the uncertainties in the market have subsided, a relatively cautious tone remains as economies begin to reopen following 18 months of strict lockdowns. Further, we think it is premature to be overly exuberant and prefer to take prudent steps to protect to the downside while looking for idiosyncratic opportunities along the way.
Endnotes
1 Bloomberg
2 Bloomberg
3 Bloomberg
4 Bloomberg
5 Bloomberg Barclays
6 Bloomberg
7 JP Morgan, Barclays
8 Bloomberg Barclays
Disclosure
This material is intended solely for Institutional Investors, Qualified Investors and Professional Investors. This analysis is not intended for distribution with Retail Investors.
This document has been prepared by MetLife Investment Management (“MIM”)1 solely for informational purposes and does not constitute a recommendation regarding any investments or the provision of any investment advice, or constitute or form part of any advertisement of, offer for sale or subscription of, solicitation or invitation of any offer or recommendation to purchase or subscribe for any securities or investment advisory services. The views expressed herein are solely those of MIM and do not necessarily reflect, nor are they necessarily consistent with, the views held by, or the forecasts utilized by, the entities within the MetLife enterprise that provide insurance products, annuities and employee benefit programs. The information and opinions presented or contained in this document are provided as the date it was written. It should be understood that subsequent developments may materially affect the information contained in this document, which none of MIM, its affiliates, advisors or representatives are under an obligation to update, revise or affirm. It is not MIM’s intention to provide, and you may not rely on this document as providing, a recommendation with respect to any particular investment strategy or investment. Affiliates of MIM may perform services for, solicit business from, hold long or short positions in, or otherwise be interested in the investments (including derivatives) of any company mentioned herein. This document may contain forward-looking statements, as well as predictions, projections and forecasts of the economy or economic trends of the markets, which are not necessarily indicative of the future. Any or all forward-looking statements, as well as those included in any other material discussed at the presentation, may turn out to be wrong.
All investments involve risks including the potential for loss of principle and past performance does not guarantee similar future results. Fixed income investments are subject interest rate risk (the risk that interest rates may rise causing the face value of the debt instrument to fall) and credit risks (the risk that the issuer of the debt instrument may default).
In the U.S. this document is communicated by MetLife Investment Management, LLC (MIM, LLC), a U.S. Securities Exchange Commission registered investment adviser. MIM, LLC is a subsidiary of MetLife, Inc. and part of MetLife Investment Management. Registration with the SEC does not imply a certain level of skill or that the SEC has endorsed the investment advisor.
This document is being distributed by MetLife Investment Management Limited (“MIML”), authorised and regulated by the UK Financial Conduct Authority (FCA reference number 623761), registered address Level 34 One Canada Square London E14 5AA United Kingdom. This document is only intended for, and may only be distributed to, investors in the EEA who qualify as a Professional Client as defined under the EEA’s Markets in Financial Instruments Directive, as implemented in the relevant EEA jurisdiction. The investment strategy described herein is intended to be structured as an investment management agreement between MIML (or its affiliates, as the case may be) and a client, although alternative structures more suitable for a particular client can be discussed.
For investors in the Middle East: This document is directed at and intended for institutional investors (as such term is defined in the various jurisdictions) only. The recipient of this document acknowledges that (1) no regulator or governmental authority in the Gulf Cooperation Council (“GCC”) or the Middle East has reviewed or approved this document or the substance contained within it, (2) this document is not for general circulation in the GCC or the Middle East and is provided on a confidential basis to the addressee only, (3) MetLife Investment Management is not licensed or regulated by any regulatory or governmental authority in the Middle East or the GCC, and (4) this document does not constitute or form part of any investment advice or solicitation of investment products in the GCC or Middle East or in any jurisdiction in which the provision of investment advice or any solicitation would be unlawful under the securities laws of such jurisdiction (and this document is therefore not construed as such).
For investors in Japan: This document is being distributed by MetLife Asset Management Corp. (Japan) (“MAM”), 1-3 Kioicho, Chiyoda-ku, Tokyo 102- 0094, Tokyo Garden Terrace KioiCho Kioi Tower 25F, a registered Financial Instruments Business Operator (“FIBO”) No. 2414.
For Investors in Hong Kong: This document is being issued by MetLife Investments Asia Limited (“MIAL”), a part of MIM, and it has not been reviewed by the Securities and Futures Commission of Hong Kong (“SFC”).
For investors in Australia: This information is distributed by MIM LLC and is intended for “wholesale clients” as defined in section 761G of the Corporations Act 2001 (Cth) (the Act). MIM LLC exempt from the requirement to hold an Australian financial services license under the Act in respect of the financial services it provides to Australian clients. MIM LLC is regulated by the SEC under US law, which is different from Australian law.
1 MetLife Investment Management (“MIM”) is MetLife, Inc.’s institutional management business and the marketing name for subsidiaries of MetLife that provide investment management services to MetLife’s general account, separate accounts and/ or unaffiliated/third party investors, including: Metropolitan Life Insurance Company, MetLife Investment Management, LLC, MetLife Investment Management Limited, MetLife Investments Limited, MetLife Investments Asia Limited, MetLife Latin America Asesorias e Inversiones Limitada, MetLife Asset Management Corp. (Japan), and MIM I LLC.