Over the past year, high-income households have increasingly become the primary driver of consumption growth. The top 10% of earners accounted for 50% of spending in 2Q25,1 which was the highest since data collection began in 1989. Meanwhile, real disposable income growth for the bottom ~80% slowed materially, as pandemic-era savings were exhausted and debt servicing costs increased, particularly on revolving credit balances.2
We expect this disparity in income growth to intensify in 2026, and this composition matters for real estate.
In 2026, we expect leasing demand across most product types to be tied less to national aggregates and more to where high-value employment and wage gains concentrate. That supports coastal multifamily and select office submarkets, while tempering some Sun Belt locations.
At the same time, we believe an unrelated factor comes from an AI-linked labor adjustment.
AI adoption had a measurable impact on the labor market in 2025. Challenger, Gray & Christmas reported nearly 50,000 job cuts attributed to AI, year to date; however, this figure is likely conservative, as AI has also contributed to a decline in job openings. Estimates of total white-collar jobs eliminated over the past 18 months range from 50,000 to 4,000,000, with only partial offsets from new roles in the AI sector. We believe entry-level and administrative positions have been among the most affected, but the net impact across the labor market remains uncertain. Over the next several years we expect a reconcentration of office demand into markets with deep talent pools and industry clusters. Office performance tied to generalized “return to office” narratives is likely to continue to be unreliable.
These labor market shifts and evolving demand patterns are reshaping the landscape for capital flows and asset valuations. Against this backdrop, we examine how these forces are reflected in current capital market conditions.
Private U.S. commercial real estate values bottomed in 4Q24 (NCREIF Property Index), with office the last sector to trough in 2Q25. Transaction activity (CRE liquidity) improved throughout 2025 as bid-ask spreads narrowed, although meaningful capital re-entry has not yet occurred. Allocation targets have adjusted downward in many institutional portfolios, in some cases through formal revisions rather than slower deployment.
This divergence between valuation stabilization and capital behavior is not unusual; however, the drivers differ from those in the post-2008 cycle, when aggressive monetary easing, distressed pricing and a slow but broad rebound in employment provided clarity to fundamentals across all property types. Drawing on industry surveys, investor discussions, public pension disclosures and themes from the Fall 2025 PREA conference, we see allocation targets trending lower. The primary driver: CRE returns have lagged other major asset classes over the past three years. This has largely been due to falling property prices, and investors are responding by recalibrating CRE allocation targets lower rather than making new investments.
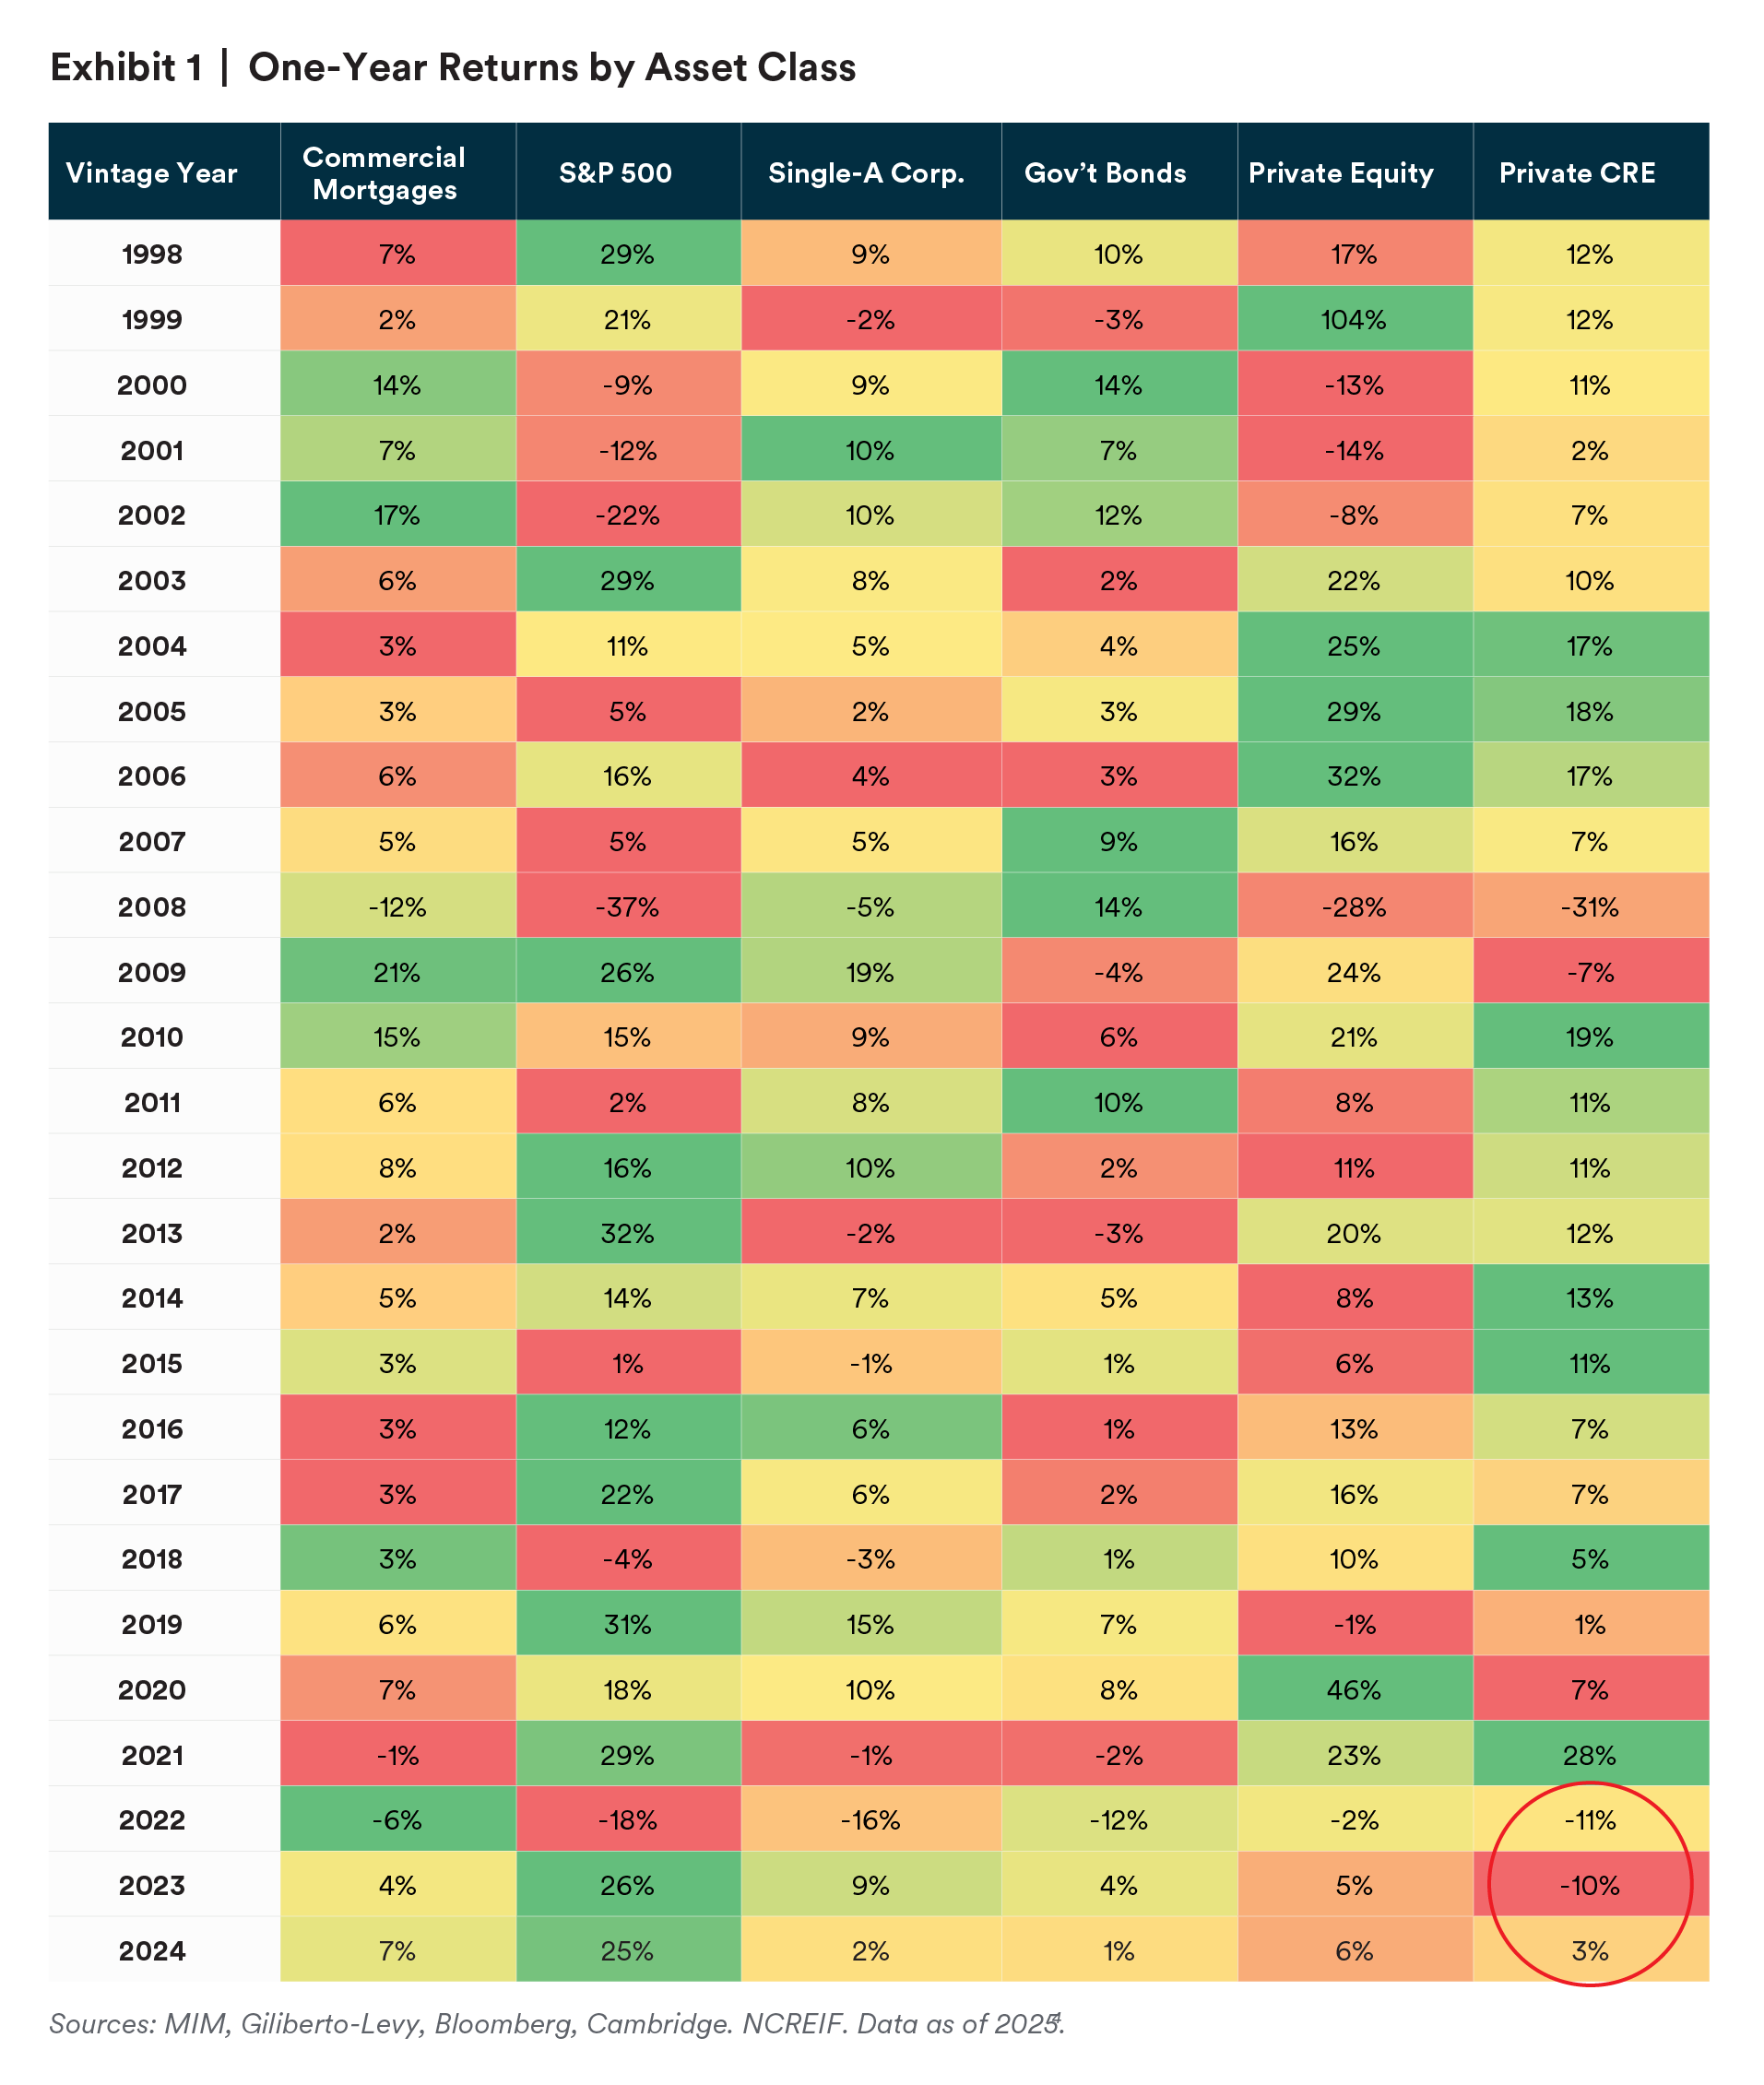
To show the magnitude of this underperformance, we compare the one-year performance across major asset classes since 1998 (Exhibit 1). The table’s color coding considers the risk profile of different investment sectors; for instance, government bonds returned 10% in 2011 and are coded as the best sector with dark green, even though private CRE slightly outperformed on an absolute basis with an 11% return. Relative performance trends over the past four years have contributed to higher redemption queues for open-end core real estate funds. Redemption queues began to rise in 2022, peaked at $41 billion in 1Q24 and have since fallen to just below $25 billion.3
This persistent underperformance and shifting investor sentiment have direct implications for portfolio strategy. With capital allocations in flux, it is critical to reassess sector positioning and identify where fundamentals and pricing offer the most compelling risk-adjusted opportunities.
Where are the opportunities and risks today? Here are the property types we expect to perform, best to worst, in 2026, considering both spot market pricing and current fundamentals.
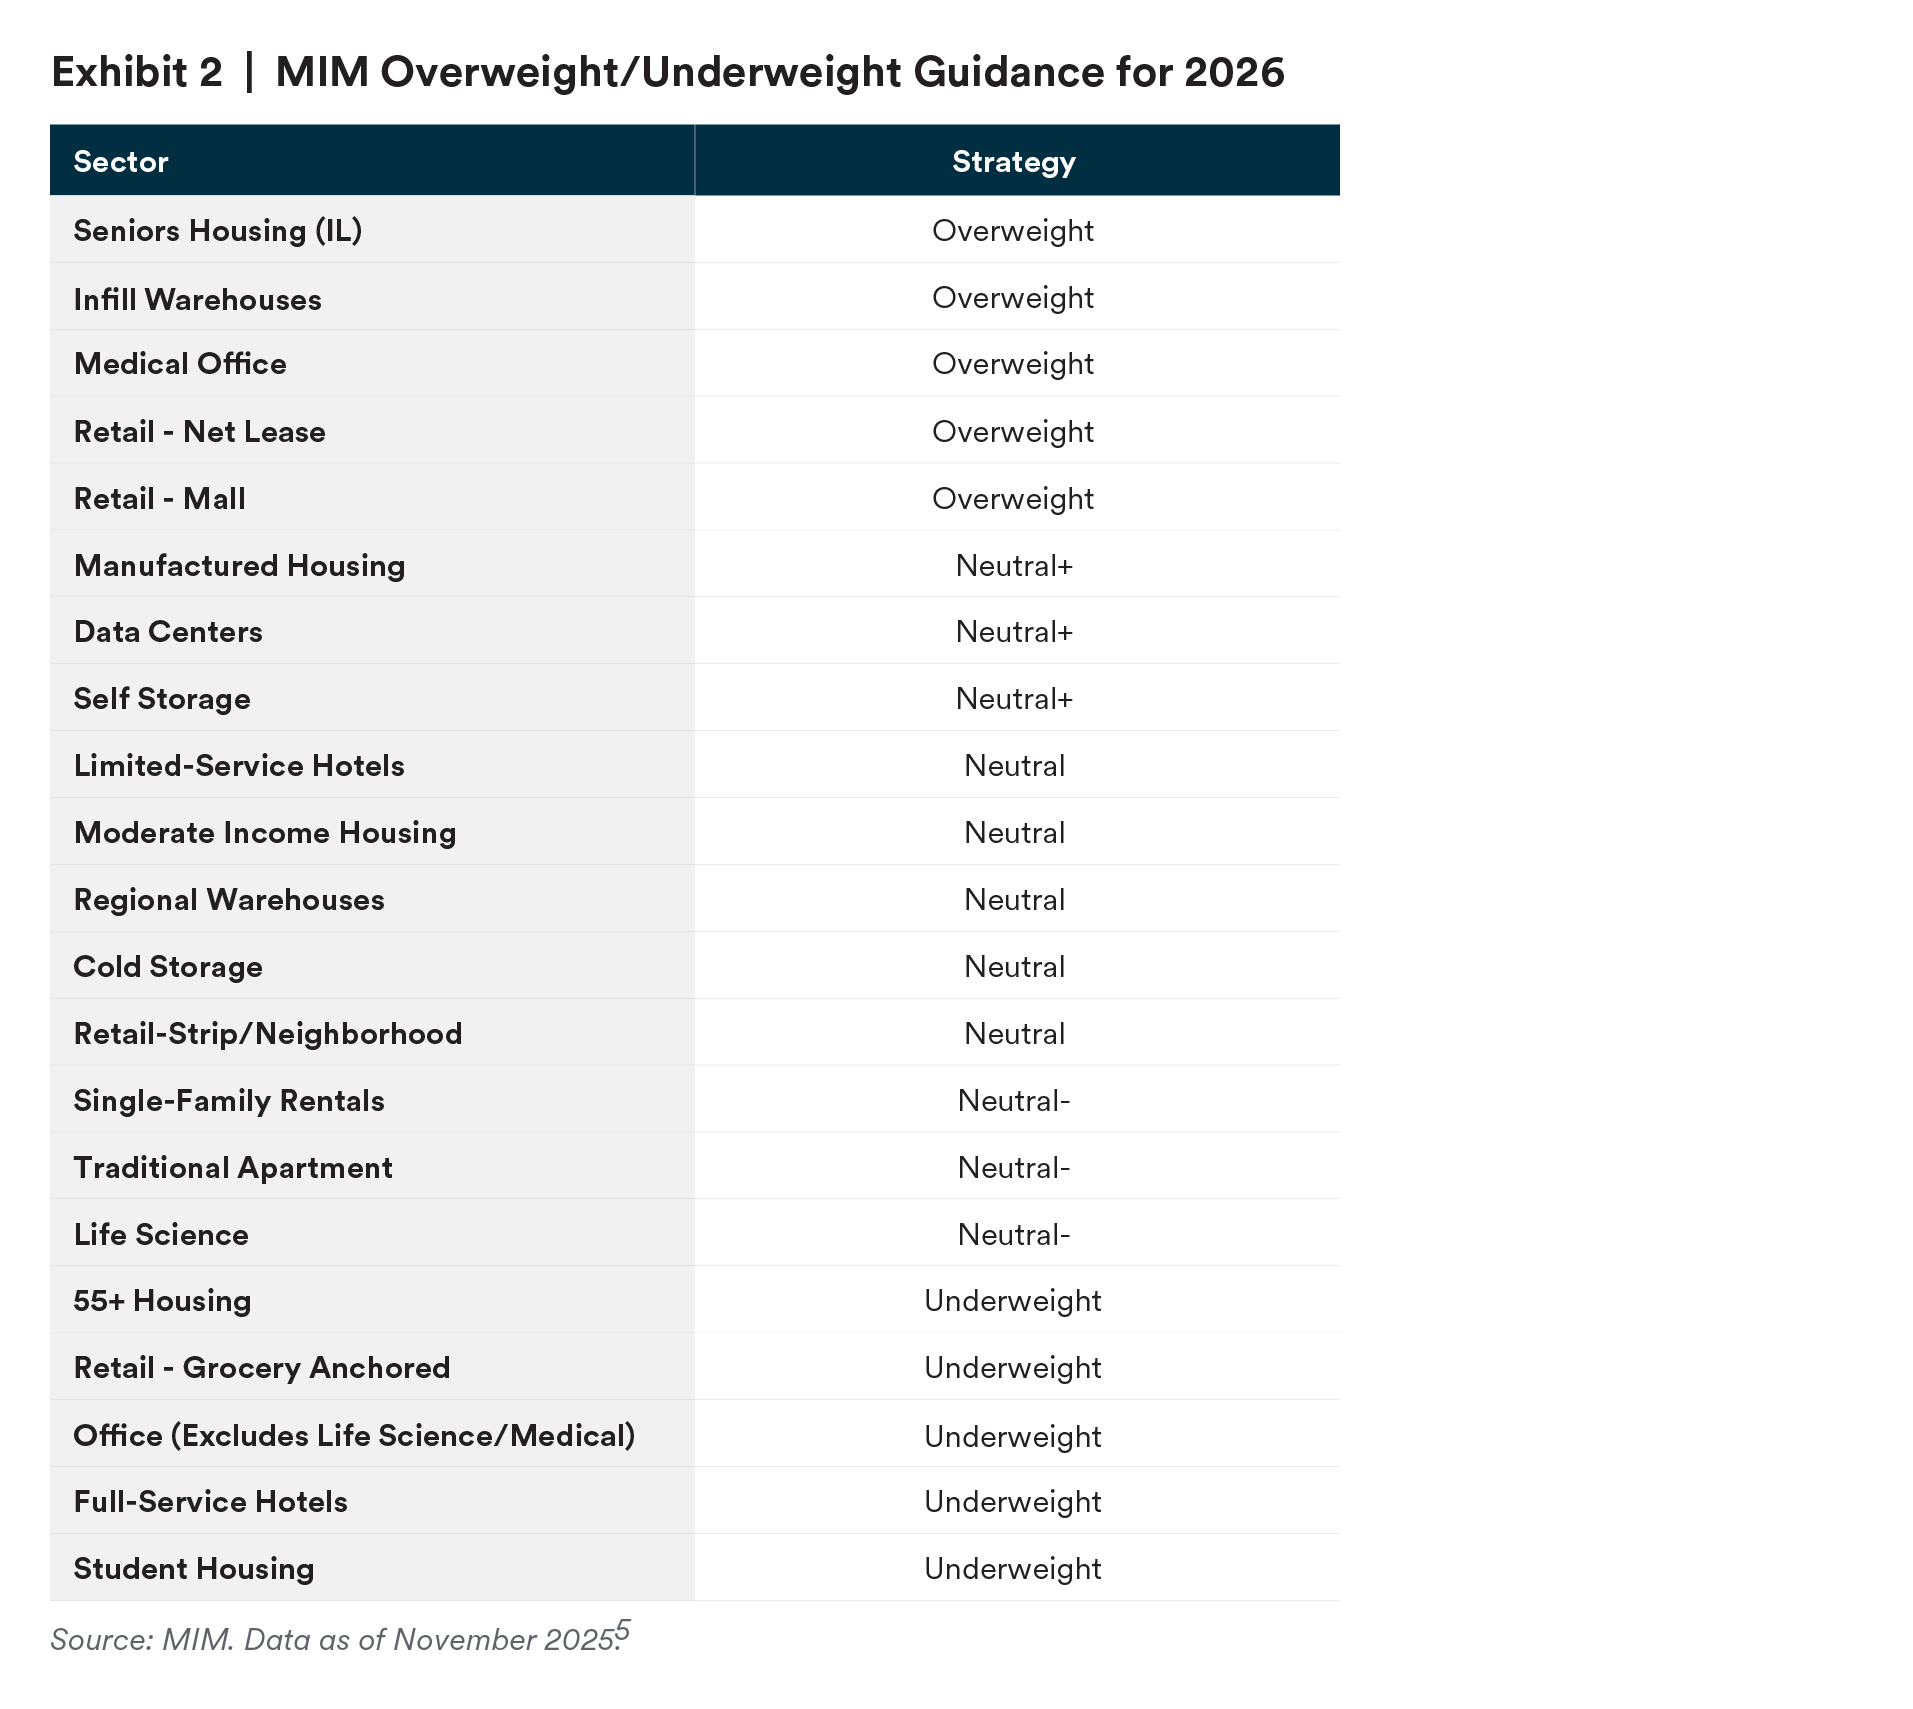
We update property type rankings monthly and assign ratings across 21 commercial real estate sectors for portfolio managers and select public reports.
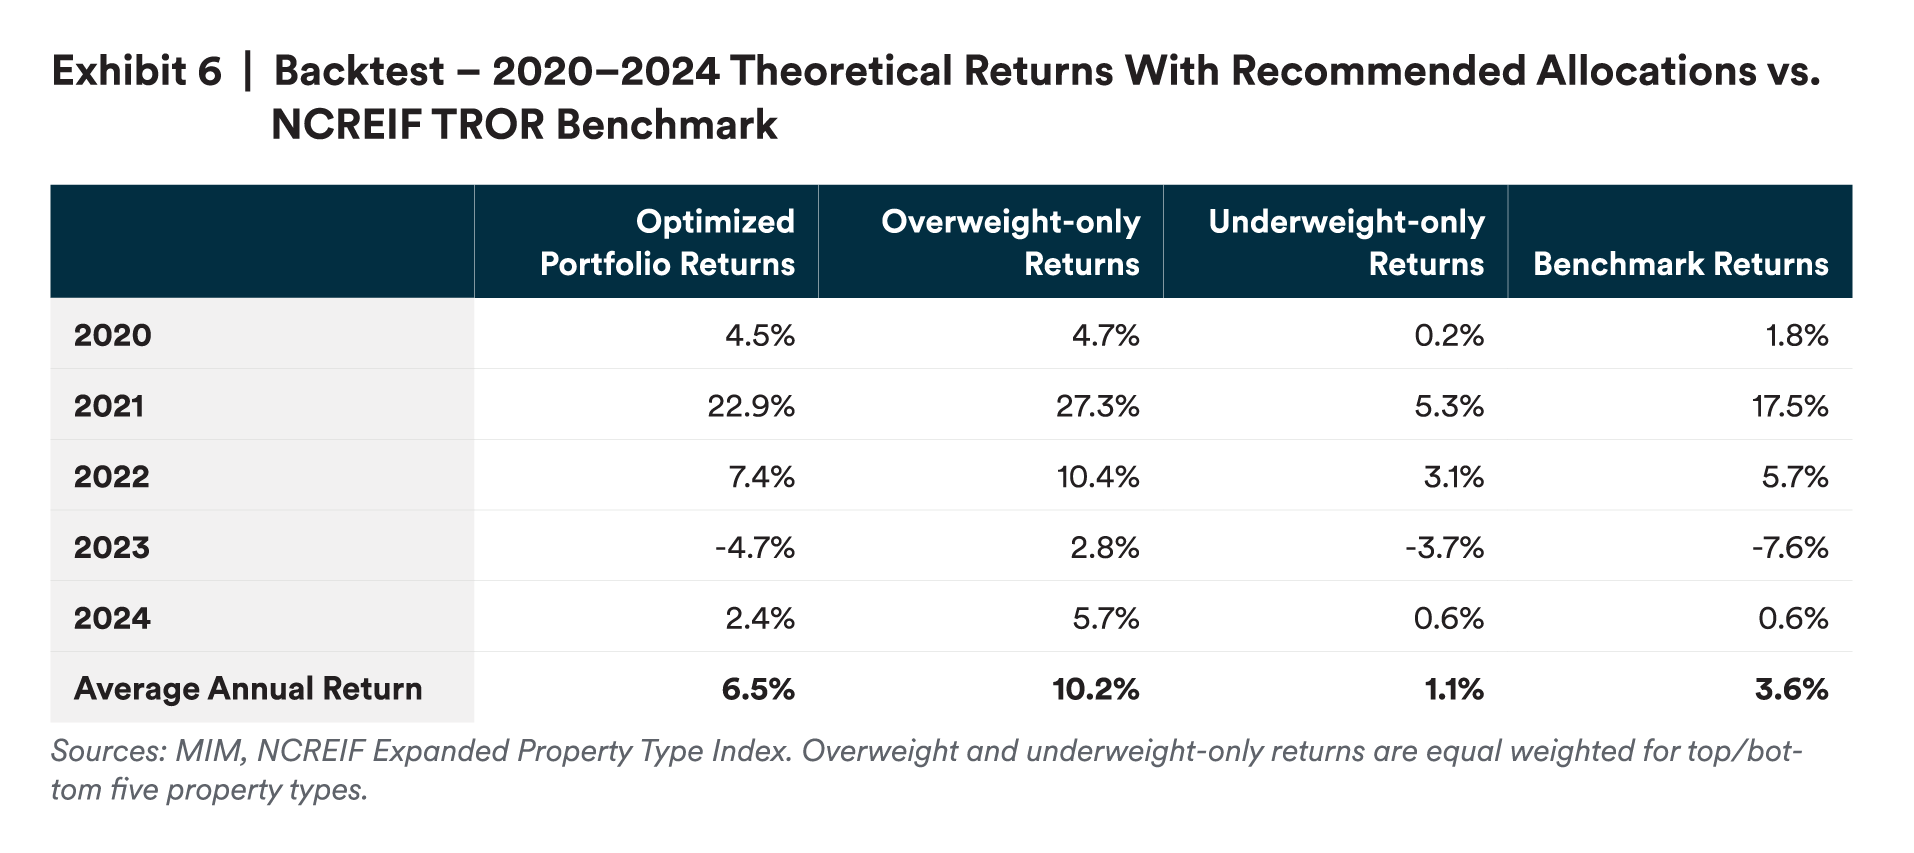
Each year, we also backtest the ratings. This year, we found:
- An unlevered portfolio modestly tilted toward overweight types, and away from underweight, would have returned 6.5% from 2020 to 2024, while the NCREIF Property Index (NPI) benchmark was 3.6%.
- Allocating only to overweight property types (equal weighted) would have resulted in an unlevered annualized return of 10.2% versus the 3.6% benchmark.
- Outperformance may be overstated, due to the assumption of immediate annual shifts, and understated because the analysis uses unlevered returns.
- Bear in mind that these returns are hypothetical and included for illustrative purposes only. They are not actual returns and are not indicative of future results.
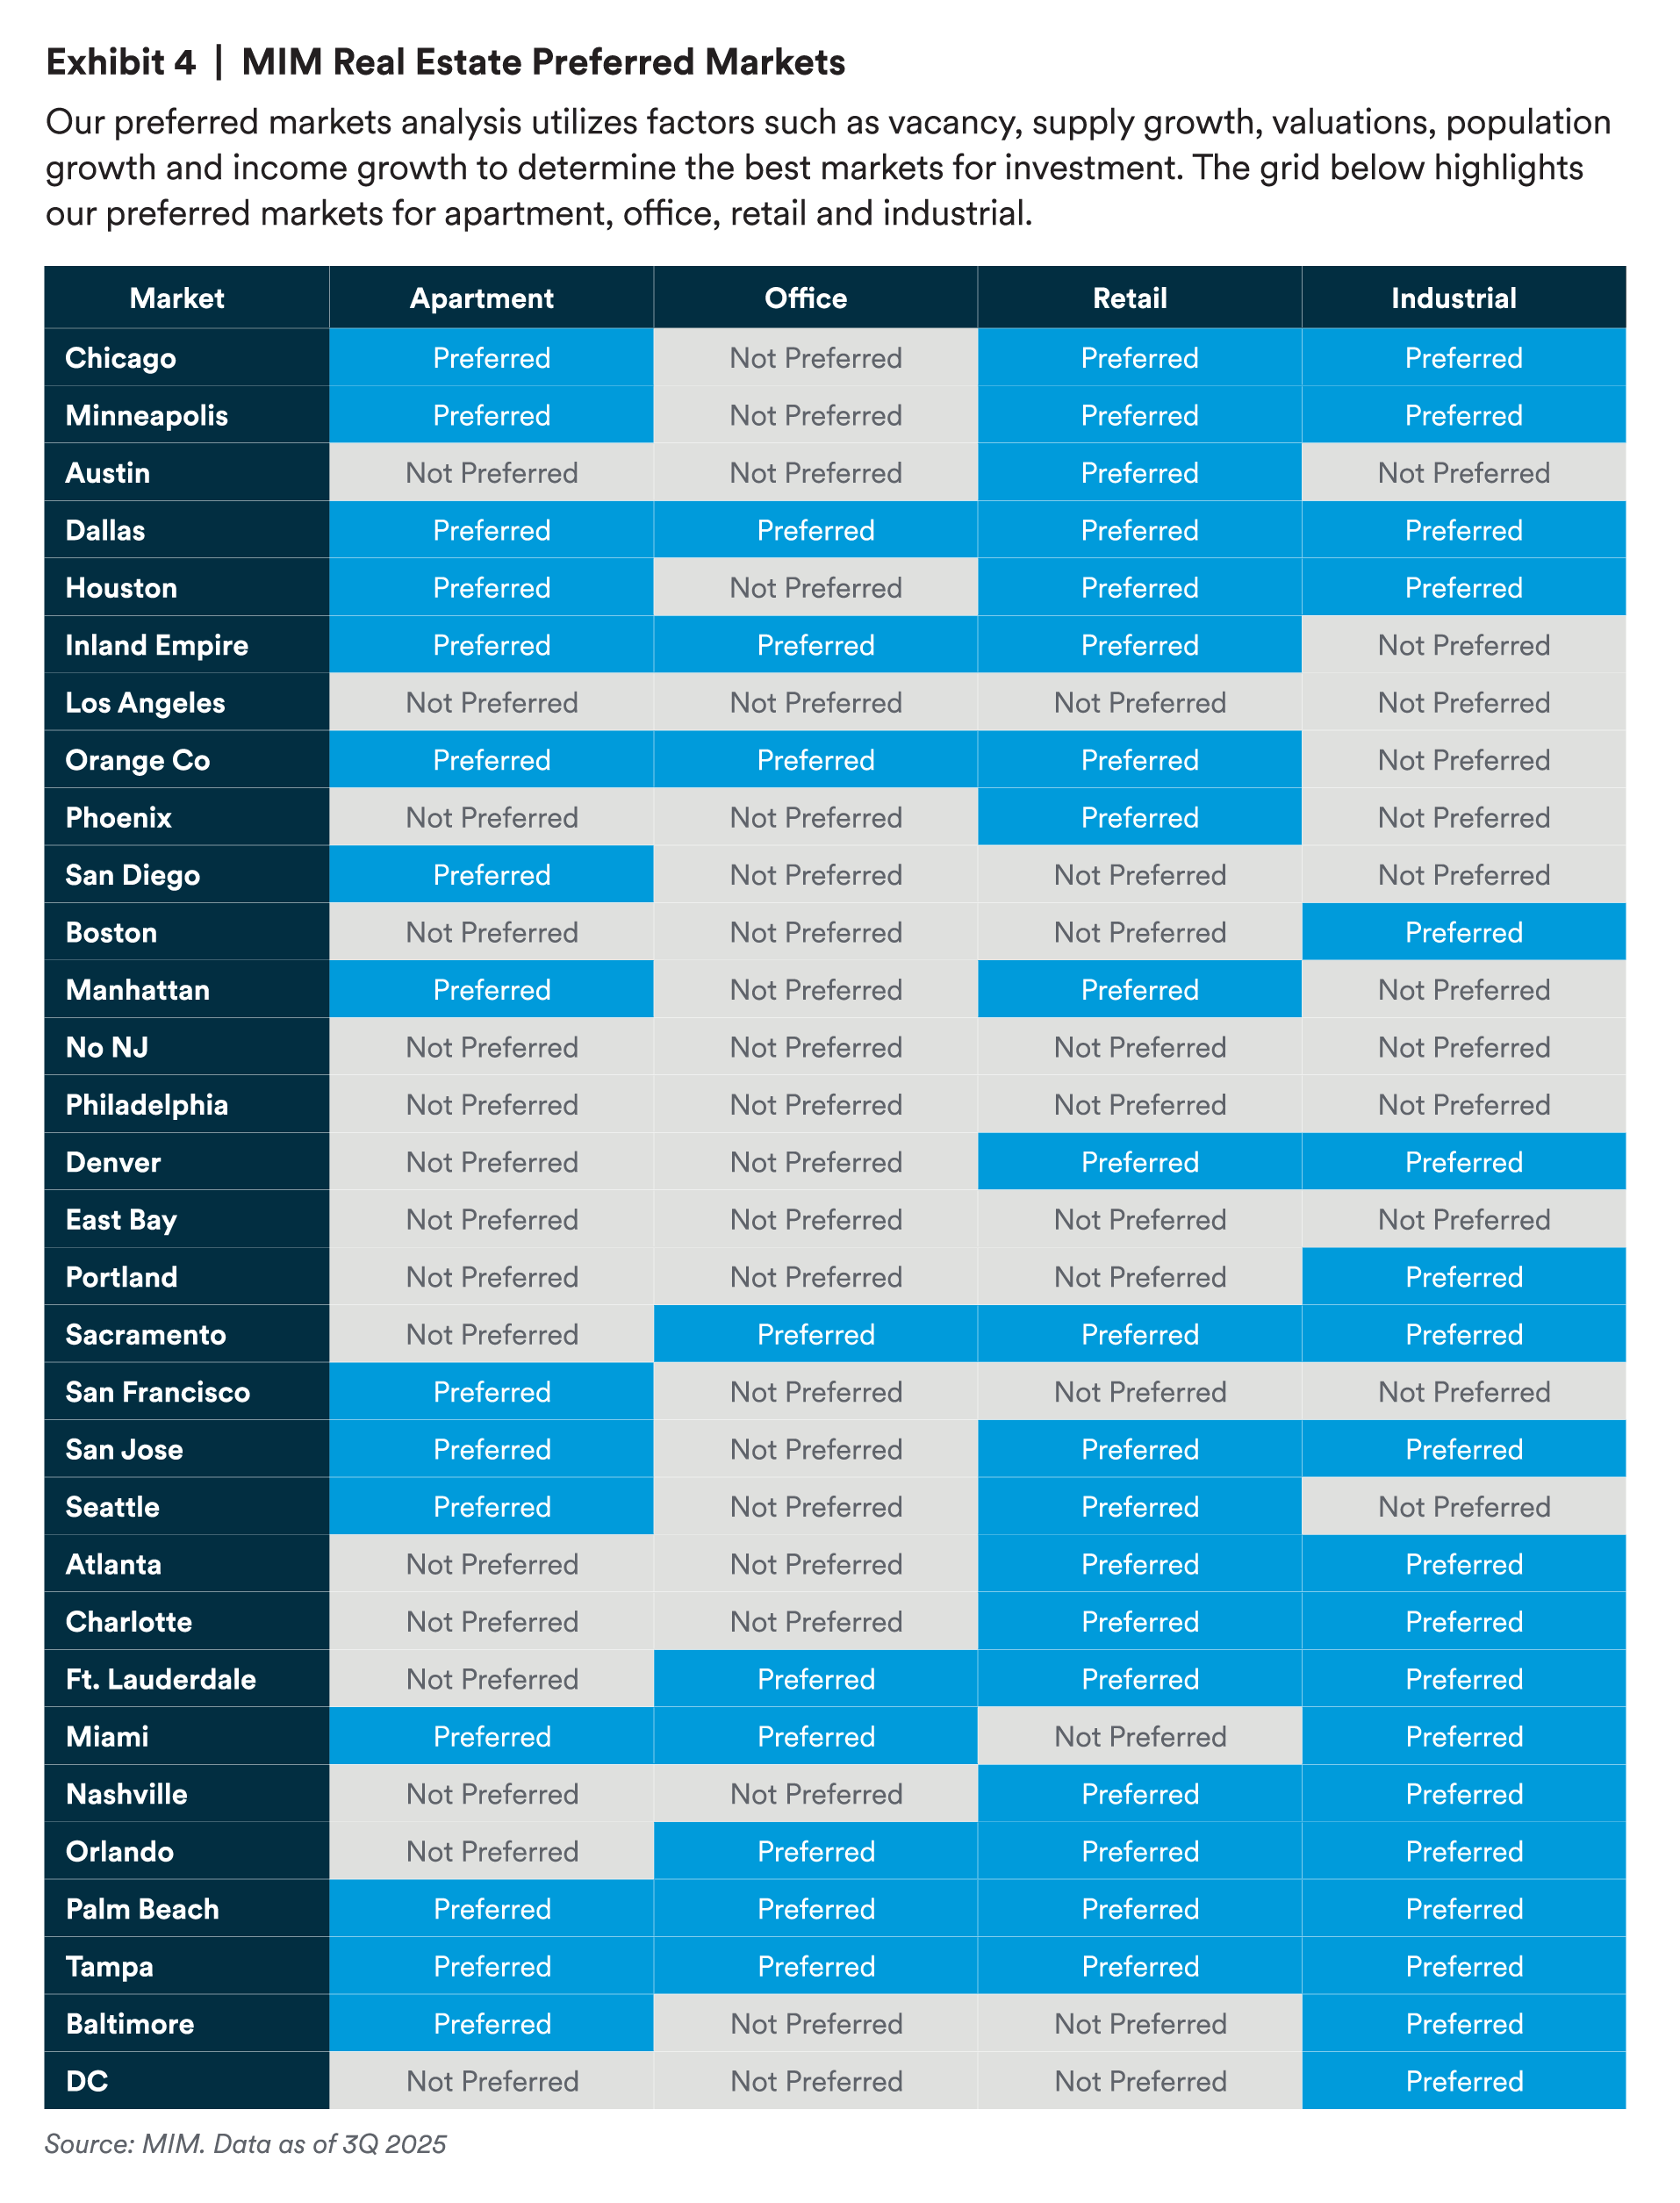
Backtesting isolates predictive signals. Our monthly regional survey and REIT options pricing have proven most reliable, while demographic shifts and cap rates offer limited value. Within each sector, we also believe there are important strategies to adopt or avoid. Leading into 2026, we have views on markets and sub-strategies within the multifamily, industrial, office and retail segments. To operationalize these sector views, we provide detailed guidance on the major property types.
We begin with multifamily, where supply-demand dynamics and market selection remain central to performance. The multifamily sector has seen strong demand but continues to face elevated supply, particularly in Sun Belt markets. We believe national apartment vacancy is at its peak and will gradually lower throughout 2026, aided by a continuing slowdown in construction. Renter demand will be supported by high homeownership costs.
High Conviction:
- Stabilized multifamily in supply-constrained markets such as Chicago, San Francisco, New York, Palm Beach, Tampa, Seattle, Orange County and San Diego. There may be opportunities to acquire Class A assets below replacement cost in markets where vacancy is tight.
- Multifamily development in low-supply, high-barrier markets. Similarly, markets that are supply constrained also present development opportunities.
Caution:
- Oversupplied multifamily markets such as Austin, Charlotte, Nashville, Denver, Phoenix and Atlanta. Aggressive underwriting persists despite elevated vacancy rates and flat-to-negative net effective rent growth. Federal immigration reform further impedes the recovery in fundamentals.
- Value-add apartments. Deals are being priced with aggressive rent growth assumptions, particularly in the Sun Belt. Investor competition for these assets is high.
Industrial has been a top performing sector for the past decade, but now supply is outpacing demand. Despite trade uncertainty, net absorption is expected to pick up in 2026 with vacancy peaking around the middle of the year.
High Conviction:
- Industrial with medium WALT. Longer weighted-average lease term (WALT) is now favorable given softened fundamentals and pricing. Acquire assets with below-market rents and mark to market in years five to seven.
Caution:
- Industrial with lower WALT. Pricing is too aggressive on industrial properties with short-dated WALTs. Vacancy is also rising in the industrial sector, particularly in the southern U.S.
Signs of recovery have emerged in the office sector. The national average vacancy rate has fallen by 30 basis points (bps) since the start of the year, reaching 18.7%6. In 3Q, net absorption (new leased space minus space being given up) was the strongest in four years, reaching over 14 million square feet.7 We expect to see continued improvement in the office sector over the next year, though B & C office will lag higher-quality product. Investors prefer assets with longer WALTs, as in-place rents may exceed market rents.
One of the most counterintuitive findings we’ve had in the last year is that properties with subleased space have been outperforming assets with leased, but physically underutilized space. In MIM’s debt and equity office portfolios, our worst investments have been in those with physically vacant space, while those with subleased space have somewhat consistently surprised to the upside by converting the subleases into long-term leases.
High Conviction:
- Higher-quality office assets. There are compelling yields for well-located, well-appointed assets, especially in markets with strong talent clusters.
- Repositioning existing office stock. In markets where prime office supply is low, there are opportunities to upgrade A/A- stock into A+.
- High conviction in preferred office markets based on pricing and fundamentals.
- Primary: Dallas, Orange County, Sacramento, Fort Lauderdale, Miami, Orlando, Palm Beach, Tampa.
- Secondary: Cincinnati, Louisville, Las Vegas, Providence, Norfolk.
Caution:
- Investors and investment managers materially underestimate the costs required to keep a building current and leased. This trend predates the pandemic and has persisted for at least three decades.
- Office to multifamily conversion. These are large deals, and assets are difficult to reposition. Many transactions have aggressive underwriting assumptions.
The retail sector continues to see vacancies near historic lows, driven by a healthy consumer and a dearth of new supply over the past decade.
High Conviction:
- Neighborhood centers and unanchored strip. Selectively acquire exceptional centers in high demographic areas with lower CapEx drag. Accretive debt is available at acquisition.
Caution:
- Grocery-anchored retail. There is a significant premium for having a grocer in a retail center. Grocery-anchored retail centers are exposed to anchor tenant risk, particularly due to Wal-Mart expansion and rising e-grocery adoption.
Beyond the core property types, several other sectors present distinct opportunities and risks for 2026.
High Conviction:
- Defensive income. Medical office, net-lease retail, net-lease industrial and self-storage.
- Senior housing. Demographic trends are favorable for the sector, and there has been very little new supply added in recent years. Asset pricing is favorable.
- Data centers. Strong demand from AI-driven workloads, robust connectivity needs and projected revenue growth of ~7% compound annual growth rate (CAGR) make this sector compelling. Strategic markets like Dallas, Northern Virginia and Chicago also offer attractive pricing. While technological obsolescence and a slowdown in AI funding are risks, these risks are largely idiosyncratic and not strongly correlated with broader economic cycles. According to Modern Portfolio Theory, assets with distinct risk drivers, such as data centers, provide diversification benefits within a mixed real estate portfolio. This allocation can enhance risk-adjusted returns by reducing overall portfolio volatility, even if individual sector risks remain. Additional considerations include potential oversupply, regulatory hurdles and cost volatility from tariffs and urban site constraints.
Caution:
Student housing. Demographic trends are not favorable for the sector as the population of college-age students is declining. Construction pipelines are also concerning across many college campuses. Although this may seem contradictory, we maintain a favorable view for debt investment in student housing. For lending, our focus is on larger universities with strong enrollment and high barriers to entry.
- Our focus is on larger universities with strong enrollment and high barriers to entry.
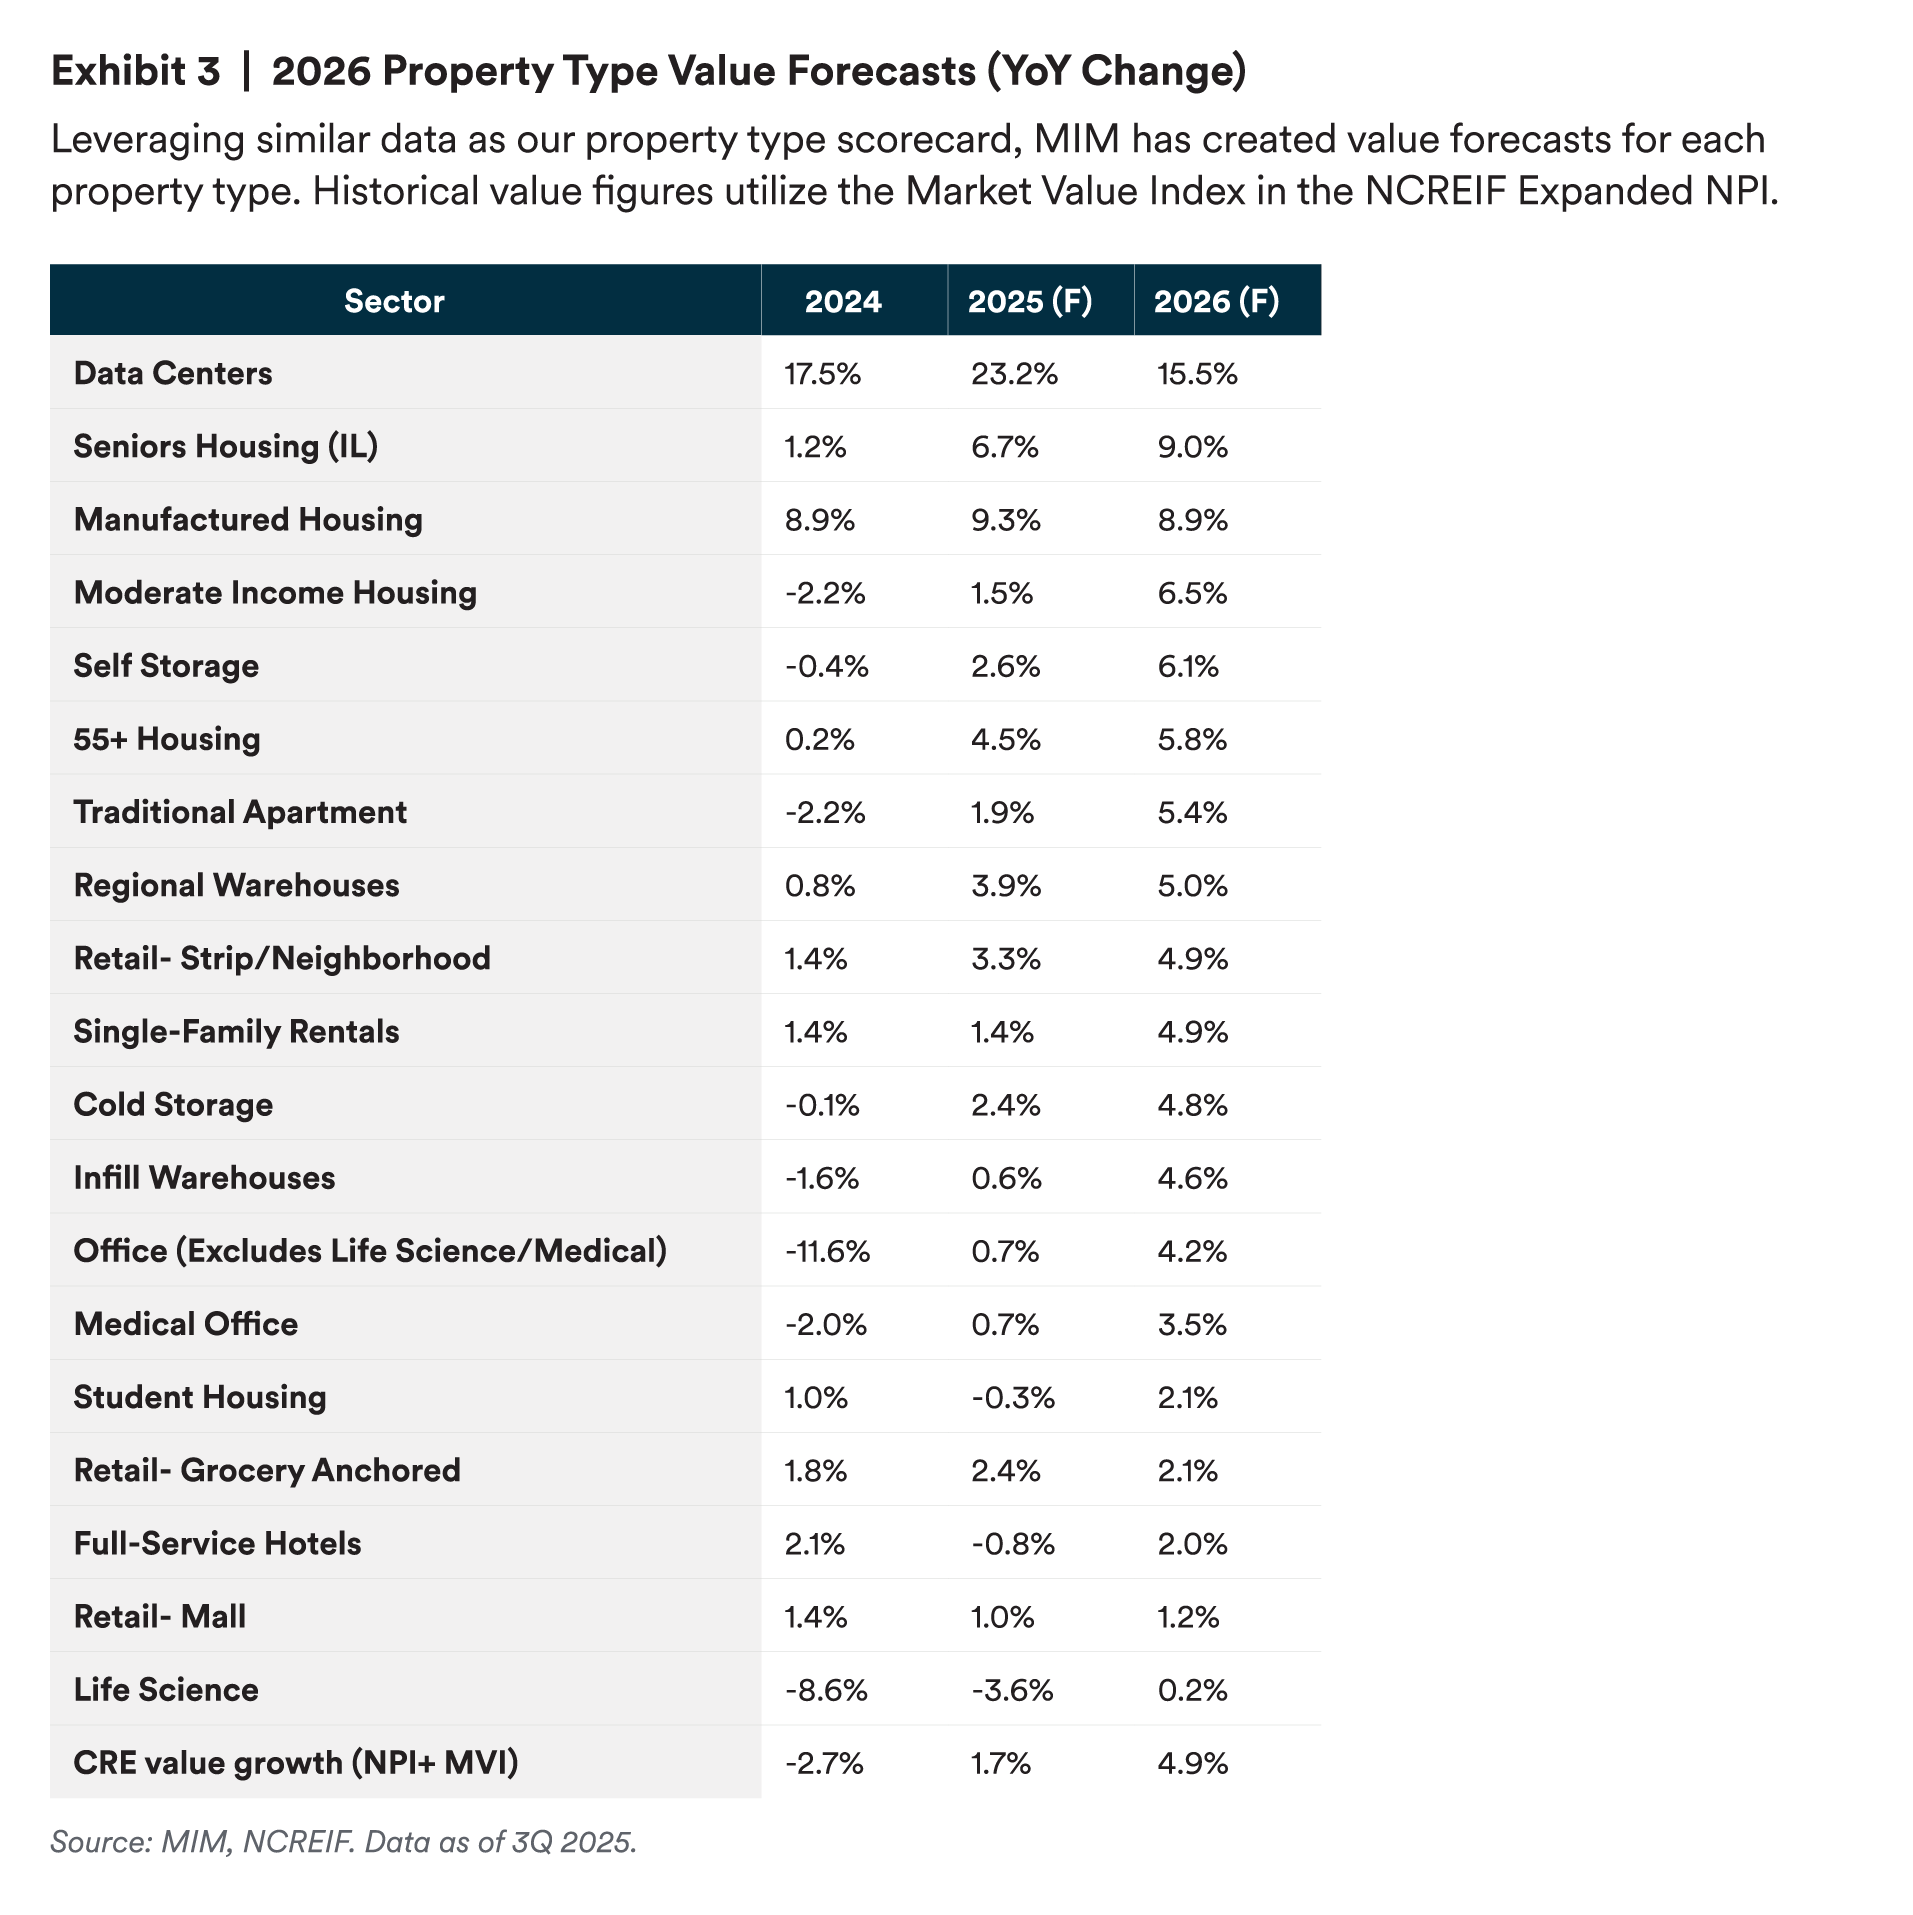
With sector-level guidance established, the following appendix provides supporting forecasts and quantitative detail for reference.