Put simply, a CLO is a portfolio of predominantly leveraged loans that is securitized and managed as a fund. The assets are typically senior secured loans, which benefit from priority of payment over other claimants in the event of an insolvency. Each CLO is structured as a series of tranches that are interest-paying bonds, along with a small portion of equity, which receives excess payments.
CLOs originated in the late 1980s, similar to other types of securitizations, as a way for banks to package leveraged loans together to provide investors with an investment vehicle with varied degrees of risk and return to best suit their investment objectives. The first vintage of “modern” CLOs—which focused on generating income via cash flows—was issued starting in the mid- to late-1990s. Commonly known as “CLO 1.0,” this vintage included some high yield bonds, as well as loans, and was the standard CLO structure until the financial crisis struck in 2008.
The next vintage, CLO 2.0, began in 2010 and changed in response to the financial crisis by strengthening credit support and shortening the period in which loan interest and proceeds could be reinvested into additional loans.
The current vintage, CLO 3.0, began in 2014 and aimed to further reduce risk by eliminating high yield bonds and adhering to the Volcker Rule and other new regulations. In 2020, the Volcker Rule was further amended, and high yield bonds were allowed back into CLOs. Currently, CLOs that allow for investments into high yield generally limit the exposure to 5%-10%. To compensate for the exposure to high yield, these CLOs have increased levels of subordination to better protect debt tranches.
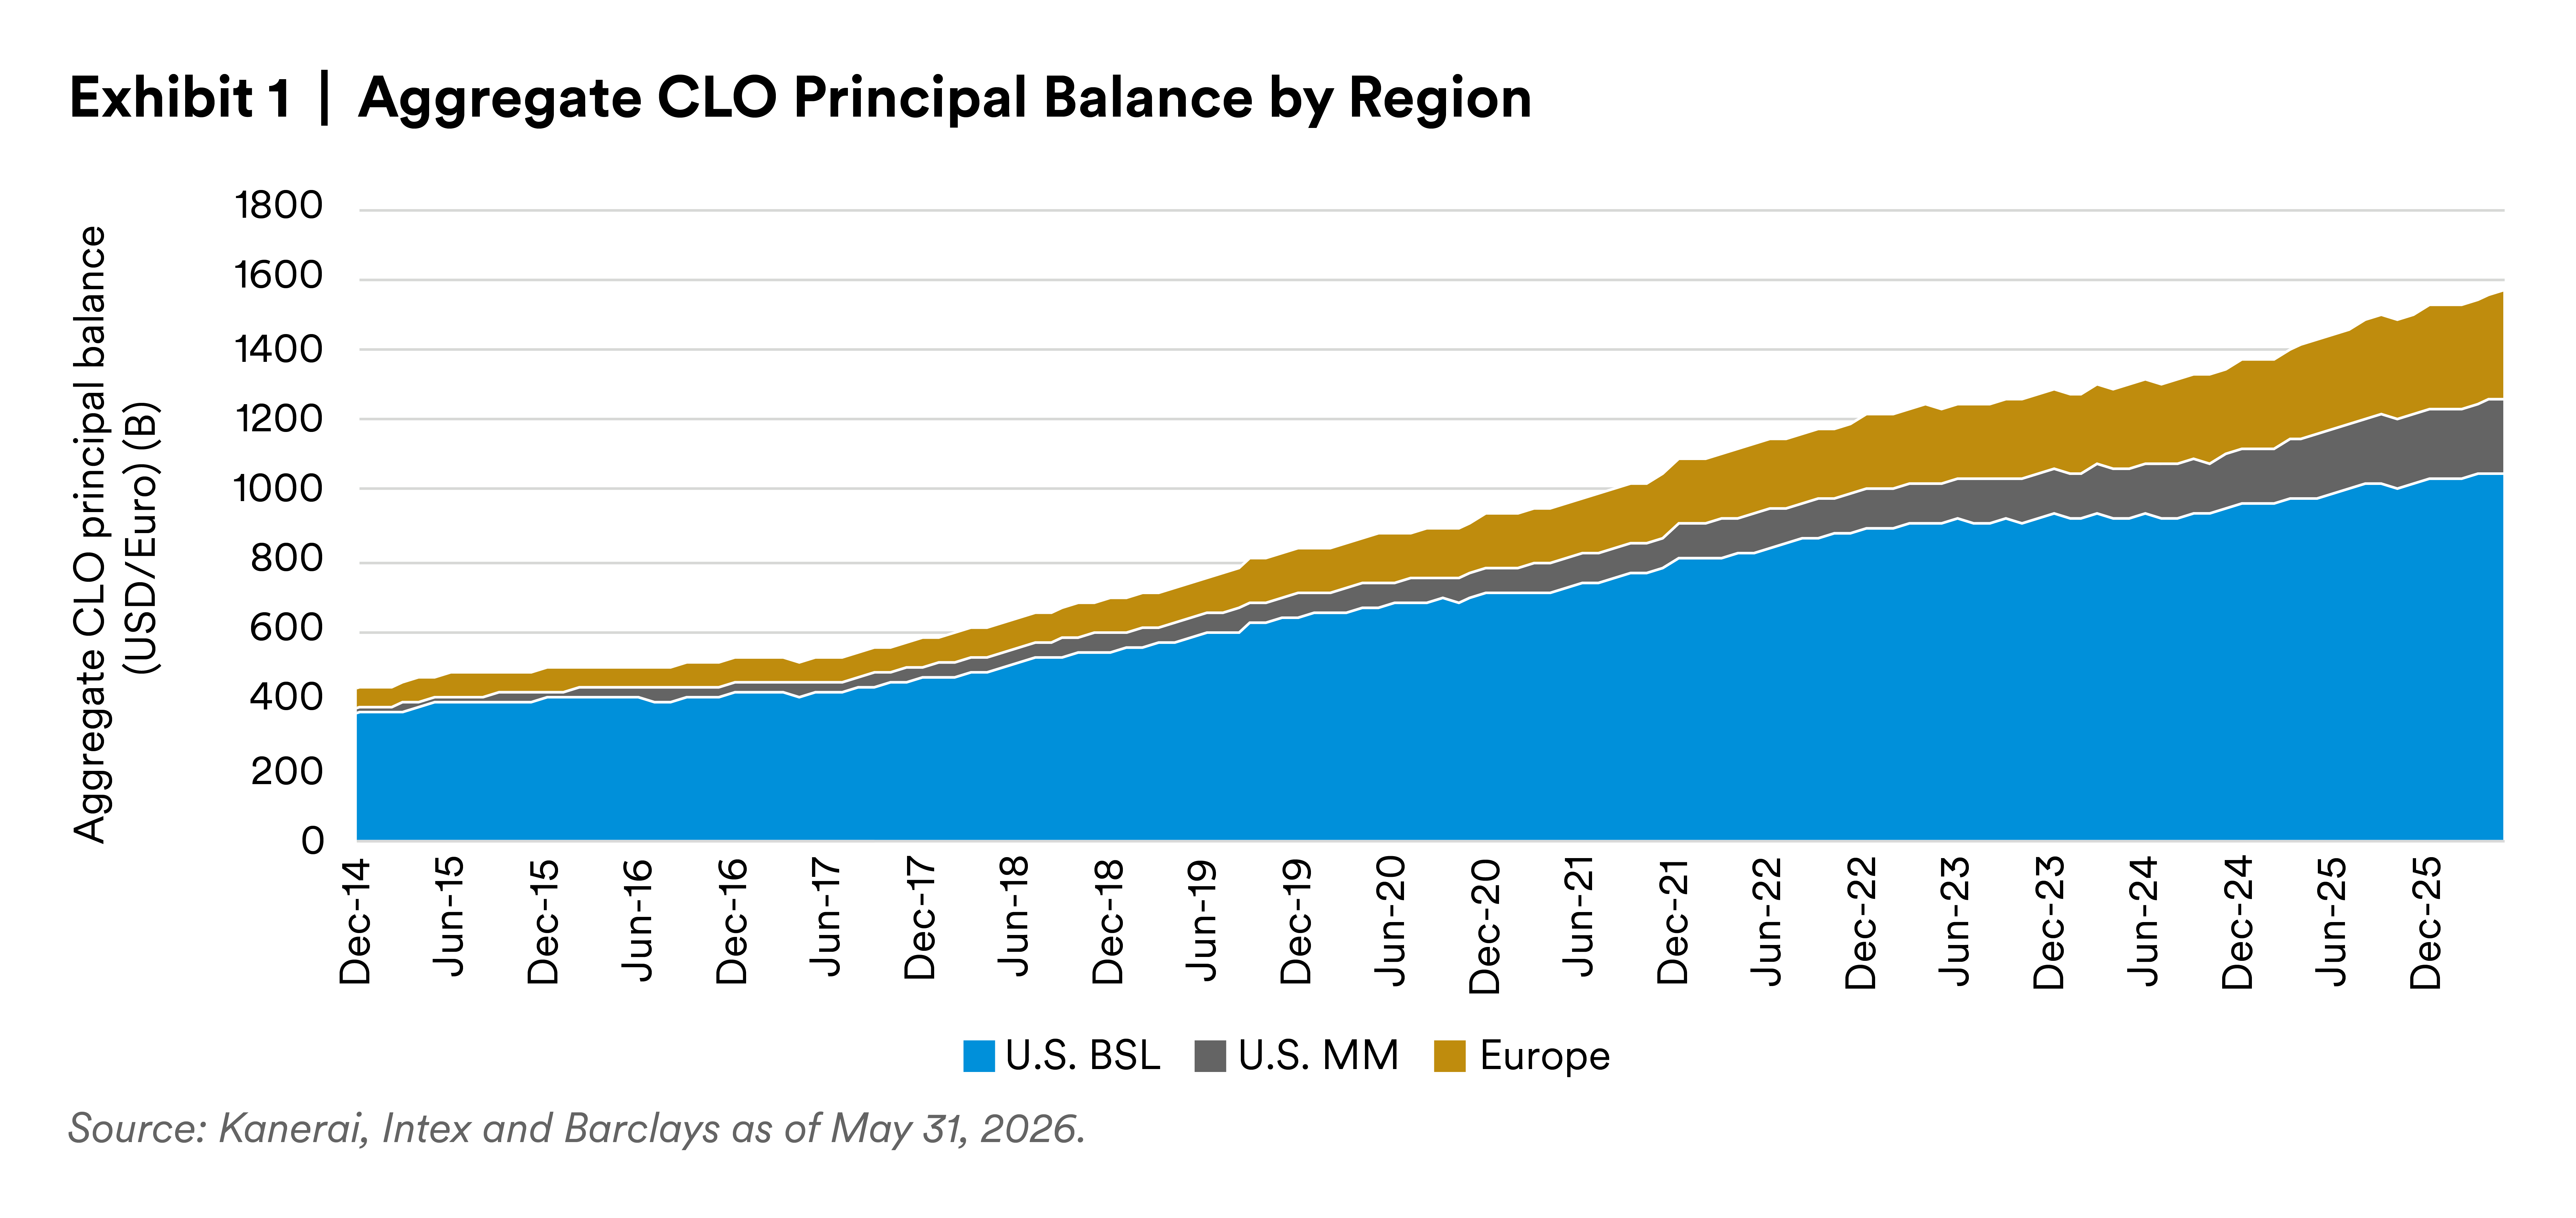
In the US, vintages 2.0 and 3.0 represent nearly the entire market (Exhibit 1), with over $1.2 trillion in principal outstanding, while less than 0.05% of the market remains in CLO 1.0 vintages.2 In Europe, the entire €300 billion market is represented by vintage 2.0 CLOs.3
The vast majority of CLOs are called “arbitrage CLOs” because they aim to capture the excess spread between the portfolio of leveraged bank loans (assets) and the classes of CLO debt (liabilities), with the equity investors receiving any excess cash flows after the debt investors are paid. The market for arbitrage broadly syndicated loan (BSL) CLOs is valued at $1.4 trillion globally, with about 75% issued in the U.S. and 25% in Europe.4
Leveraged loans are more than simply the underlying collateral for CLOs: They’re the fuel that powers CLOs’ attractive income streams and the first of several levels of potential risk mitigation built into the CLO structure.
Leveraged loans are typically defined as senior secured loans rated BB+ or lower (i.e., below investment grade) or yielding at least 125 basis points (bps) above a benchmark interest rate (typically SOFR in the U.S. and Euribor in Europe) and secured by a first or second lien.5 Several characteristics make leveraged loans particularly suitable for securitizations. They:
- Pay interest on a consistent monthly or quarterly basis;
- Trade in a highly liquid secondary market;
- Have a historically high recovery rate in the event of default; and
- Originate from a large, diversified group of issuers.
As of May 31, 2026, the amount of leveraged loans outstanding was $1.55 trillion in the U.S. and €352 billion in Europe.6
CLOs are issued and managed by asset managers. Of the approximately 230 CLO managers7 with post-crisis deals under management worldwide, we have found that about two-thirds are in the U.S. and the remaining third are in Europe.
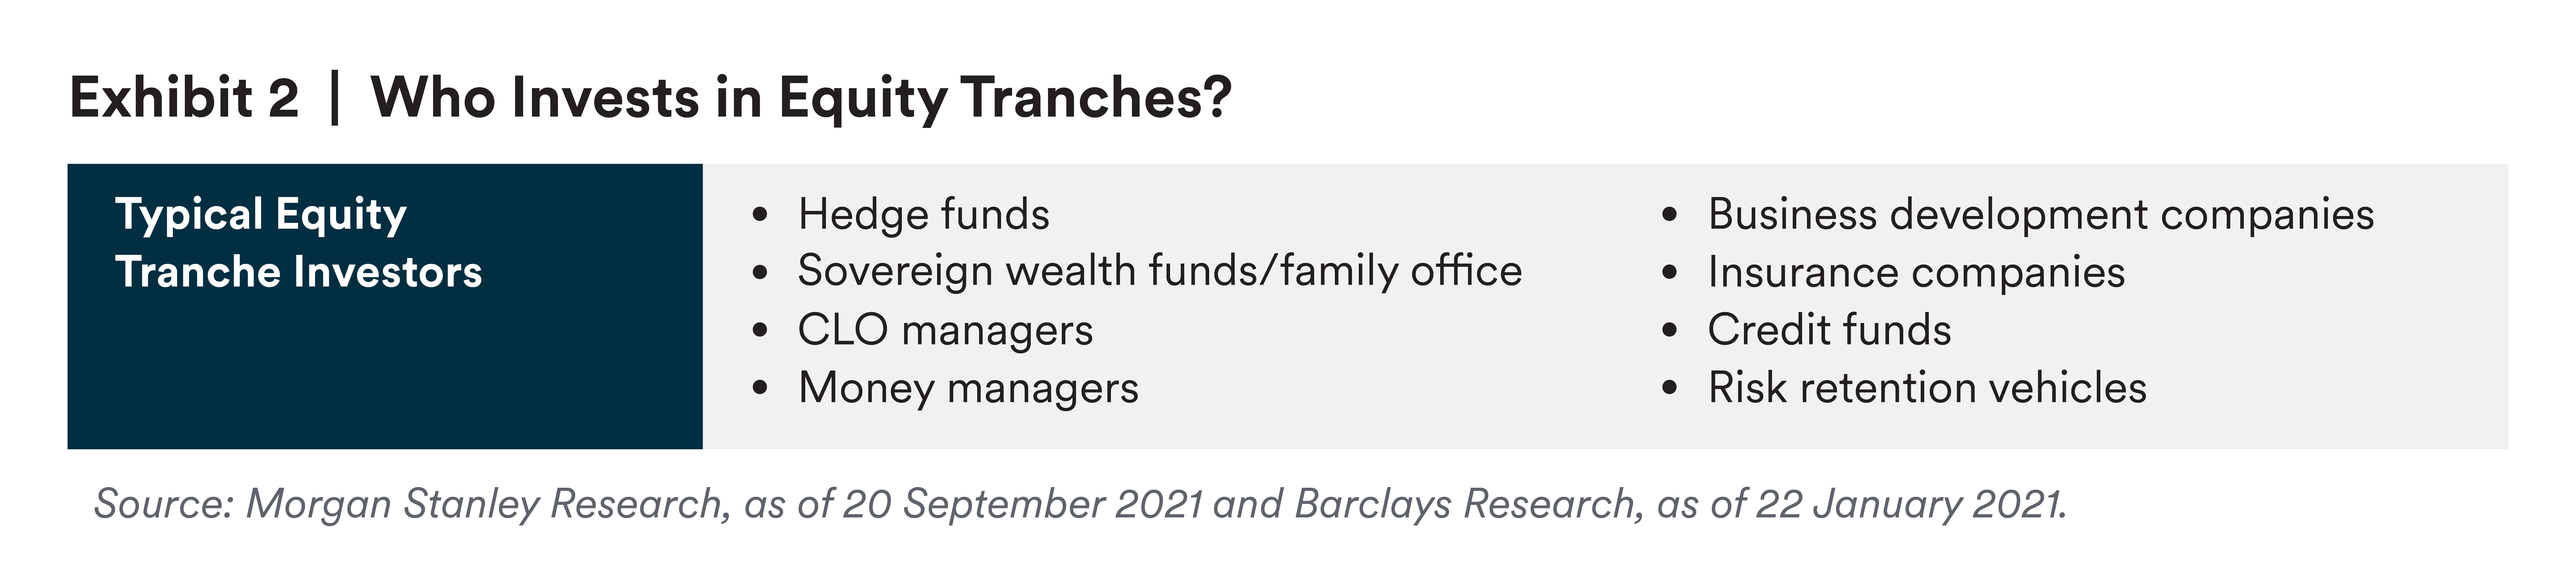
Ownership of CLOs varies by tranche. The least risky, senior-most tranches are mainly owned by insurance companies (which favor income-producing investments) as well as banks (which need high-quality capital to meet regulatory requirements). Foreign investors, primarily based out of Japan, are also a significant source of demand for AAA rated CLO tranches. Demand for investment-grade-rated mezzanine tranches is dominated by insurance companies, but asset manager participation is also meaningful given the pickup in yield relative to tranches at the top of the capital stack. Lower mezzanine tranches tend to attract investors with higher risk tolerance and return requirements, such as money managers, hedge funds and credit funds. The equity tranche carries the most risk, offers potential upside and a degree of control, and appeals to a wider universe of investors, including hedge funds, sovereign wealth funds, family offices, CLO managers and money managers (Exhibit 2).
In addition to the traditional institutional investor base, over the past several years the CLO market has opened to retail investors through a rapidly growing ETF market. While ETFs make up only 4%-5% of the total U.S. BSL CLO market, ETFs have ballooned from approximately $2 billion at the start of 2023 to over $49 billion by the middle of 2026,8 with growth expected to continue.
CLOs are complex structures that combine multiple elements with the goal of generating an above-average return via income and capital appreciation. They consist of tranches that hold the underlying loans, which typically account for about 90% of total assets, and a sliver of equity (Exhibit 3). The tranches are ranked highest to lowest in order of credit quality, asset size and income stream—and, thus, lowest to highest in order of riskiness.
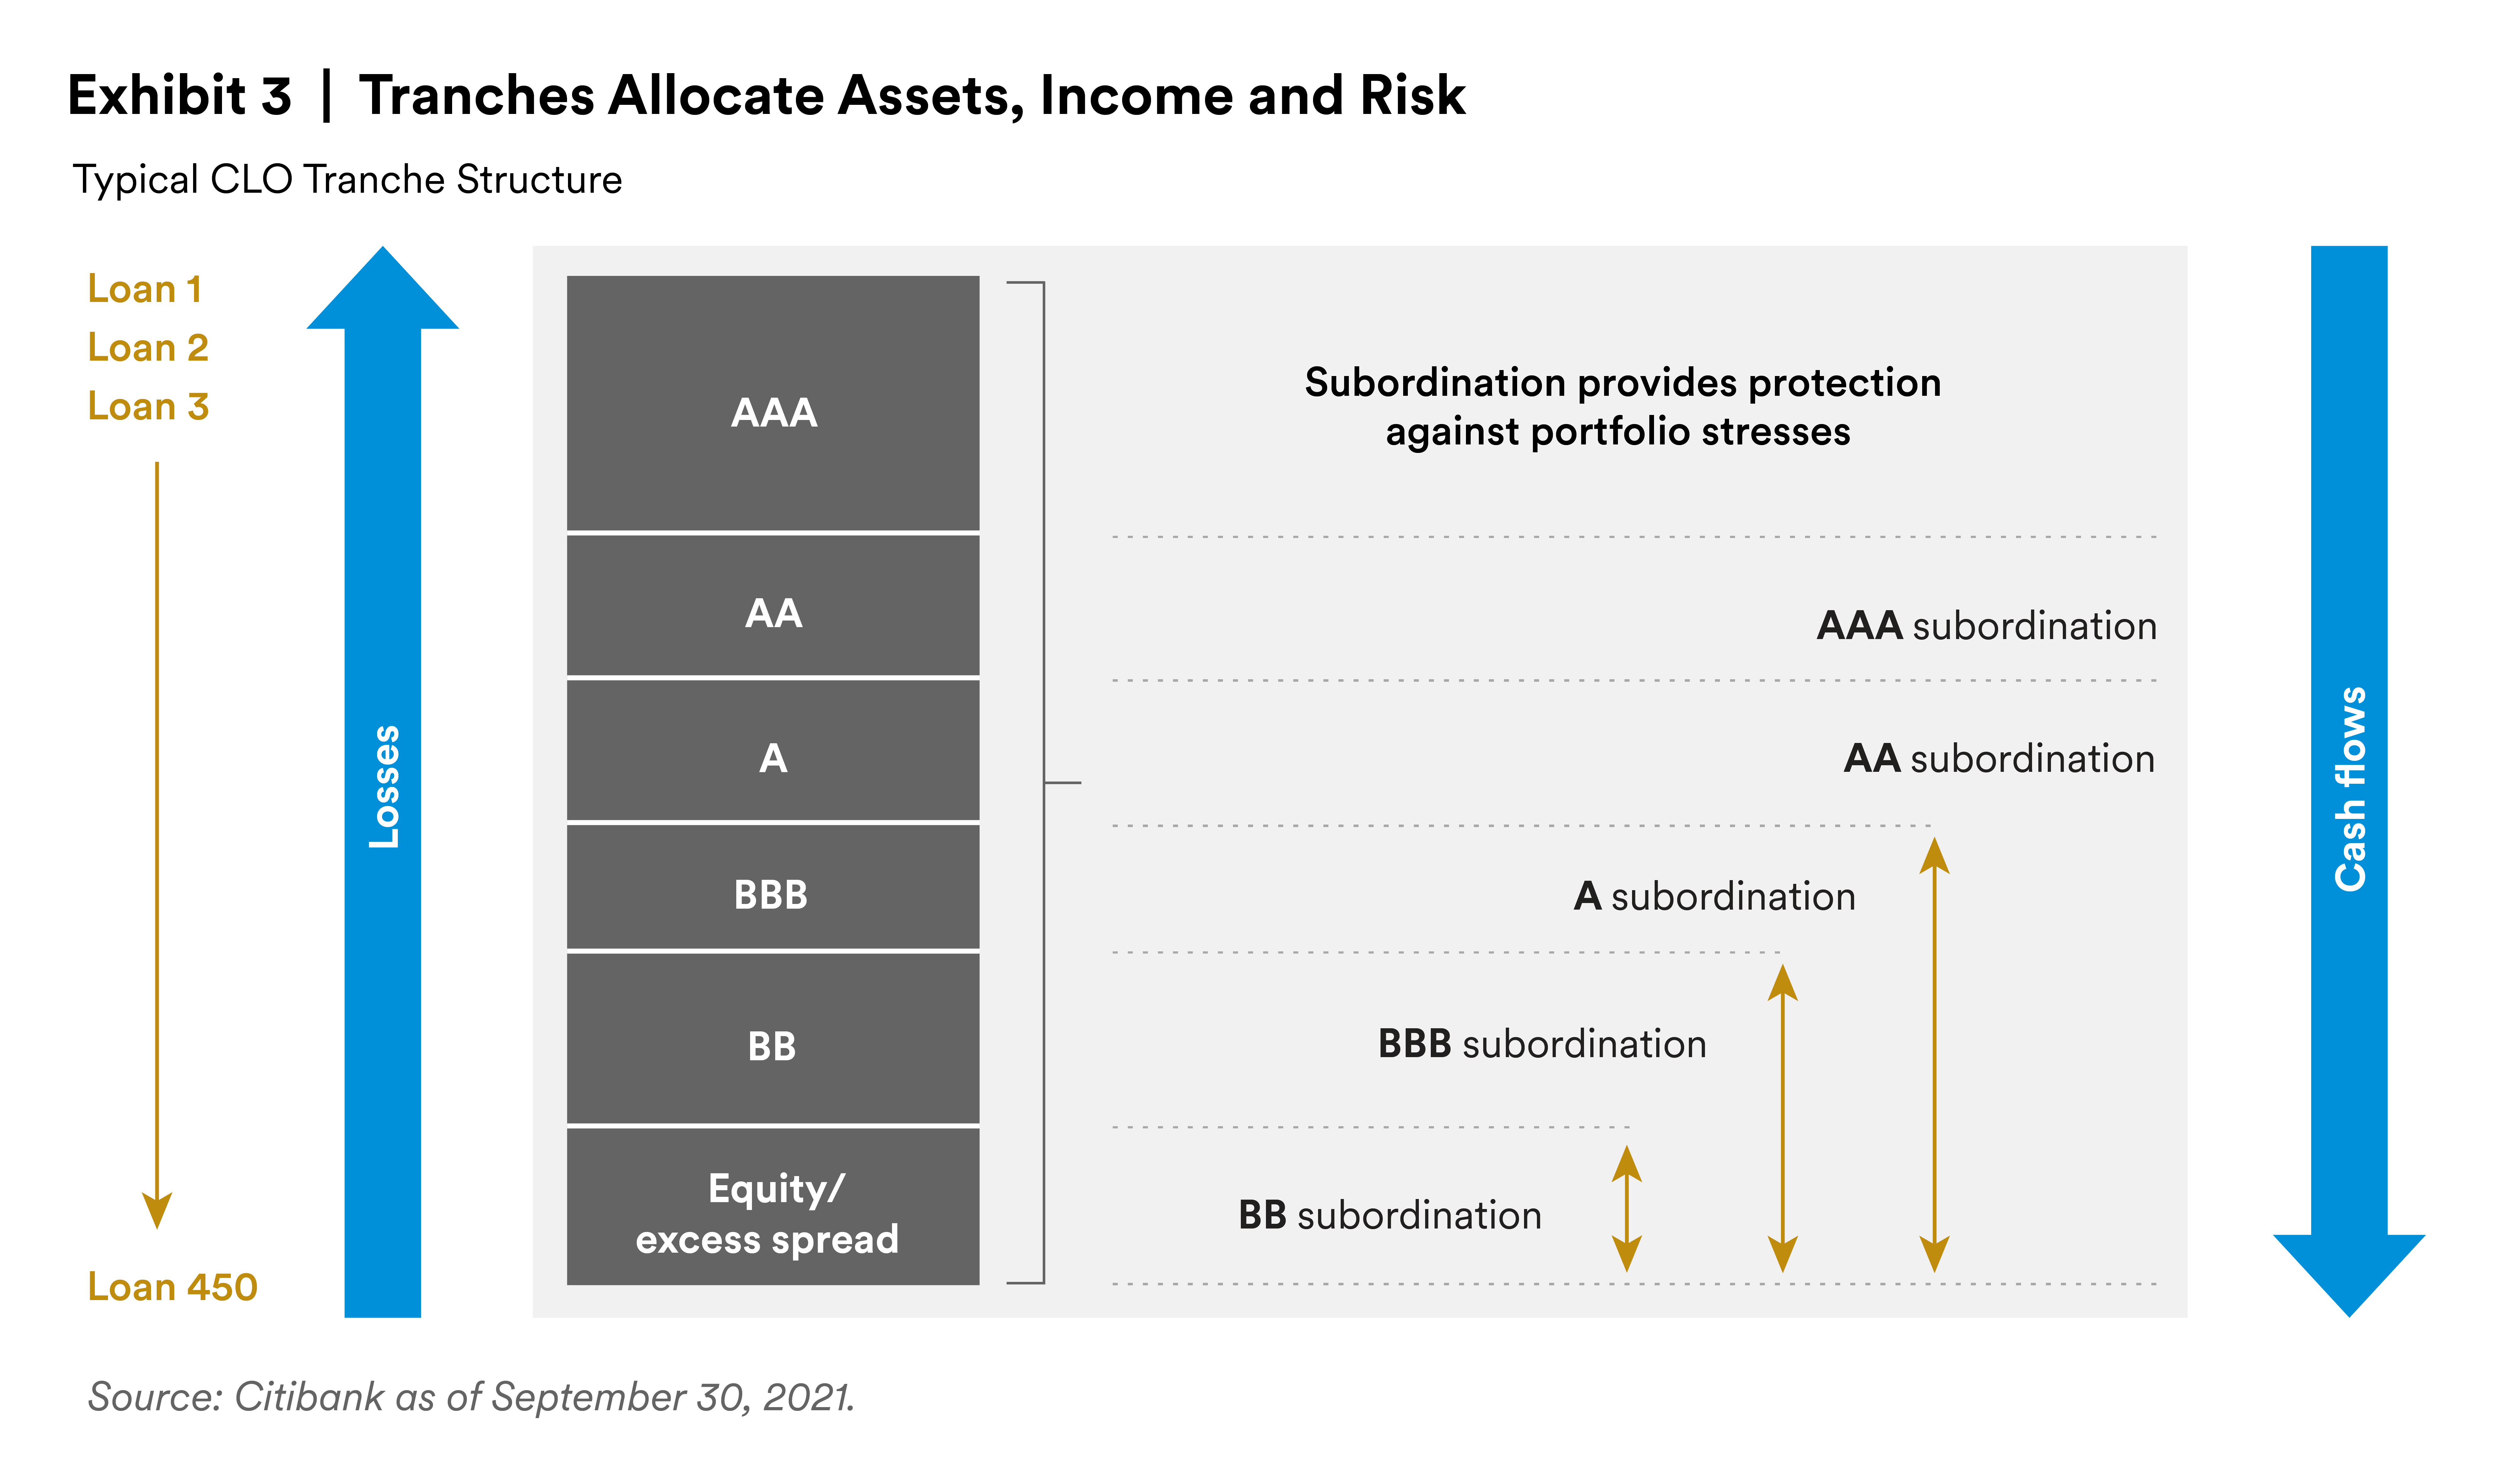
Although leveraged loans themselves are rated below investment grade, most CLO tranches are rated investment grade, benefiting from diversification, credit enhancements and subordination of cash flows.
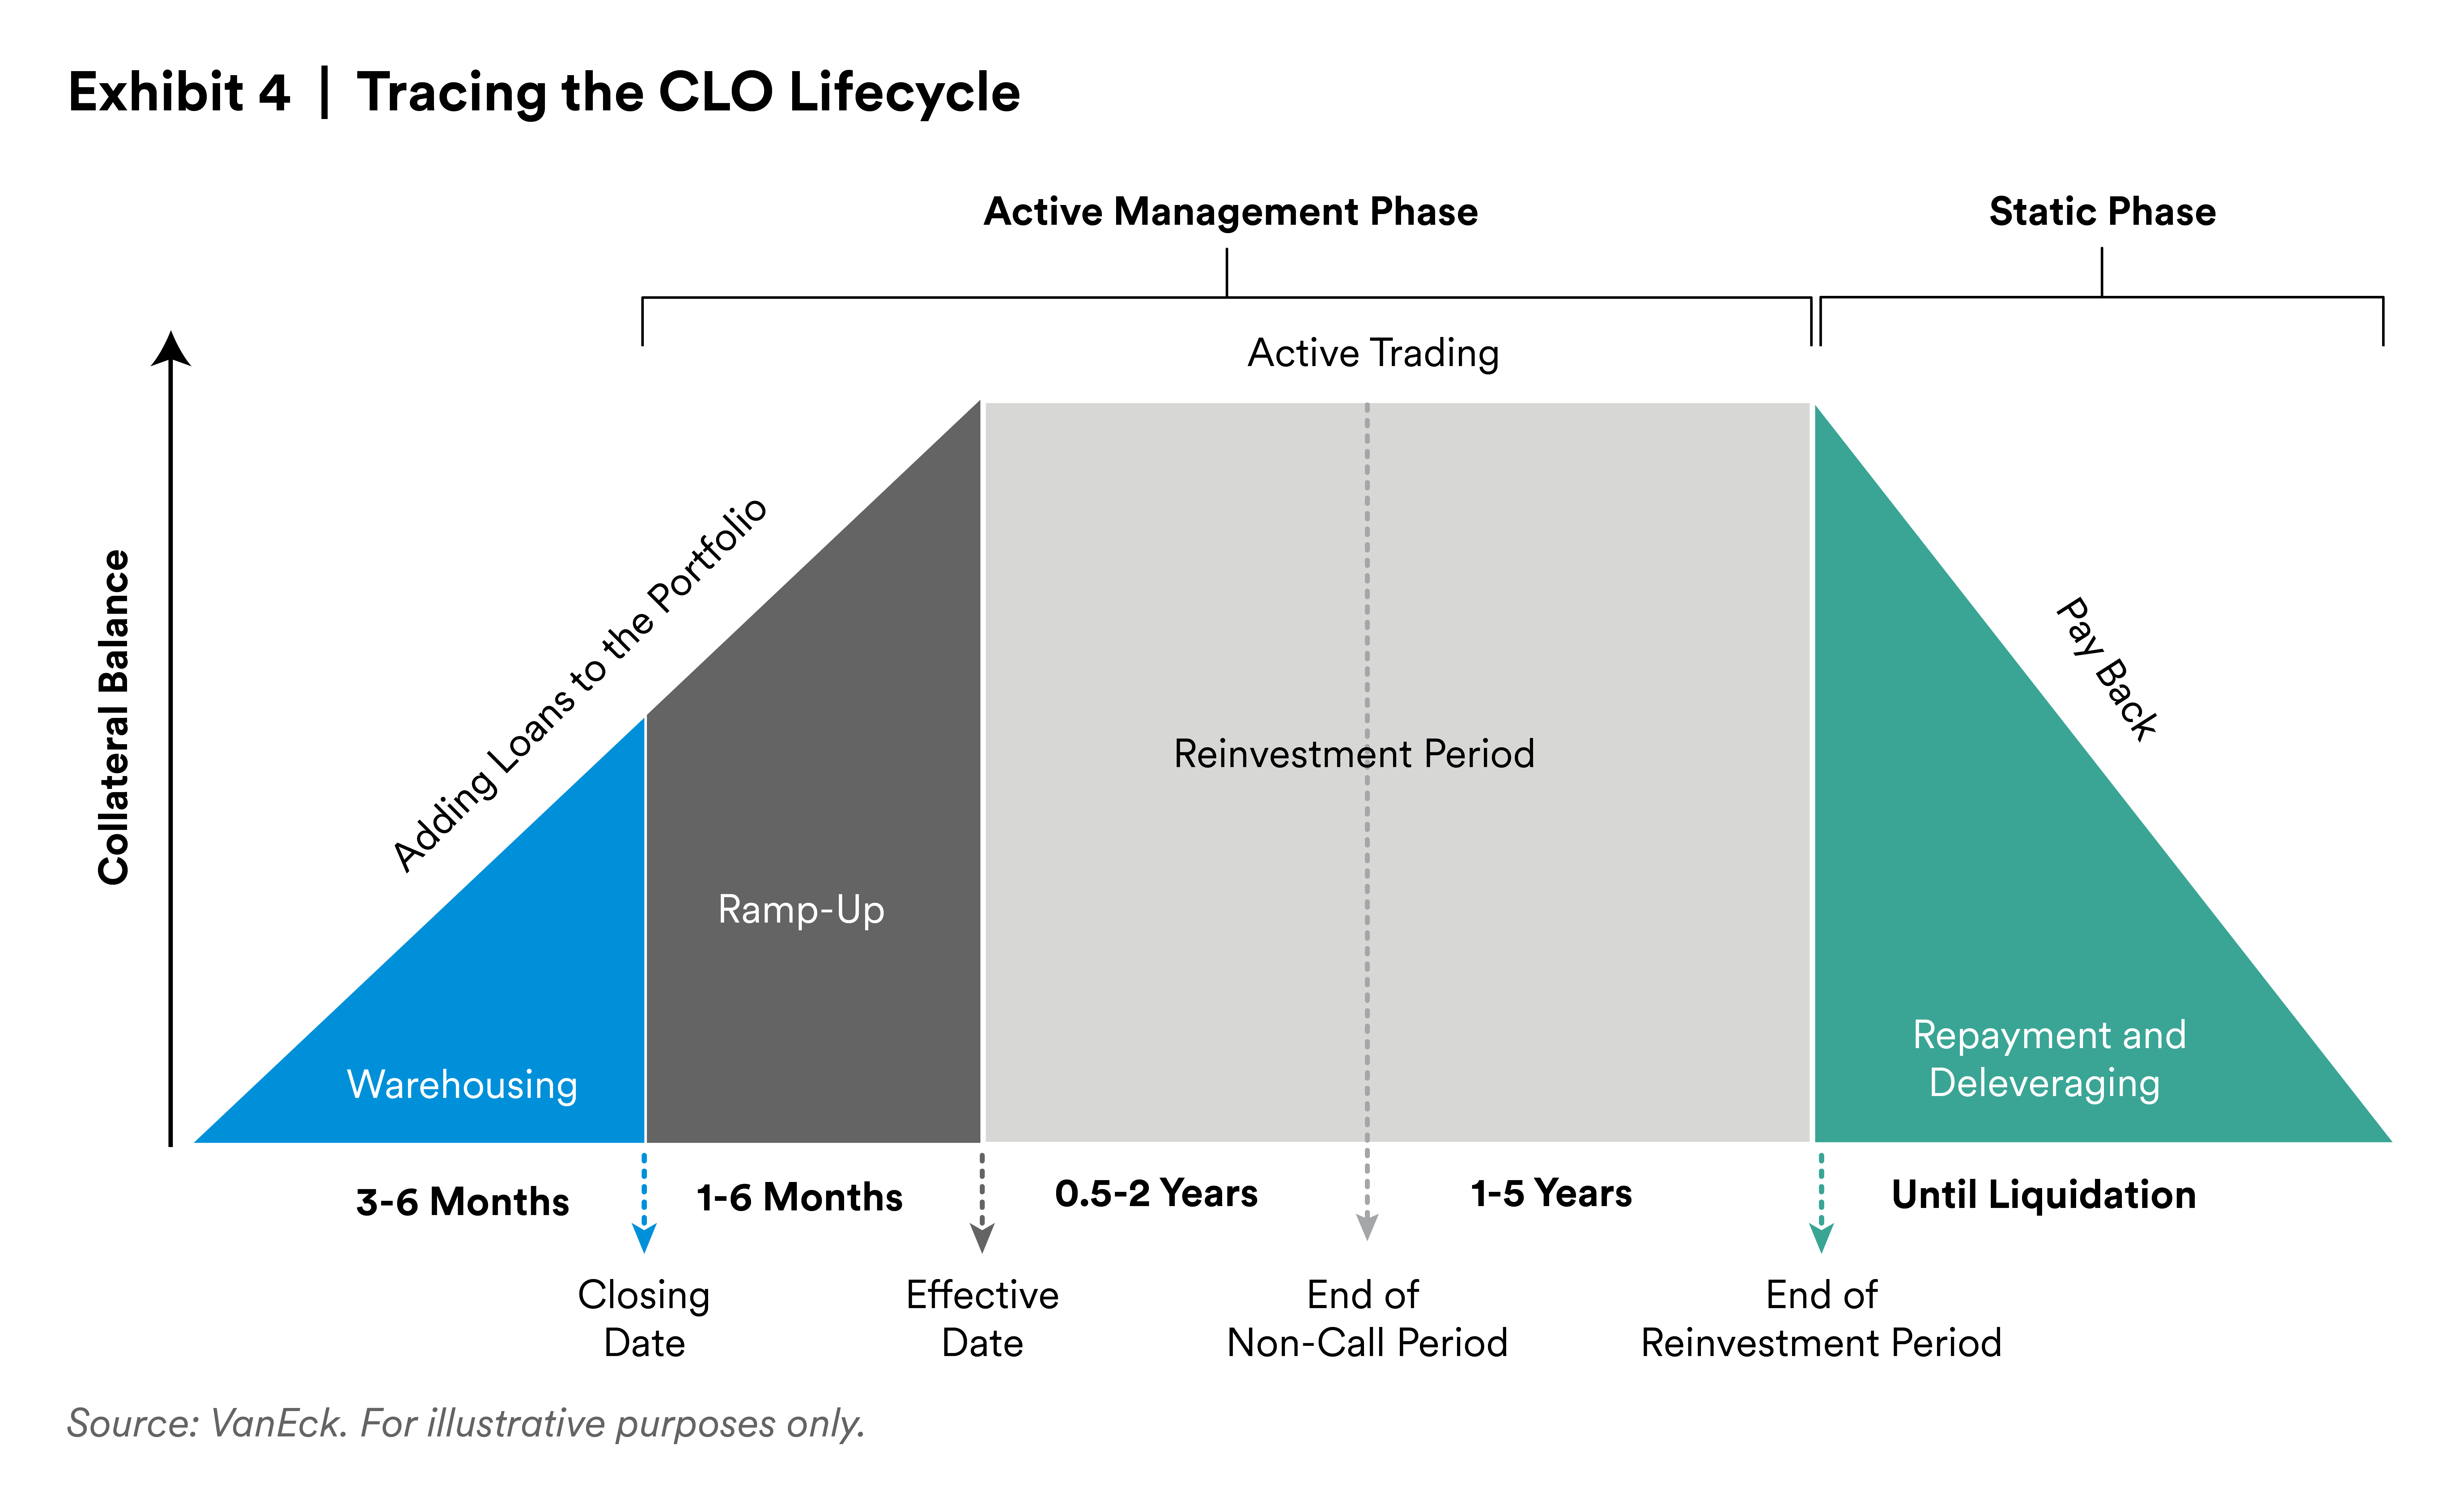
Each CLO has a defined lifecycle in which collateral is purchased, managed, redeemed and returned to investors. The standard lifecycle includes five stages:
- Warehousing (3-6 months): The manager purchases the initial collateral before the closing date.
- Ramp-up (1-6 months): Following the closing date, the manager purchases the remaining collateral to complete the original portfolio. After the ramp-up is complete, the manager also performs monthly tests to ensure the portfolio’s ability to cover its interest and principal payments.
- Reinvestment (1-5 years): Following the ramp-up period, the manager can reinvest all loan proceeds, either purchasing or selling leveraged loans to improve the portfolio’s credit quality.
- Non-call (first 0.5 to 2 years of reinvestment): CLO tranche holders earn a per-tranche yield spread specified at closing, after which the majority equity-tranche holder can call or refinance outstanding CLO tranches.
- Repayment and deleveraging (1-4 years): As underlying loans are paid off, the manager pays down the CLO tranches in order of seniority and distributes the remaining proceeds to the equity-tranche holders.
CLOs typically have a final maturity of up to 11-13 years but a shorter expected life due to loan amortization (Exhibit 4).
Cash flows are the lifeblood of a CLO: They determine the distribution of income and principal, which determines the return on investment. The key concept is that distributions are paid sequentially starting with the senior-most tranche until each CLO tranche has been paid its full distribution. Equity-tranche holders absorb costs and receive the residual distributions once the costs have been paid.
Coverage tests are a vital mechanism to detect and correct collateral deterioration, which directly affects the allocation of cash flows. All CLOs have covenants that require the manager to test the portfolio’s ability to cover its interest and principal payments monthly. Among the many such tests, the most common are the interest coverage9 and overcollateralization10 tests. Covenants specify baseline values for each test.
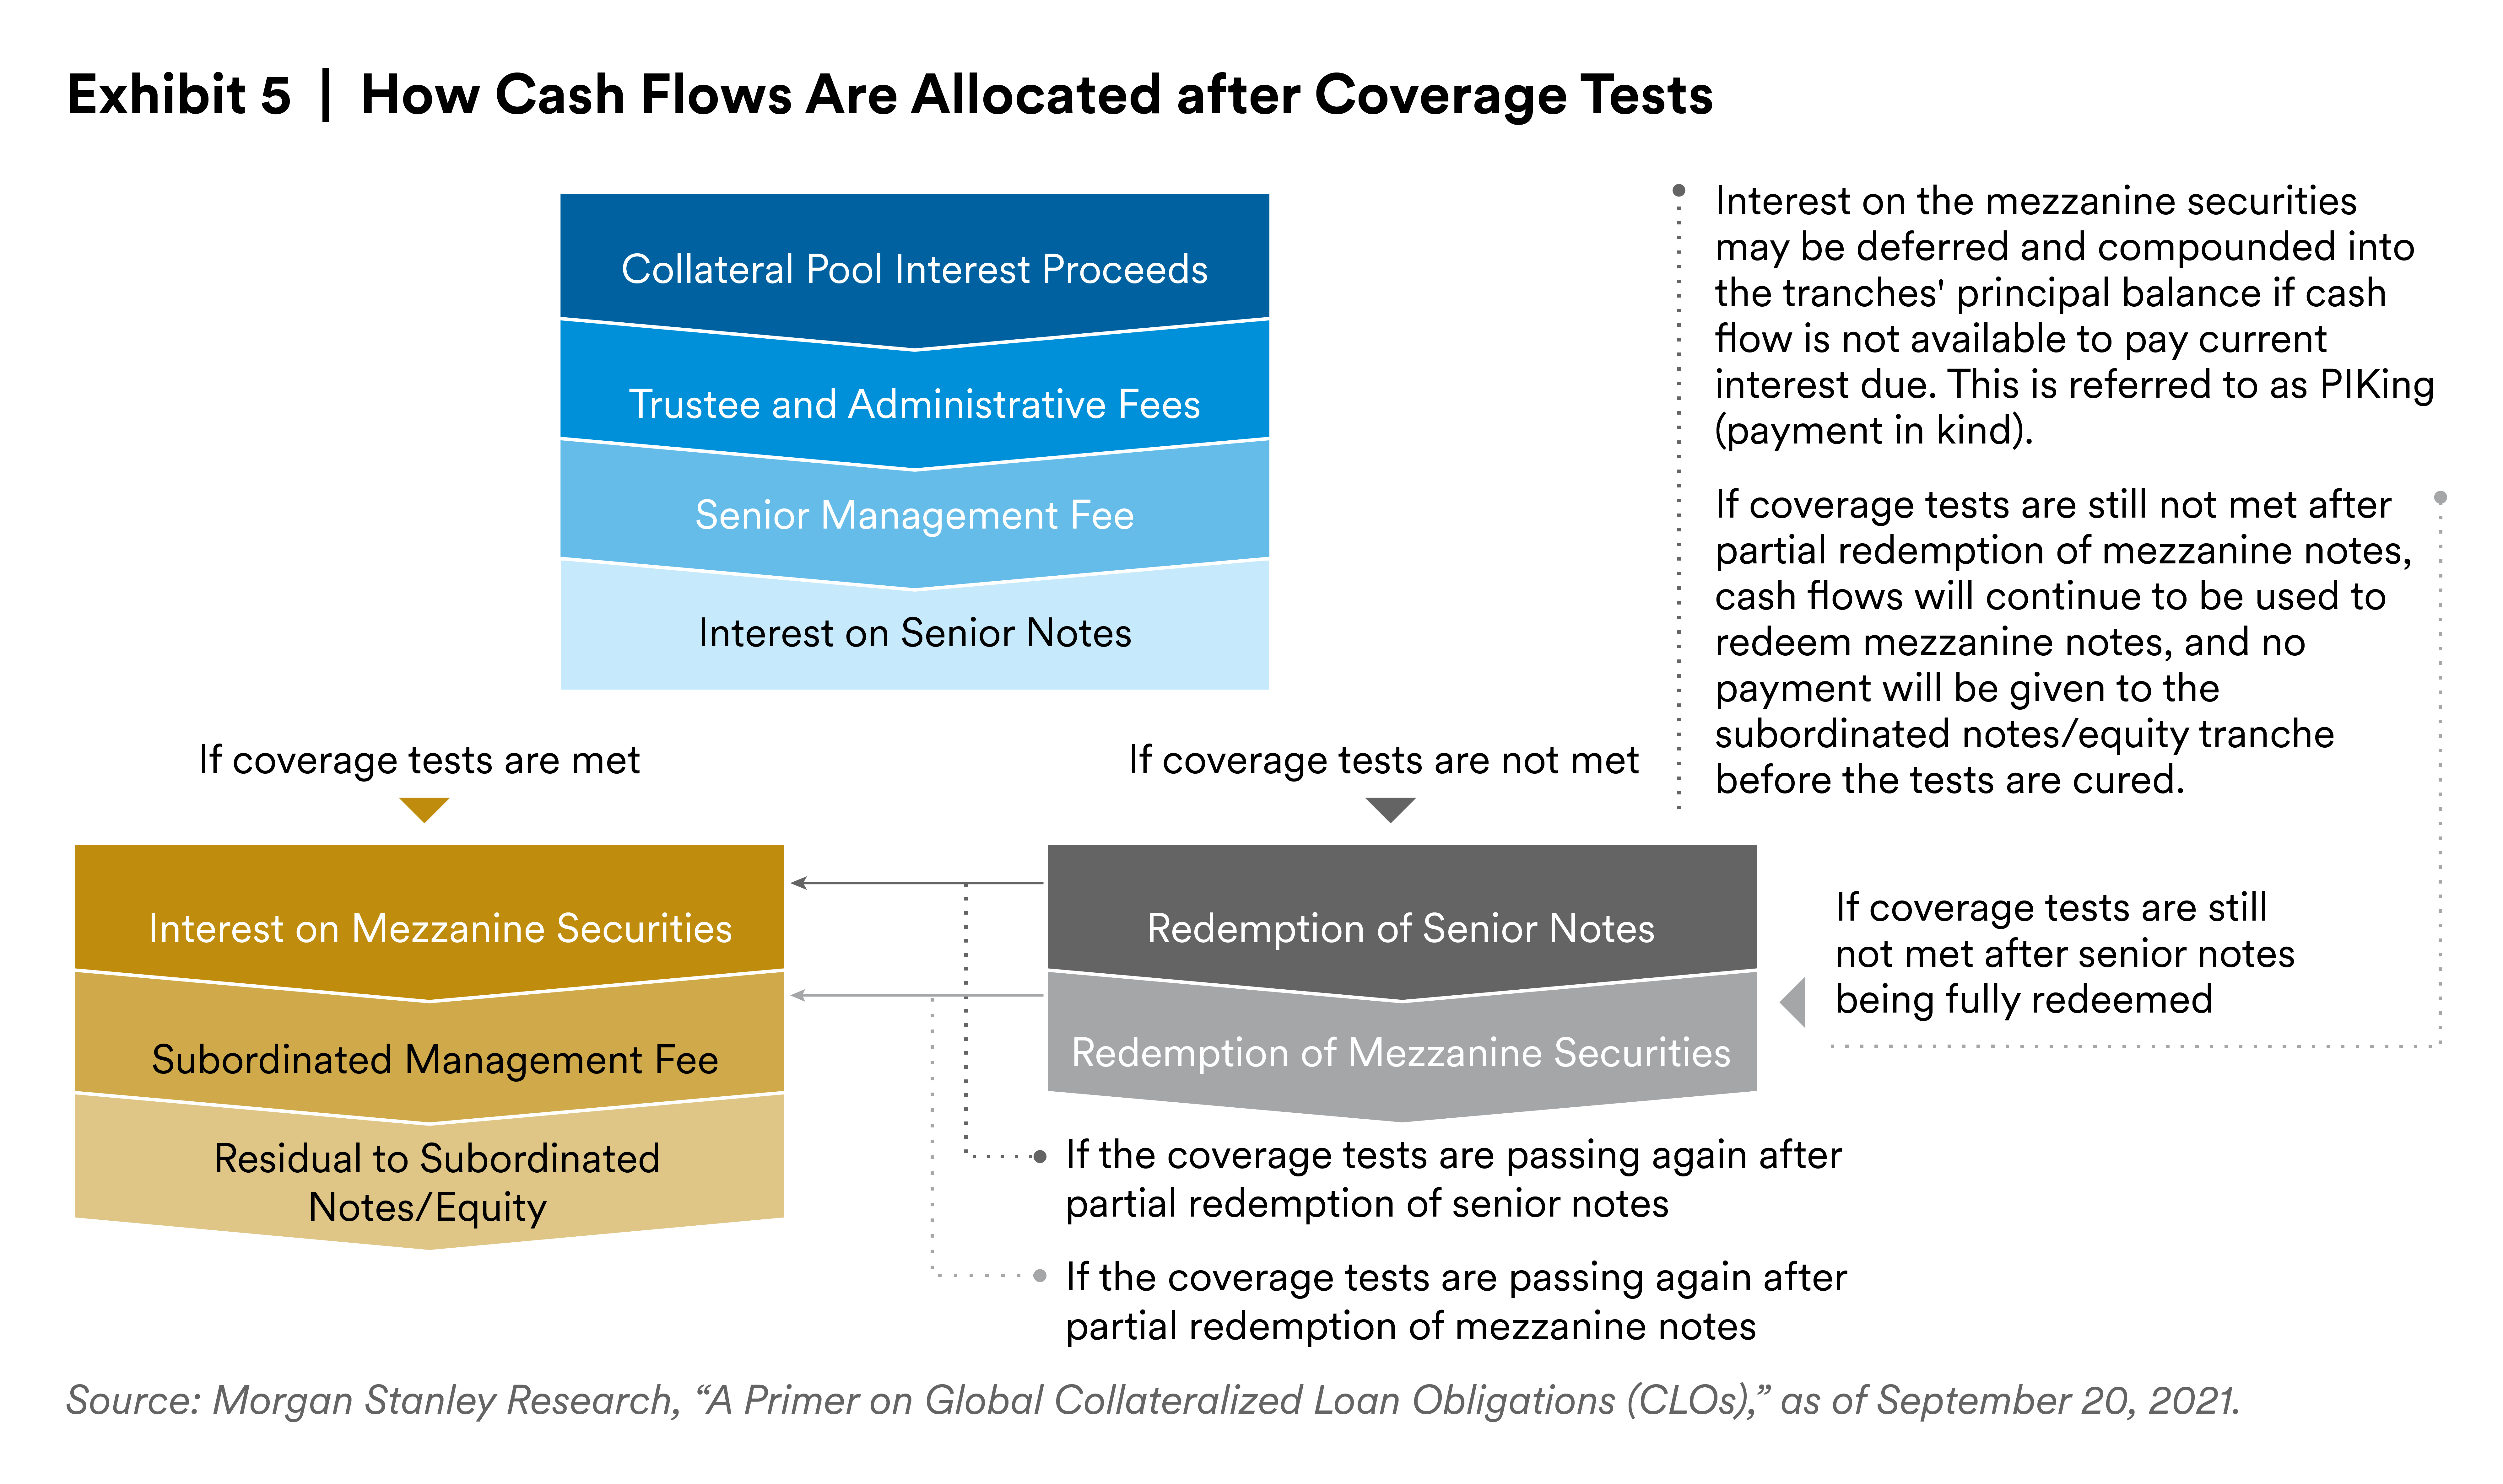
If the tests come up short, the manager must take cash flows from the lowest debt and equity-tranche holders and divert them to retire the CLO tranches in order of seniority. The diagram that follows provides a general illustration of the “waterfall” process in which cash flows are paid when the portfolio either passes or doesn’t pass its interest coverage tests.
Interest payments are based on the results of the coverage test (Exhibit 5).
Coverage tests are one of several risk protections built into the CLO structure. Others include:
- Collateral concentration limits. Many deals mandate that at least 90% of the portfolio be invested in senior secured loans.
- Borrower diversification. The pool of loans typically must be diversified across 150-450 distinct borrowers in 20-30 industries, with a small percentage of the assets (e.g., 1%) invested in the loans of any single borrower.
- Borrower size requirements. Deals often restrict managers from purchasing loans to small companies, whose trading liquidity is low.
The equity tranche occupies a distinct place in the CLO structure. It’s essentially a highly leveraged play on the strength of the underlying collateral. Because the equity tranche’s success depends on the success of the CLO tranches—it’s last in line to receive cash flows and first to realize loan losses—its owners take the most risk of any CLO investors. Their goal, then, is to maximize the value of the equity.
As compensation for providing the majority of equity capital, the majority equity-tranche holder is given potential control over the entire CLO in the form of options, as highlighted below:
- Call option. The majority equity investor can direct a refinancing in some or all CLO debt after the non-call period expires to take advantage of potentially accretive opportunities for the equity returns, such as:
- Refi scenario. CLO debt is refinanced into lower-cost debt with the same maturity and minimal changes to other deal terms.
- Reset scenario. All CLO debt is refinanced, and the legal maturity of the debt is extended. Resets typically extend the reinvestment period of the CLO and the period during which the CLO equity can potentially capture value under volatile leveraged loan market conditions.
Both options could potentially increase prospective equity returns over the life of the CLO, typically by 50 to 150 bps, depending on the extent of spread tightening since the deal originally priced.
- Redemption occurs when the assets are sold, the proceeds are used to pay off the debt and the residual amount is paid to the equity, resulting in a final internal rate of return (IRR) calculation. Redemption allows the majority equity holder to optimize the value of the underlying collateral by controlling the point in time that the loan assets are liquidated.
To learn more about the potential benefits of CLO equity, read our primer, CLO Equity: How It Works – and Why It’s Compelling Now.
In the wake of securitized investments’ difficulties during the financial crisis, U.S. and European regulators took steps to mitigate CLOs’ structural risks that made CLOs more attractive for investors.
European regulation is concentrated in several rules governing the capital requirements for banks and insurance companies. Risk retention, commonly known as “skin in the game,” has been a requirement in Europe since 2011. It holds that CLO managers must retain 5% of the original value of the assets in their CLOs to align their interests more closely with those of investors.
The US required CLOs to be risk-retention compliant from December 2016 to May 2018. A court case brought by the Loan Syndications & Trading Association (LSTA) reversed the decision, as it was deemed that CLO managers do not “originate” the loans; rather, they buy them. As a result, risk retention is no longer required for U.S. CLO issuers.
A prominent U.S. regulatory development was the implementation of the Volcker Rule, which became effective in 2014. To be in compliance, most 2.0 vintage CLOs issued starting in 2014 were collateralized only with leveraged loans, and many 1.0 CLOs were “Volckerized” to eliminate non-loan collateral (where previously CLOs had 5%-10% exposure to high yield bonds). While the Volcker rule has since been amended to allow the inclusion of high yield bonds in a CLO, relatively few CLOs have included these investments; that said, the number of CLOs utilizing this additional flexibility in asset exposure has ticked up over the past couple of years.
Lastly, the sunsetting of Libor at the end of 2021 required U.S. CLOs and their underlying leveraged loans to transition to a new reference rate. The Alternative Reference Rate Committee (ARRC) formally endorsed term SOFR as the fallback rate for the Libor transition in July of 2021, and Libor could no longer be used to issue new loans as of January 2022. While origination of new loans and CLOs linked to Libor ended in 2021, legacy products were permitted to continue to use certain Libor tenors as reference rates until June 30, 2023, after which the one-, three- and six-month USD Libor rates would no longer be representative. The loan and CLO markets navigated the transition successfully, with most loans transitioning to a new benchmark on or prior to June 30, 2023. Term SOFR is now widely used as the replacement for Libor in U.S. CLOs and broadly syndicated loans.
CLOs can offer investors multiple benefits, both on their own and versus other fixed income sectors.
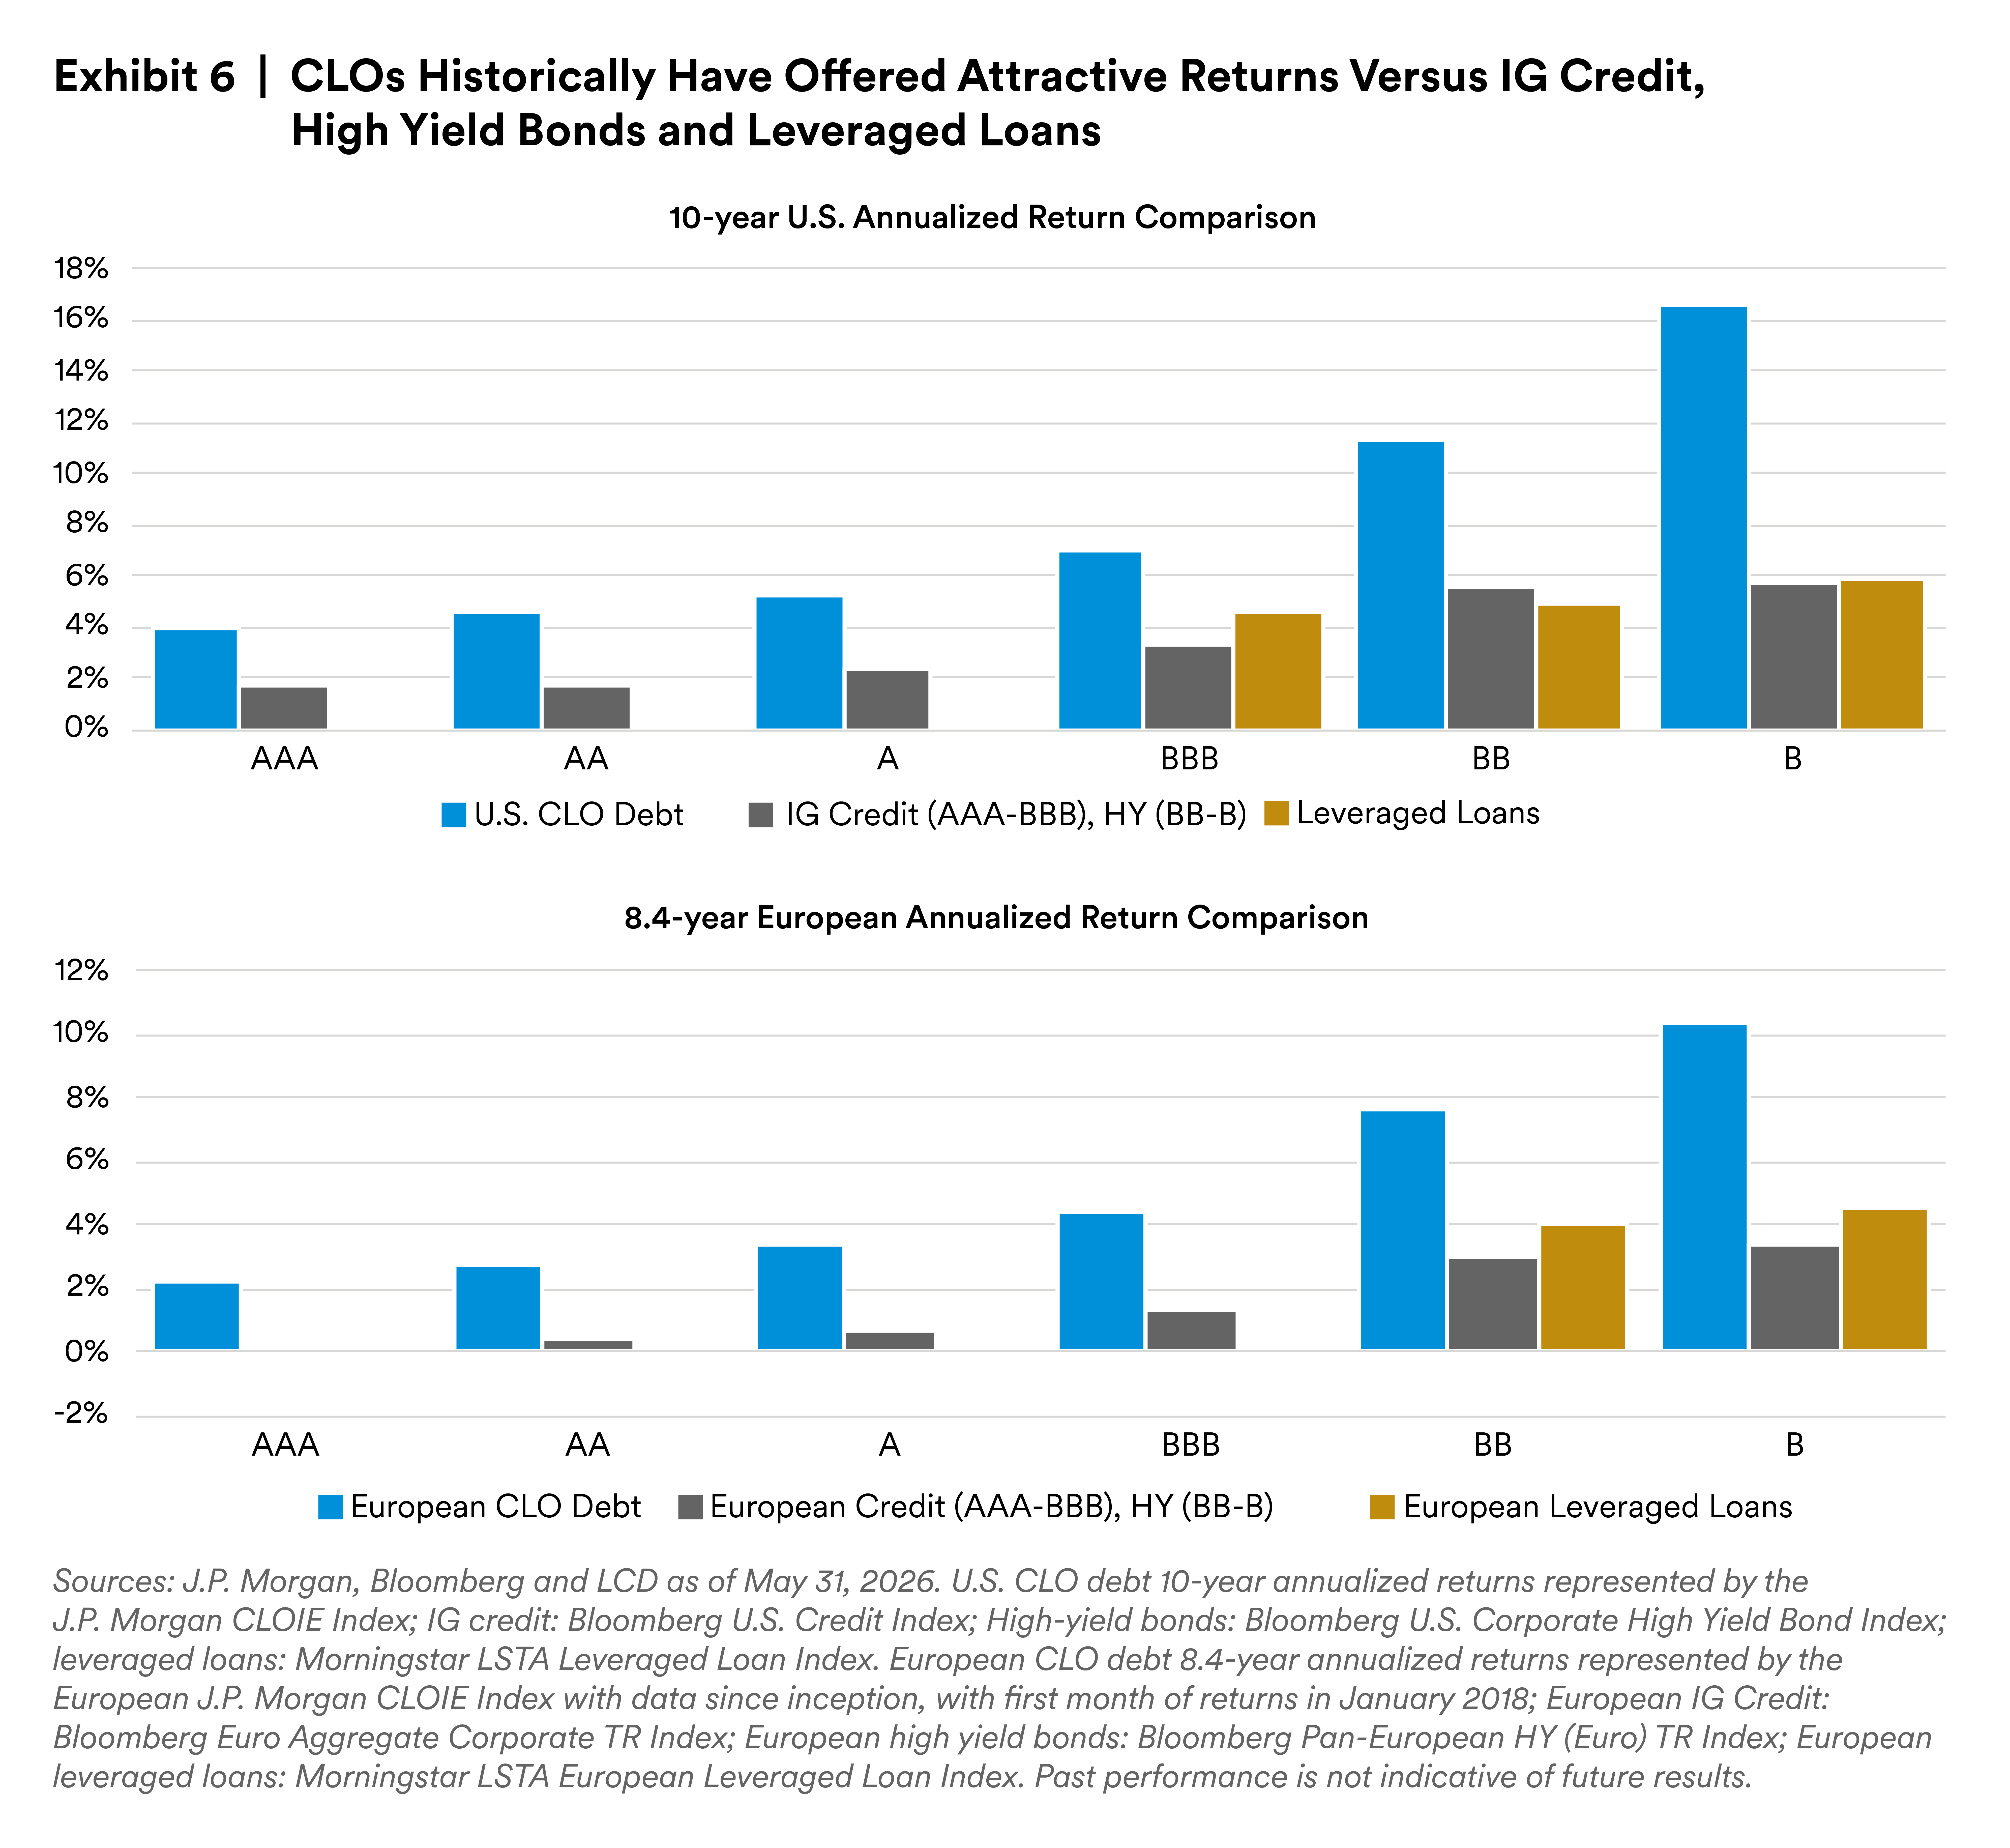
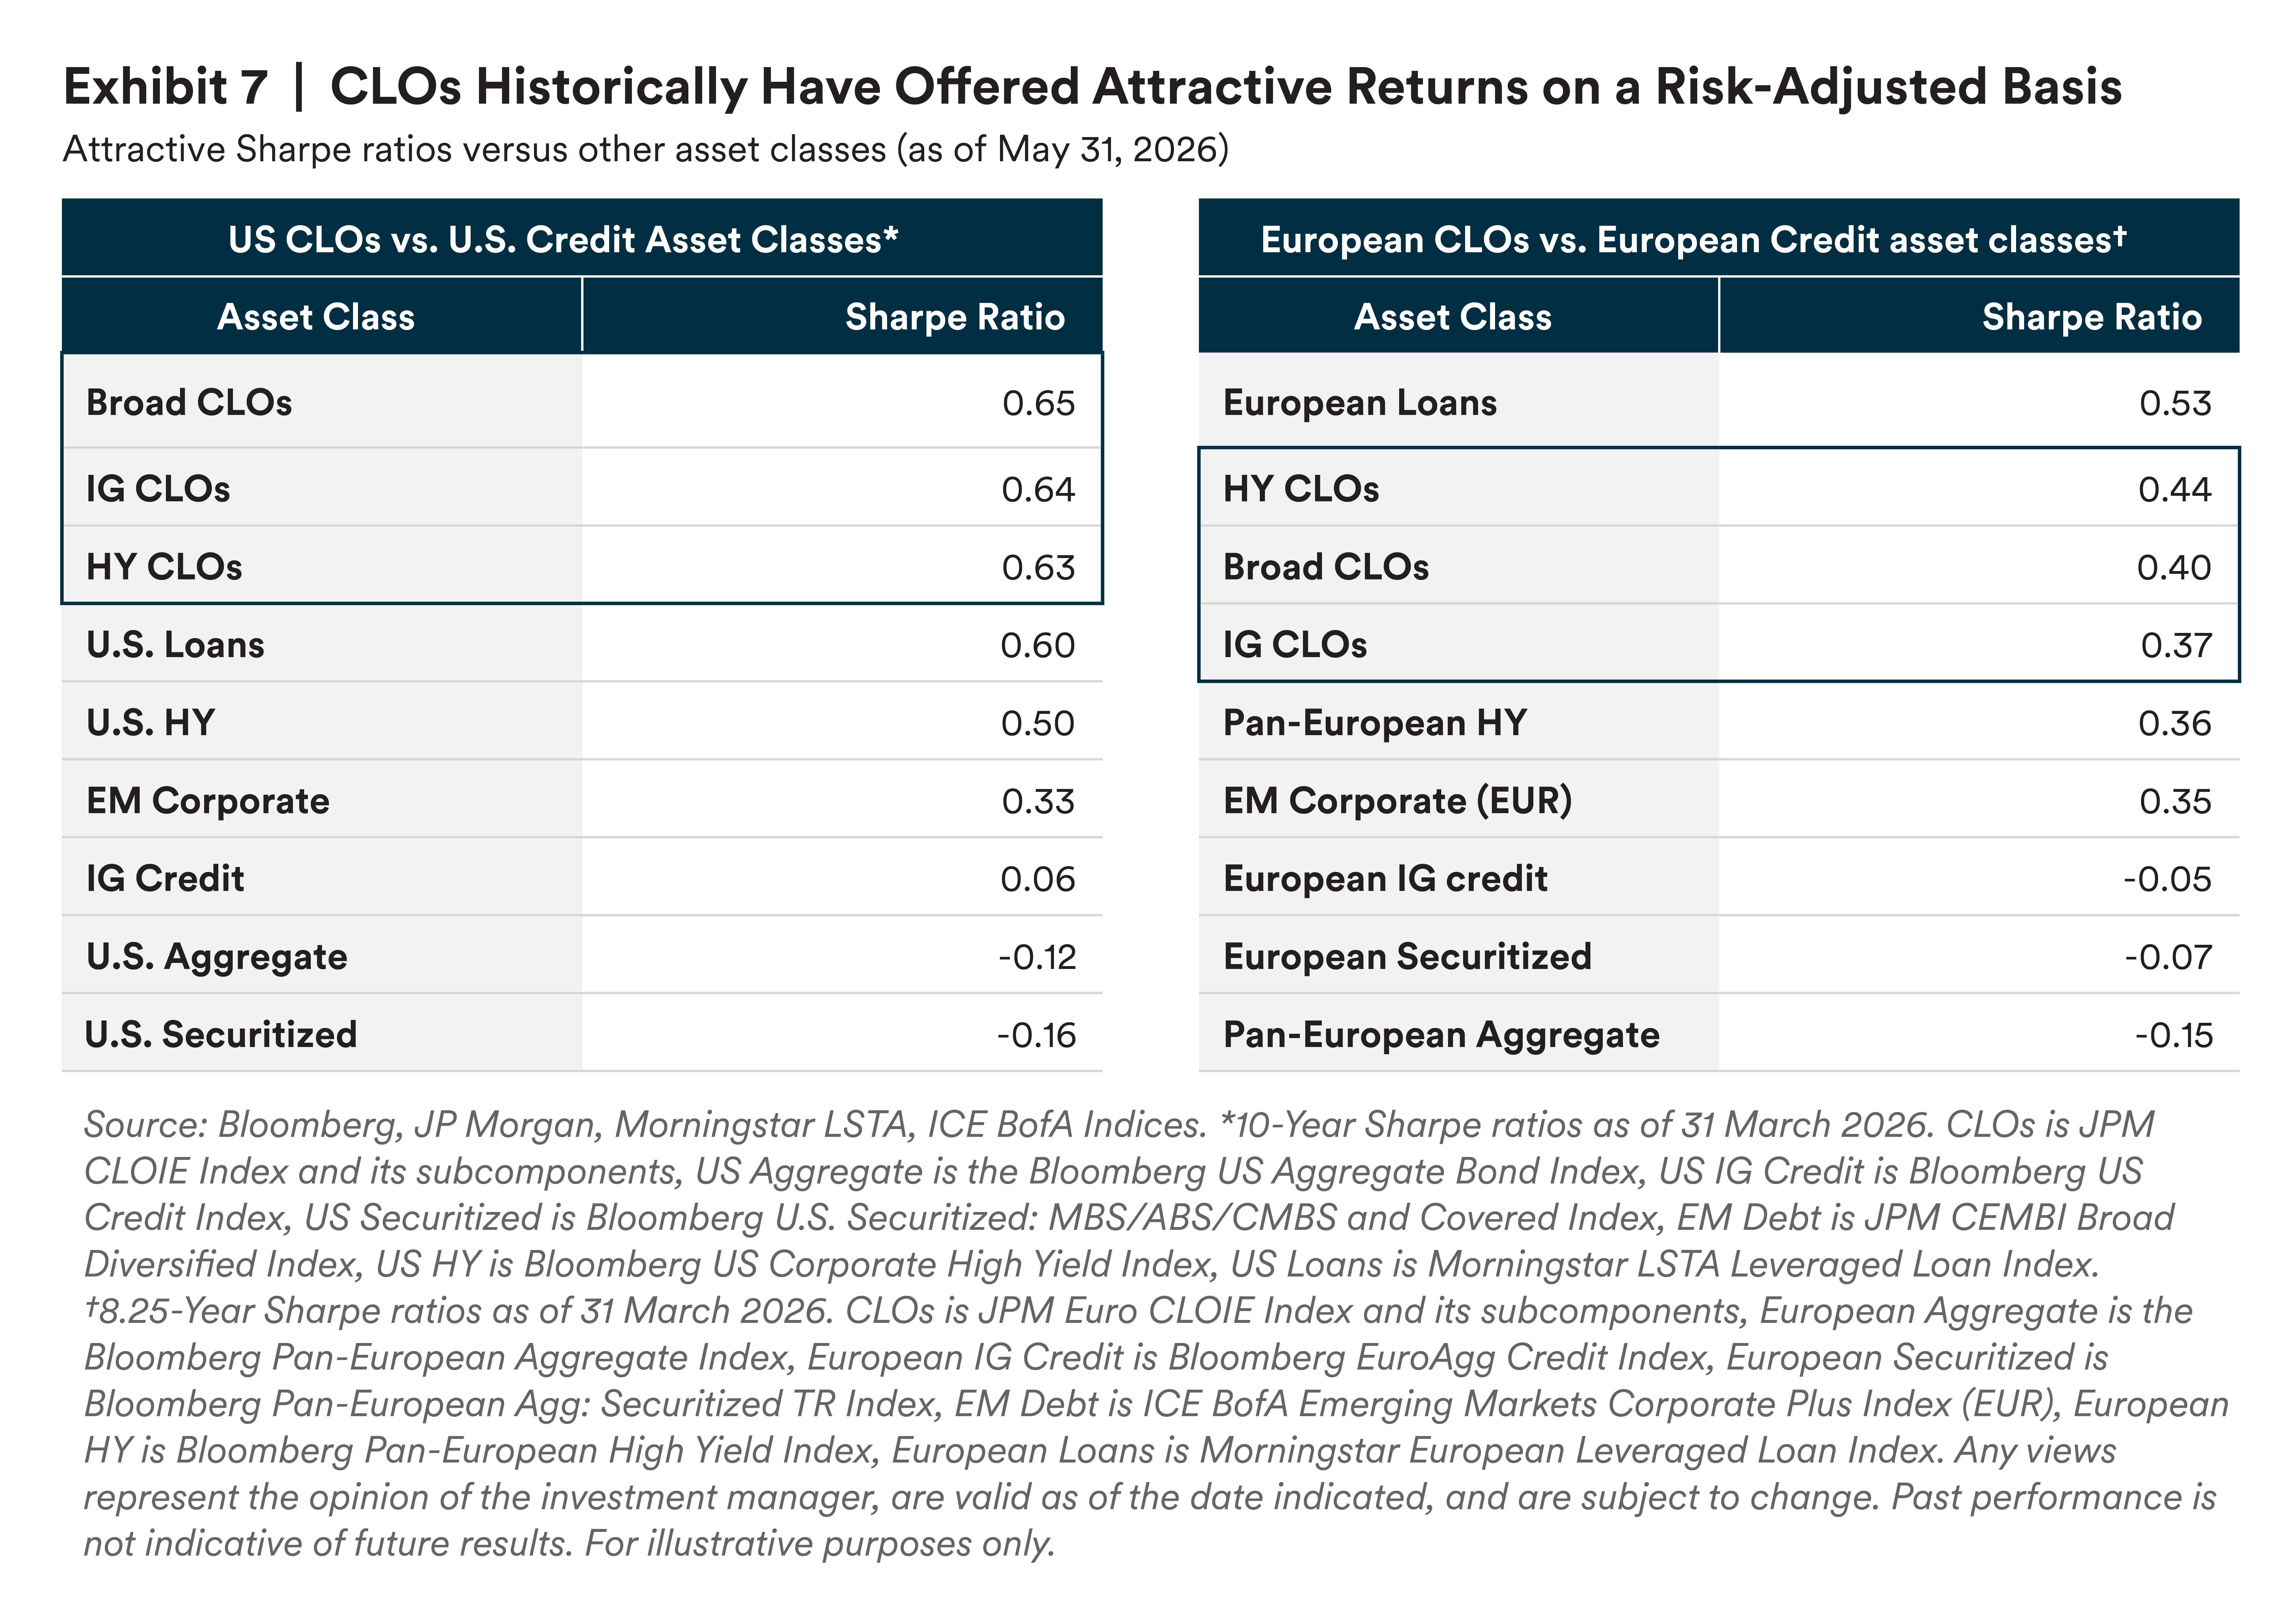
Strong returns. Over the long term, CLO tranches have outperformed other corporate debt categories, including leveraged loans, high yield bonds and investment grade bonds, and have significantly outperformed at lower rating tiers. CLOs have also outperformed on a risk-adjusted basis, generating higher Sharpe ratios than many other credit asset classes (Exhibits 6 and 7).
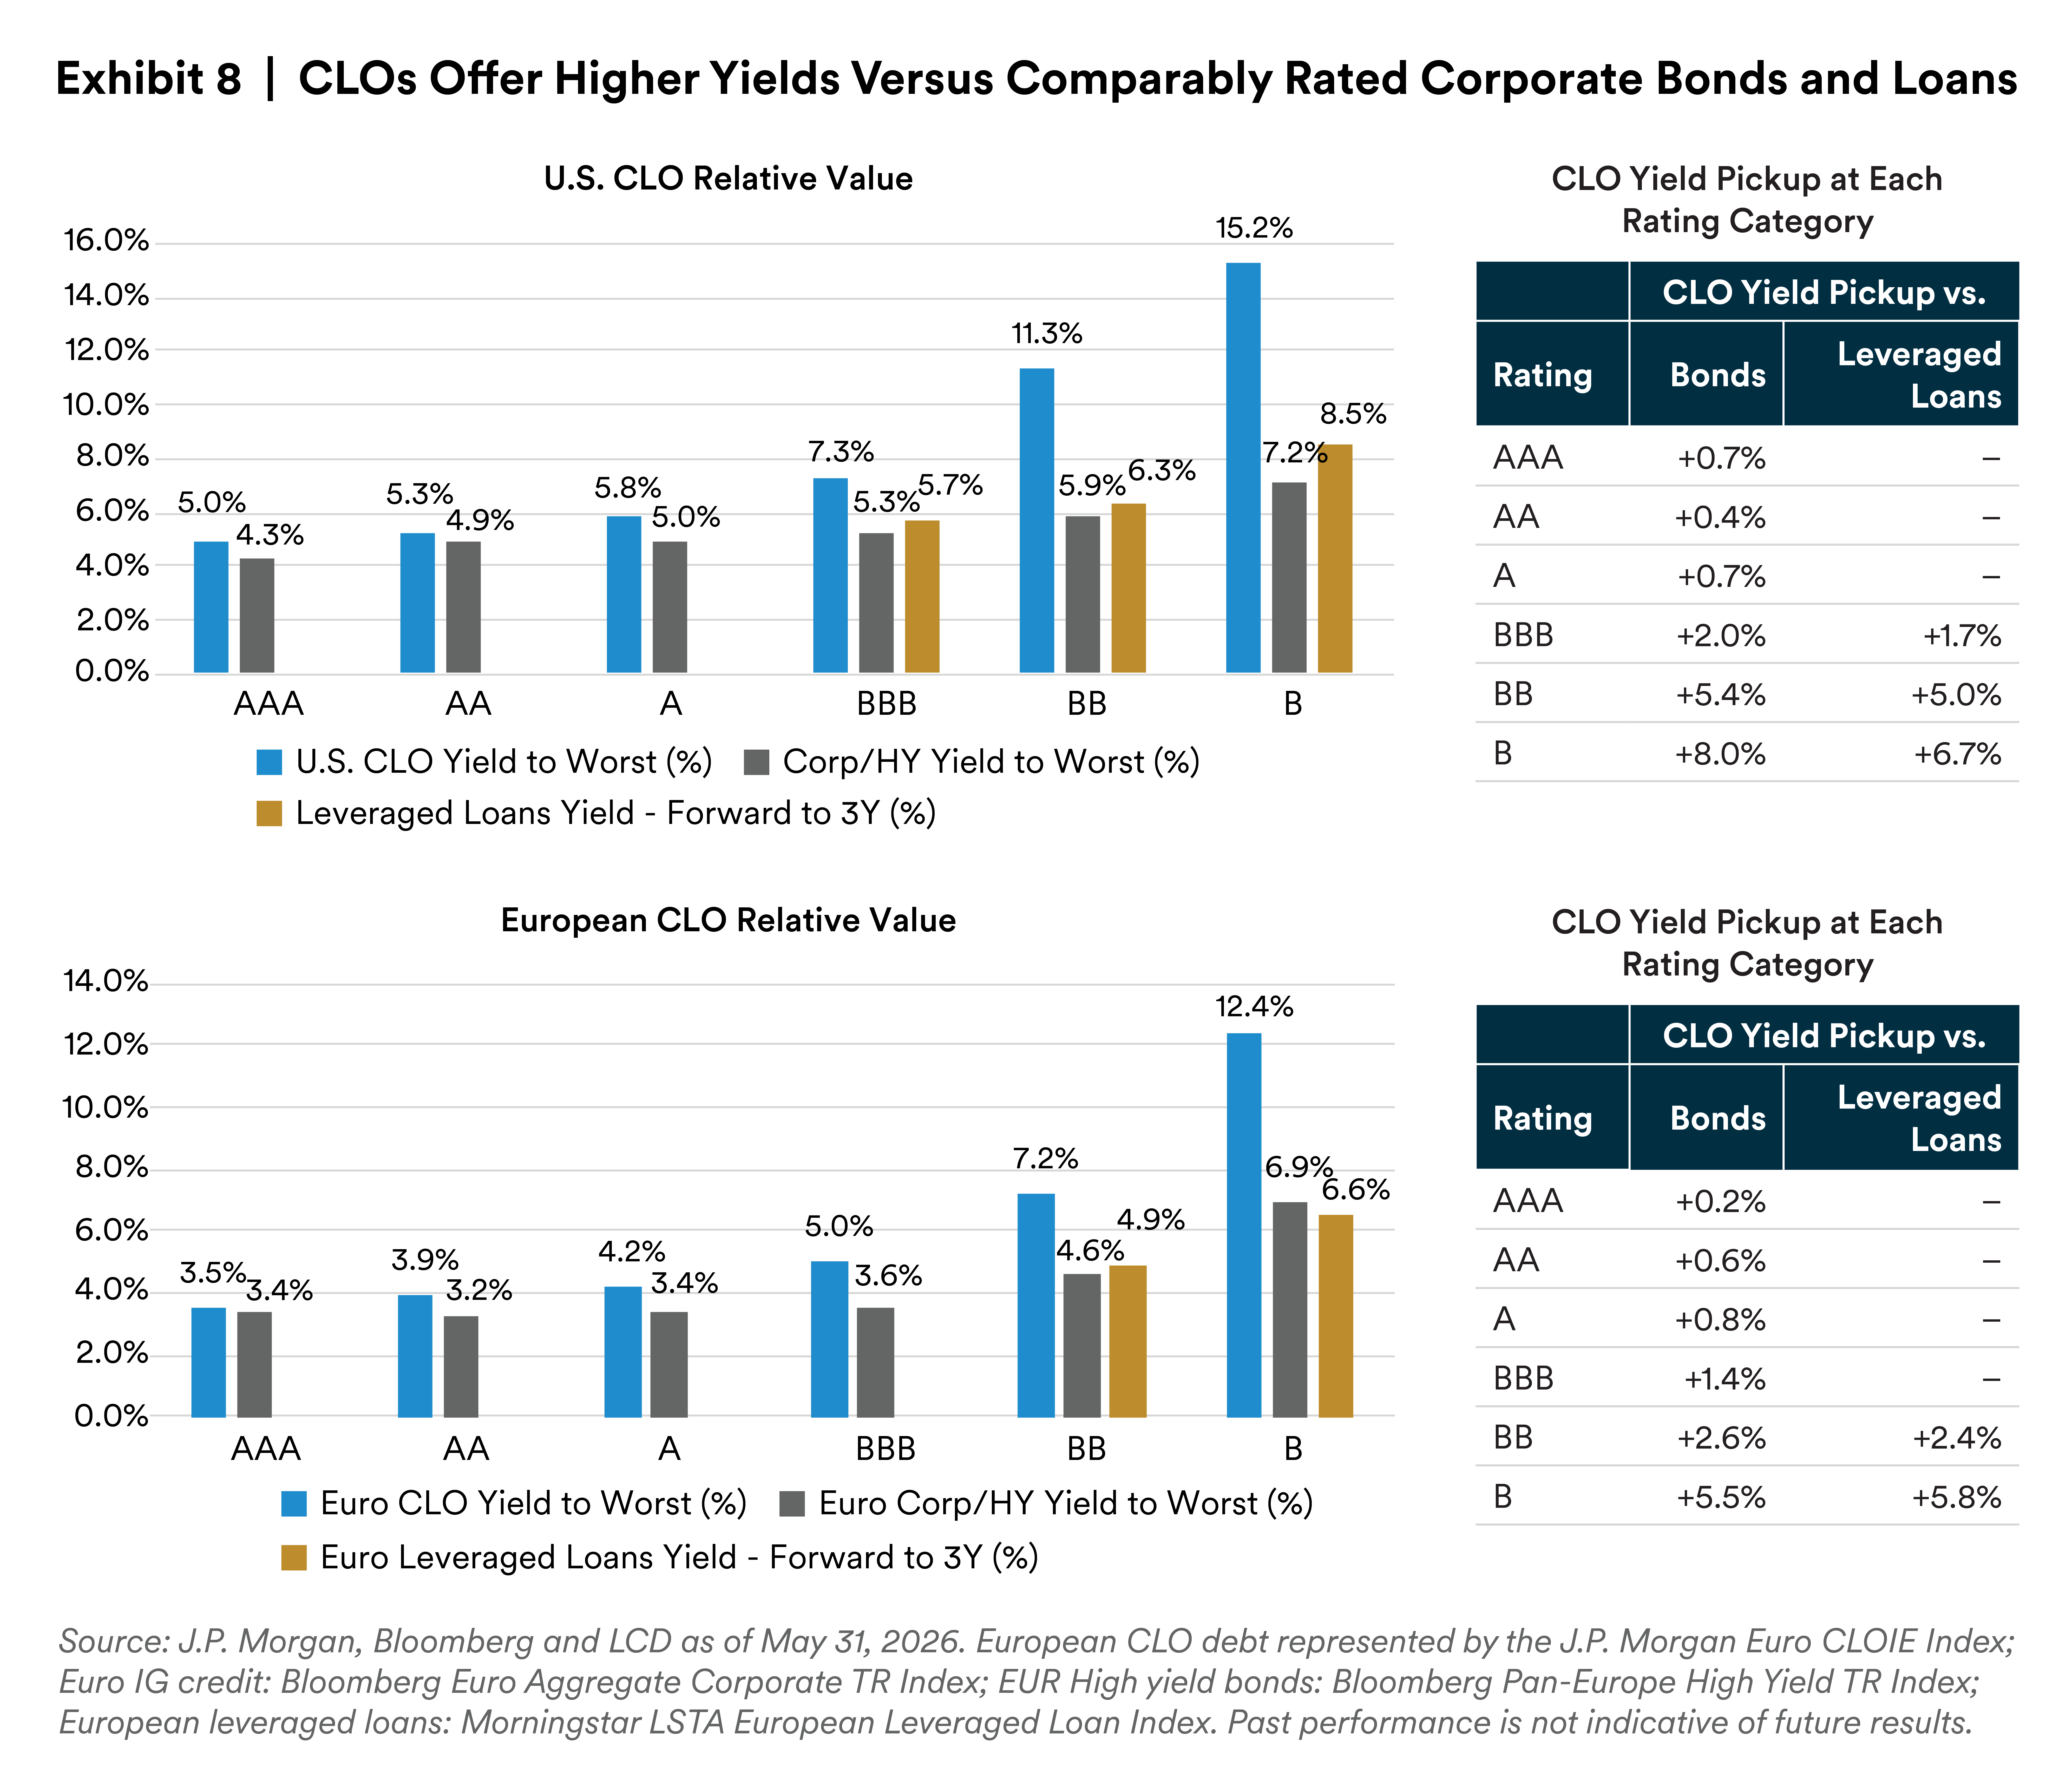
Wider yield spreads. CLO spreads typically are wider than those of other debt instruments, reflecting CLOs’ greater complexity, lower liquidity, and regulatory requirements (Exhibit 8). Compared with investment grade corporates, as well as other higher-yielding debt sectors—notably high yield and leveraged loans—CLO spreads are especially compelling.
Low interest-rate sensitivity. Leveraged loans and CLO tranches are floating-rate instruments, priced at a spread above a benchmark rate (such as SOFR and Euribor). As interest rates rise or fall, CLO yields will move accordingly, and their prices have historically moved less than those of fixed-rate instruments. These characteristics can be advantageous to investors in diversified fixed income portfolios.
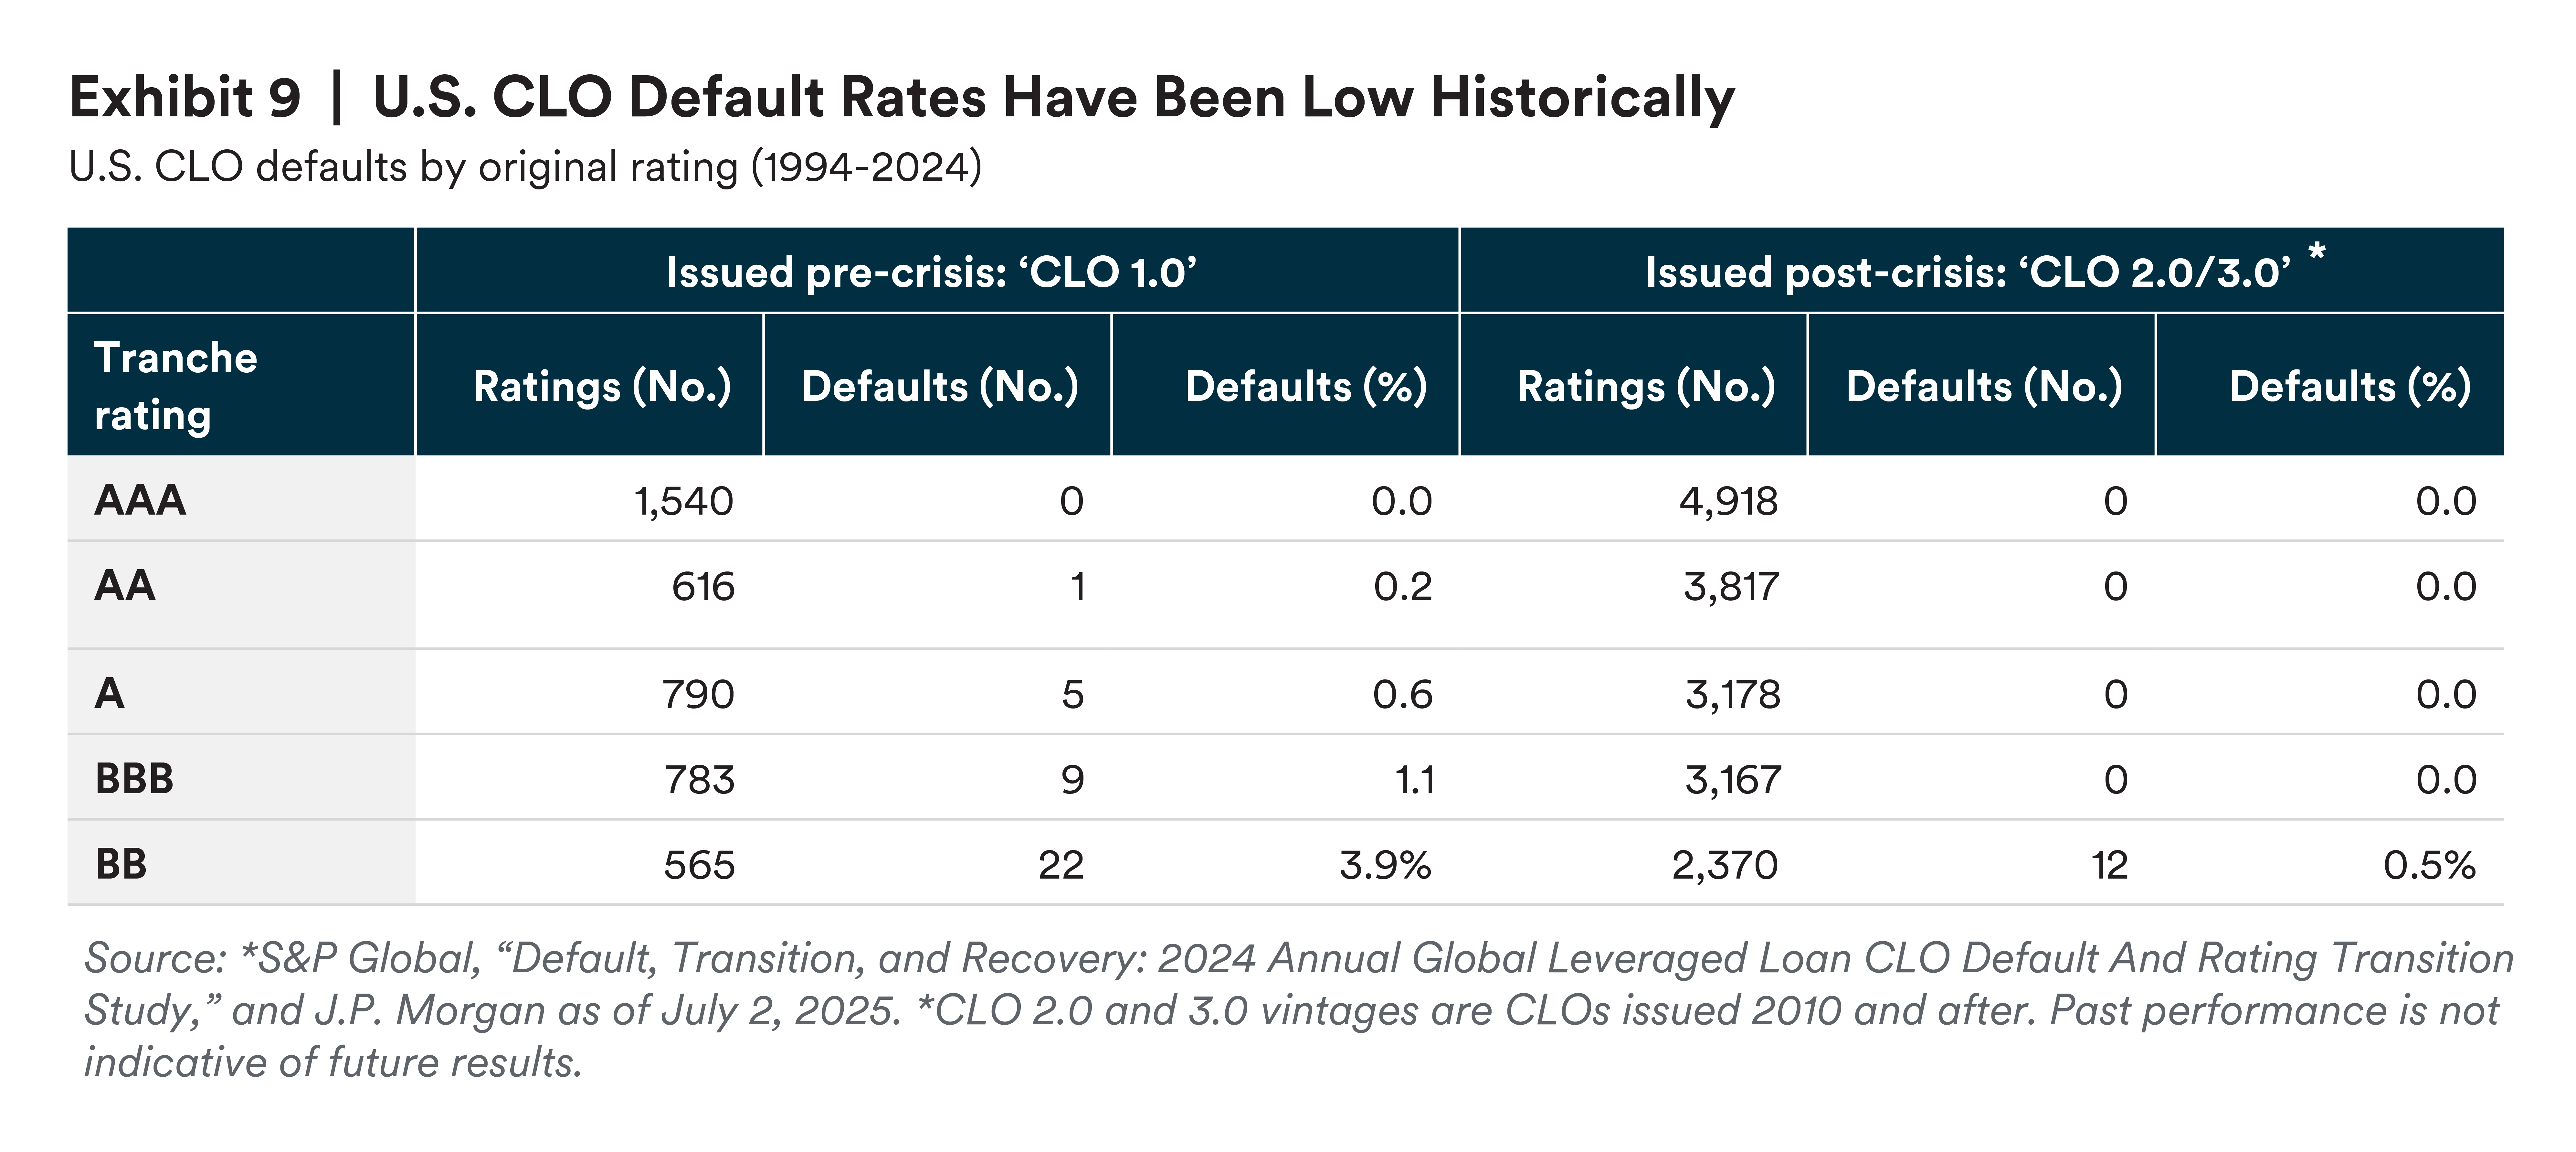
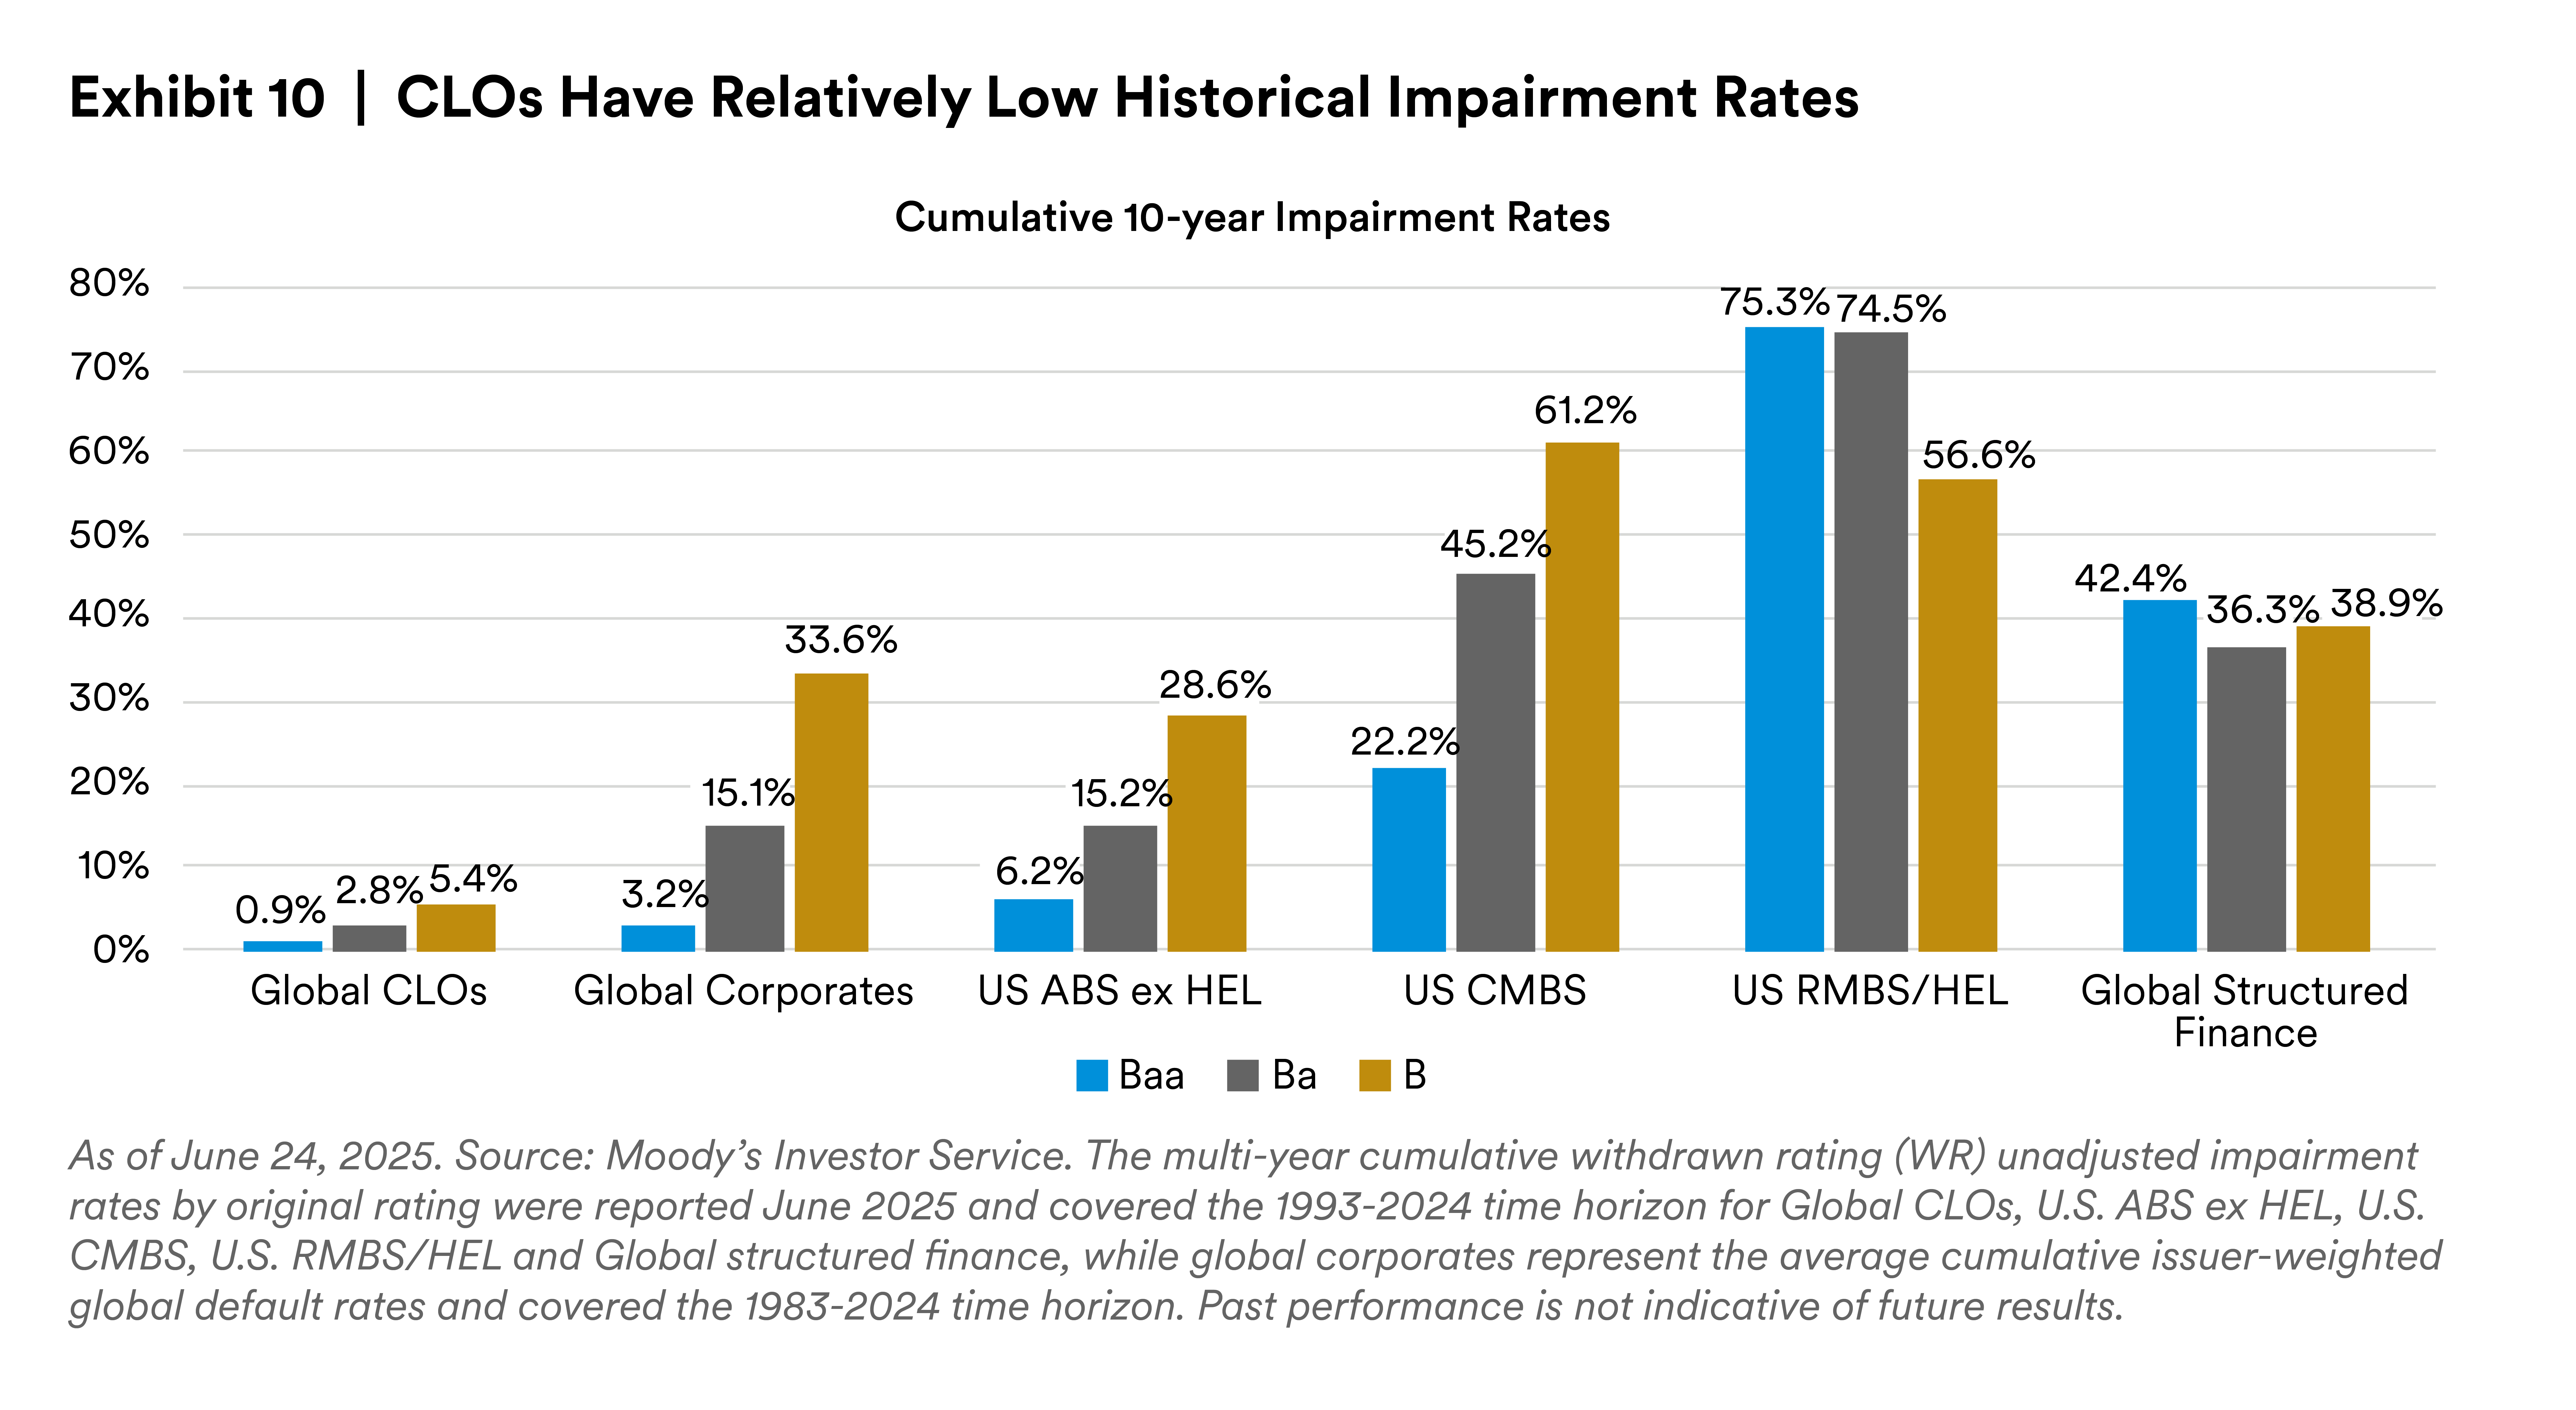
Attractive risk profile. As demonstrated by a variety of key metrics, with default/impairment and loss rates as the most notable examples, CLOs have historically presented lower levels of principal losses relative to corporate debt and other securitized products (Exhibits 9 and 10). Of the approximately $500 billion of U.S. CLOs issued from 1994-2009 and rated by S&P (vintage 1.0 CLOs), only 0.86% experienced defaults, and an even smaller percentage of those, 0.40%, were originally rated BBB or higher (see table below). Among CLOs rated by Moody’s, there have been zero defaults on the AAA and AA tranches across all vintages (1.0 through 3.0).11 Loss rates are also very low, with originally rated AAA-A rated tranches never experiencing a principal loss, while Baa, Ba and B tranches have cumulative 10-year loss rates of just 0.69%, 4.80% and 13.53%, respectively, compared to loans and corporate bonds, which have average annual loss rates of 31.3% and 57.1%, respectively.12
Inflation and rising-rates hedge. CLOs’ floating-rate yields make them an effective hedge against inflation and rising interest rates since their coupons adjust based on a reference rate (SOFR or Euribor) and therefore have lower interest rate duration risk versus similarly rated fixed income alternatives.
Strong credit quality. Unlike most corporate bonds, leveraged loans are both secured and backed by first-lien collateral.
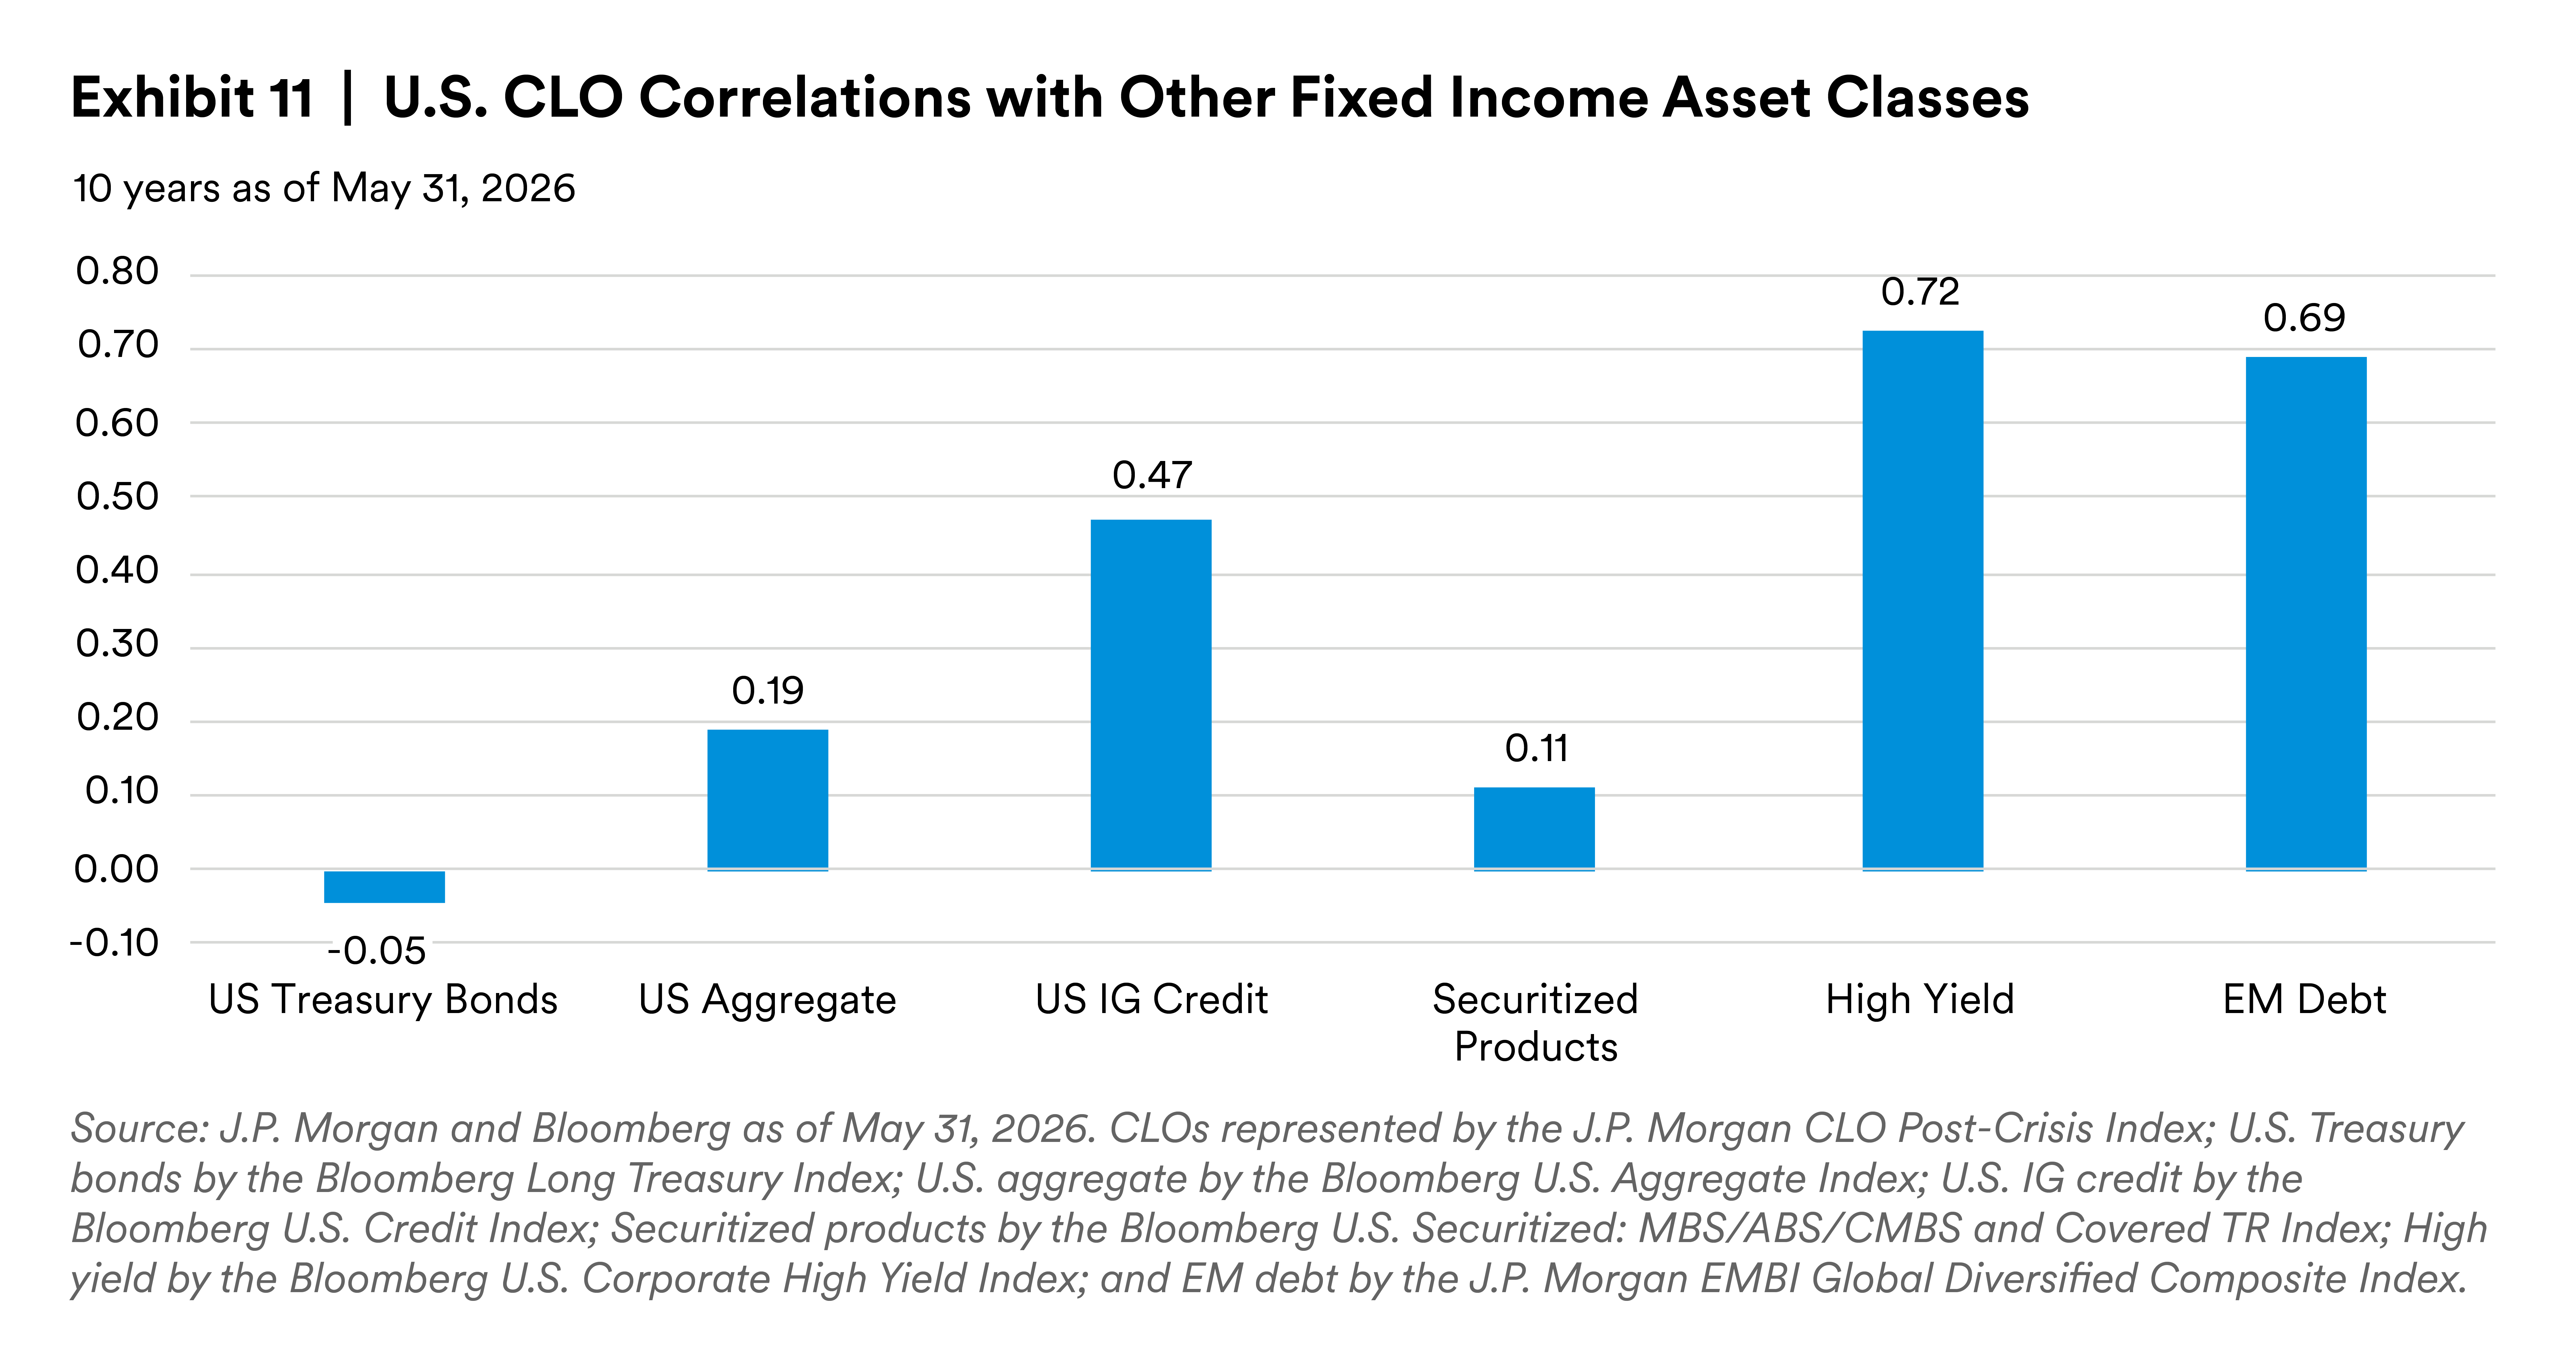
Diversification. CLO correlations with other fixed income categories are relatively low, meaning that many CLOs have historically increased the effective diversification of a broader portfolio (Exhibit 11).
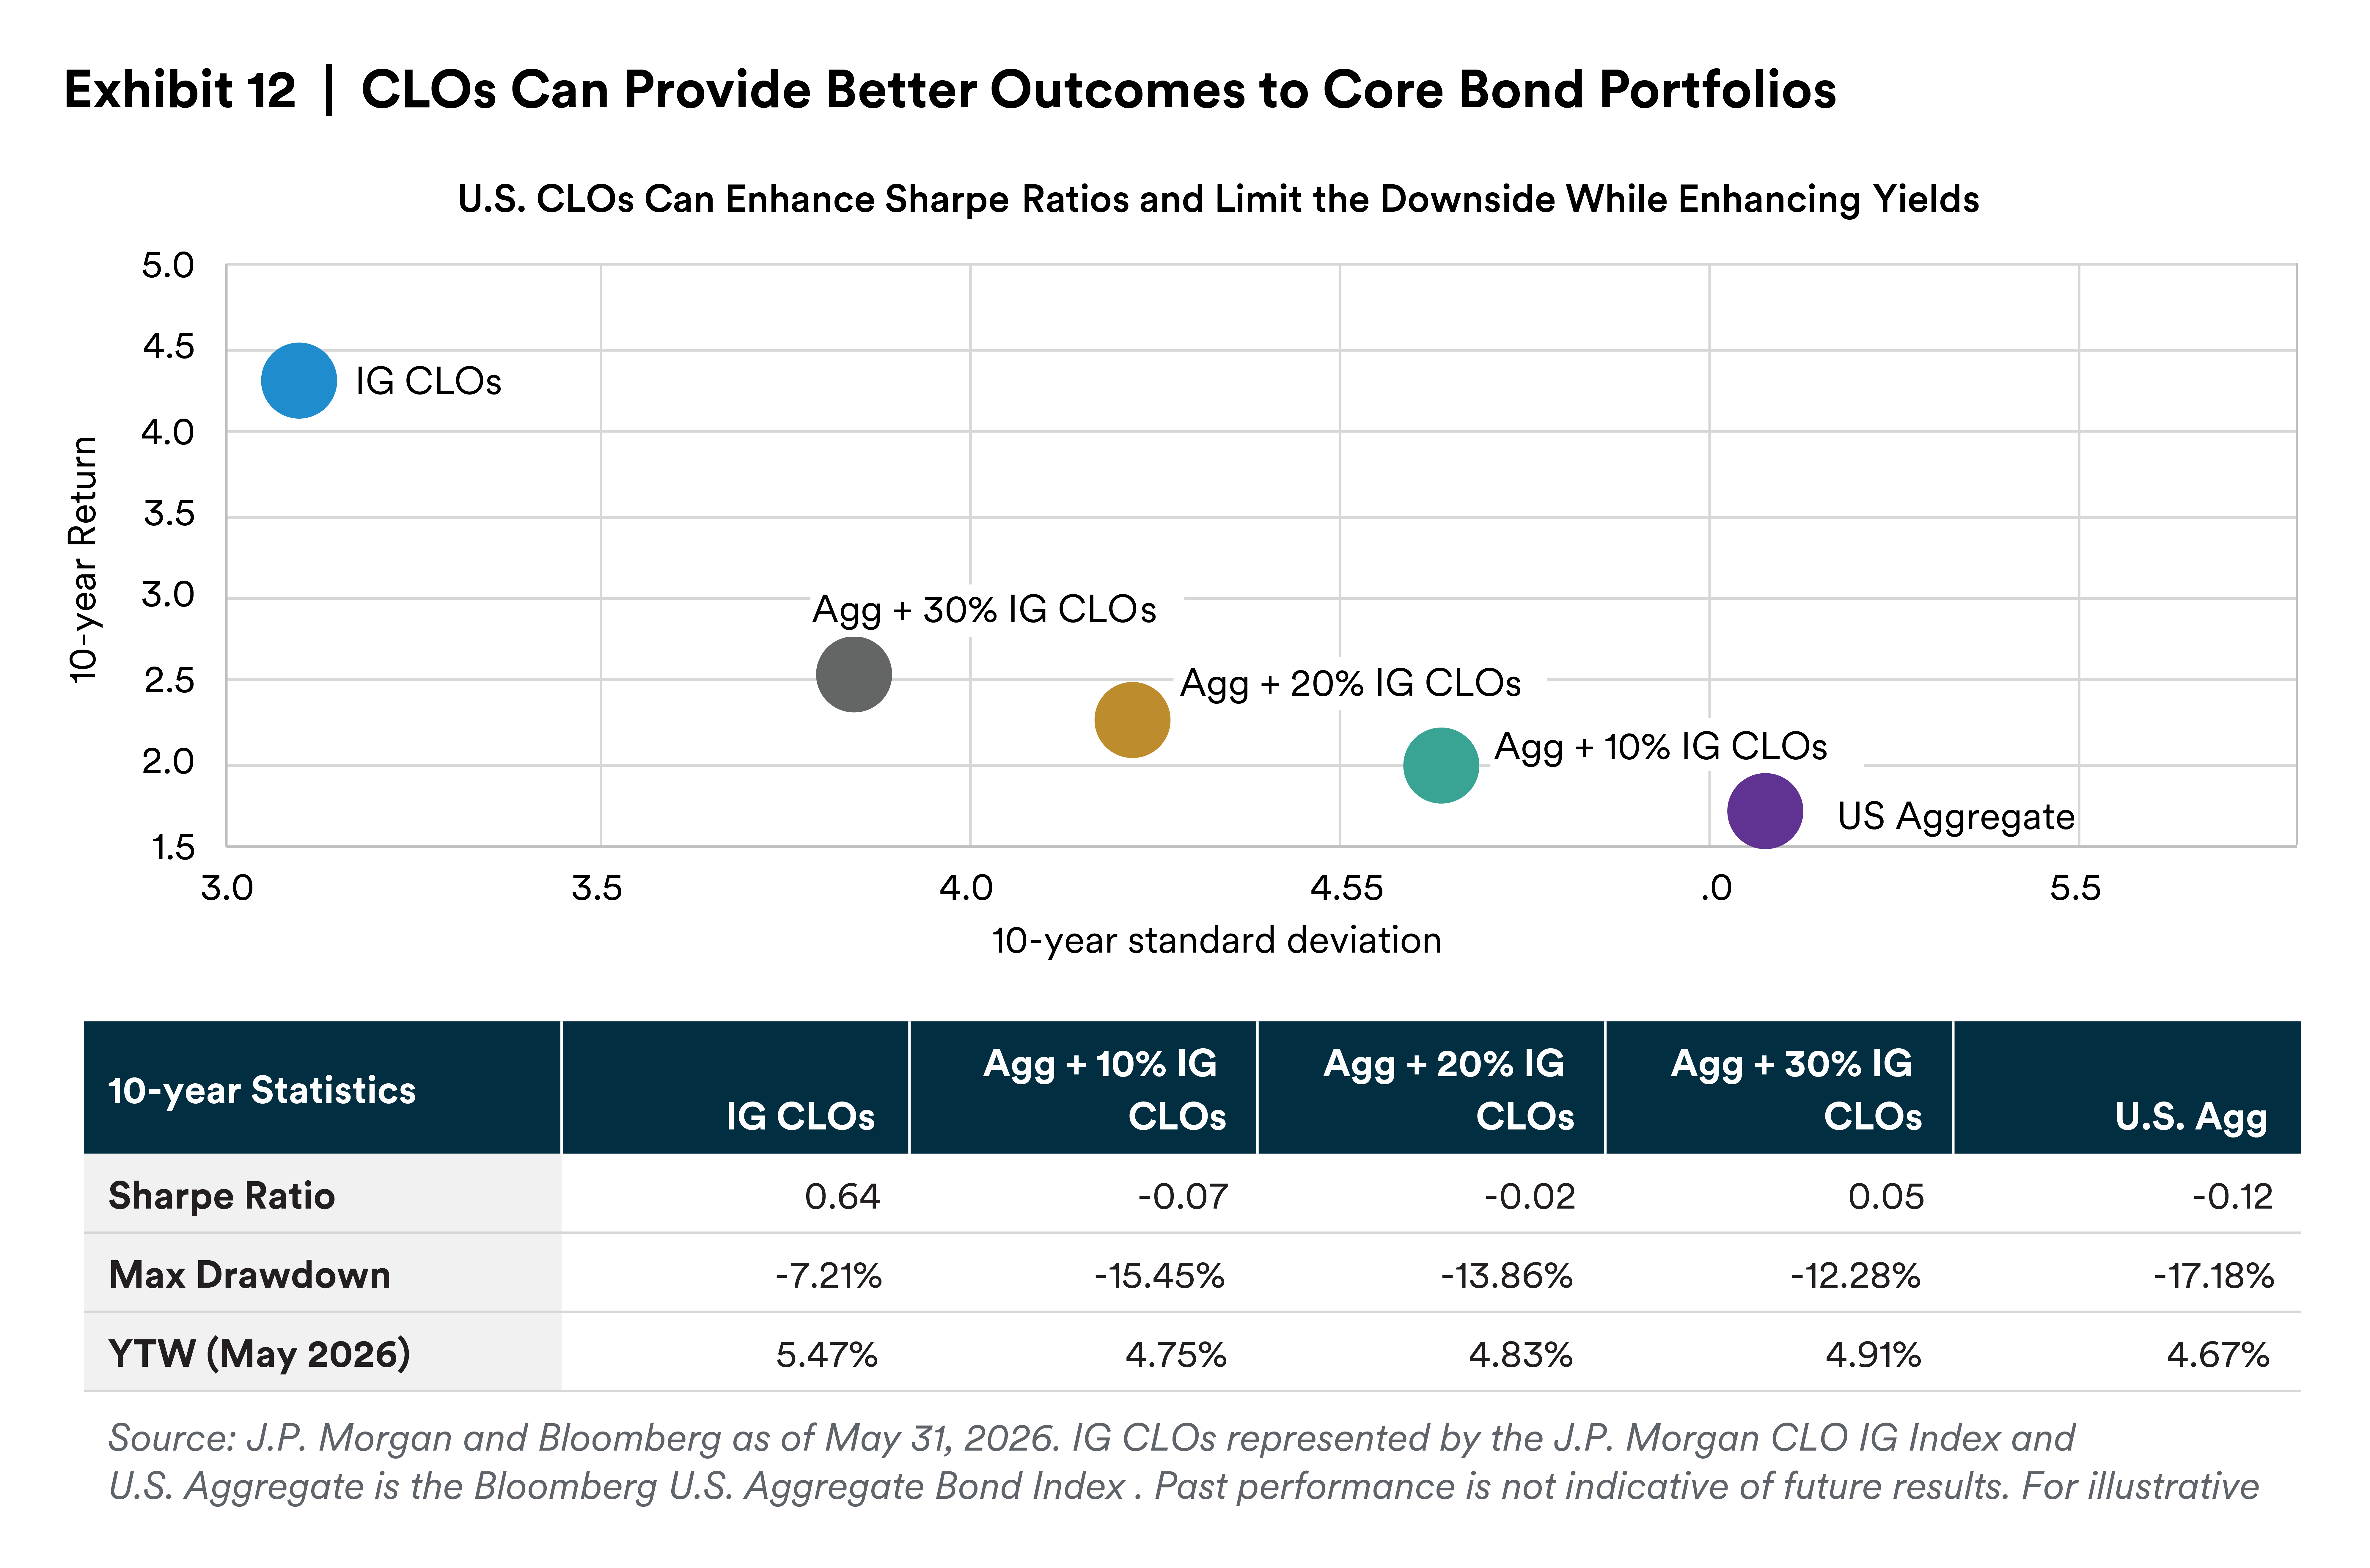
Adding CLOs may provide better outcomes, particularly as a complement to core bond portfolios. The chart below illustrates how 10% to 30% allocations to CLOs can enhance Sharpe ratios while decreasing the maximum drawdown and enhancing overall yield versus a pure core bond allocation.
The complexity of CLOs comes with a number of risks that investors should consider carefully.
Collateral credit risk. While CLOs enjoy strong credit quality due to the senior secured status of leveraged loans, it’s important to keep in mind that leveraged loans carry inherent credit risk: They’re issued to below-investment-grade companies whose revenue streams are sensitive to fluctuations in the economic cycle.
Collateral deterioration. If a CLO’s loans experience losses, cash flows are allocated to tranches in order of seniority. Depending on the severity of the losses, the value of the equity tranche could be wiped out and junior CLO tranches could lose principal.
Non-recourse and not guaranteed. Leveraged loans are senior obligations and, as such, have full recourse to the borrower and its assets in the event of default. A CLO, however, has recourse only to the principal and interest payments of the loans in the portfolio.
Loan prepayments. Leveraged loan borrowers may choose to prepay their loans in pieces or completely. While experienced CLO managers may anticipate prepayments, they’re nonetheless unpredictable. The size, timing and frequency of prepayments could potentially disrupt cash flows and challenge managers’ ability to maximize portfolio value.
Trading liquidity. CLOs generally enjoy healthy trading liquidity, but that could change quickly if market conditions turn. A prime example is the financial crisis, when trading activity for even the most liquid debt instruments slowed to a trickle. While senior tranches are typically very liquid throughout a market cycle, lower-rated mezzanine tranches can see significant declines in trading activity during periods of severe market stress.
Timing of issuance. While market conditions could be strong when a CLO is issued, they might not be during its reinvestment period. We saw this with the 2003 vintages, whose reinvestment period coincided with the onset of the financial crisis and its resulting drop-off in trading volume.
Manager dispersion. Historical performance of CLO managers encompasses a wide spectrum of returns, underscoring the importance of choosing seasoned managers with solid long-term track records.
Spread duration. While interest rate duration is low due to the floating-rate nature of CLO tranches (indexed off three-month SOFR and Euribor), spread duration should be taken into account. Due to CLOs’ typical reinvestment period of four to five years, spread duration is usually between 3.5 and nine years. Because each CLO is redeemed sequentially, the higher up the capital stack, the lower the spread duration (and vice versa), making spread duration higher in the lower-rated tranches.
The most critical decision a CLO investor can make is the selection of a manager. There are approximately 230 managers14 with post-crisis CLOs to choose from, and each creates its own portfolio using its own investment style. And it’s worth repeating that historical performance among managers varies greatly. That said, successful managers tend to share several key traits:
Extensive experience
There’s no substitute for deep CLO management experience, which provides the combination of skills, practice, tactical and strategic savvy, adjustment-making and chronological perspective needed to generate strong returns in such a complex asset class.
Perspective spanning multiple cycles may be the most important aspect of experience in the CLO realm, as the benefit of having managed portfolios before, during and after the financial crisis and through an evolving regulatory landscape is incalculable.
Excellence of execution
Managers should show strong abilities in the vital competencies that collectively define best-practice portfolio management. These begin with loan selection, as creating a strong collateral base lays the foundation for potential success. Trading skills enable the manager to know when to take gains, avoid losses and adjust the portfolio as market conditions evolve. Effective management of deteriorating credits affects not just the specific credits involved, but also the entire CLO due to the way cash flows are distributed through the tranche structure. And the reinvestment of principal proceeds in new collateral can make the difference between good and great performance.
Expertise in handling risk
Sound risk management is both a cause and an effect of these best practices: It informs everything the manager does and is reflected in the results. In addition to oversight of the portfolio, it includes skillful execution of coverage tests; the ability to understand the nuances and idiosyncrasies of CLO documentation, which is nonstandard and complex; and a talent for balancing the numerous portfolio metrics by optimizing as many as possible while taking a hit on as few as possible.
Endnotes
1 Source: Barclays Research, Kanerai, Intex and Bloomberg as of May 31, 2026. Includes U.S. Broadly Syndicated Loan, U.S. Middle Market and European CLOs. European CLO market of EUR308 billion converted to USD at exchange rate of 1.1659 USD/EUR.
2 Source: BofA Global Research, Intex as of May 31, 2026. $1.0 trillion in broadly syndicated loans and $161 billion in middle market CLOs.
3 Source: BofA Global Research, Intex, Bloomberg, IGM, Creditflux and IFR as of April 30, 2026.
4 Source: Barclays Research, Kanerai, Intex and Bloomberg as of May 31, 2026. Excludes U.S. Middle Market CLOs. European CLO market of EUR308 billion converted to USD at exchange rate of 1.1659 USD/EUR.
5 Source: Pitchbook LCD, “Leveraged Loan Primer,” June 25, 2026.
6 Source: LCD, based on the Morningstar LSTA Leveraged Loan Index and Morningstar LSTA European Leveraged Loan Index, as of May 31, 2026.
7 Source: Intex and PineBridge Investments as of January 31, 2026.
8 Source: BofA Global Research, Bloomberg, “CLO Factbook” as of June 12, 2026.
9 The income generated by the underlying pool of loans must be greater than the interest due on the outstanding debt in the CLO.
10 The principal amount of the underlying pool of loans must be greater than the principal amount of the outstanding CLO tranches.
11 Source: Morgan Stanley Research, “A Primer on Global Collateralized Loan Obligations (CLOs),” published September 20, 2021.
12 Source: Moody's Investors Service, “Impairment and loss rates of global CLOs: 1993-2024,” published June 23, 2025, and “Default Trends – Global: Annual default study: Corporate default rate to fall below its long-term average in 2025,” published March 27, 2025. Data for both CLOs and corporates through year-end 2024.
13 This should not be considered an exhaustive list of potential risk factors related to CLOs, rather an illustrative description of some potential factors affecting a CLO investment.
14 Source: Intex and PineBridge Investments as of January 31, 2024.
Disclaimer
This material is intended solely for Institutional Investors, Qualified Investors and Professional Investors. This analysis is not intended for distribution with Retail Investors.
MetLife Investment Management (MIM), which includes PineBridge Investments, is MetLife Inc.’s institutional investment management business. MIM is a group of international companies that provides investment advice and markets asset management products and services to clients around the world.
This document is solely for informational purposes and does not constitute a recommendation regarding any investments or the provision of any investment advice, or constitute or form part of any advertisement of, offer for sale or subscription of, solicitation or invitation of any offer or recommendation to purchase or subscribe for any securities or investment advisory services. The views expressed herein are solely those of MIM and do not necessarily reflect, nor are they necessarily consistent with, the views held by, or the forecasts utilized by, the entities within the MetLife enterprise that provide insurance products, annuities and employee benefit programs. The information and opinions presented or contained in this document are provided as of the date it was written. It should be understood that subsequent developments may materially affect the information contained in this document, which none of MIM, its affiliates, advisors or representatives are under an obligation to update, revise or affirm. It is not MIM’s intention to provide, and you may not rely on this document as providing, a recommendation with respect to any particular investment strategy or investment. Affiliates of MIM may perform services for, solicit business from, hold long or short positions in, or otherwise be interested in the investments (including derivatives) of any company mentioned herein. This document may contain forward-looking statements, as well as predictions, projections and forecasts of the economy or economic trends of the markets, which are not necessarily indicative of the future. Any or all forward-looking statements, as well as those included in any other material discussed at the presentation, may turn out to be wrong.
The various global teams referenced in this document, including portfolio managers, research analysts and traders are employed by the various legal entities that comprise MIM.
All investments involve risks including the potential for loss of principle and past performance does not guarantee similar future results.
For investors in the U.S.: This document is communicated by MetLife Investment Management, LLC (MIM, LLC), a U.S. Securities and Exchange Commission (SEC) registered investment adviser. Registration with the SEC does not imply a certain level of skill or that the SEC has endorsed the investment adviser.
For investors in the UK: This document is being distributed by MetLife Investment Management Limited (“MIML”), authorised and regulated by the UK Financial Conduct Authority (FCA reference number 623761), registered address One Angel Lane 8th Floor London EC4R 3AB United Kingdom. This document is approved by MIML as a financial promotion for distribution in the UK. This document is only intended for, and may only be distributed to, investors in the UK who qualify as a "professional client" as defined under the Markets in Financial Instruments Directive (2014/65/EU), as per the retained EU law version of the same in the UK.
For investors in the Middle East: This document is directed at and intended for institutional investors (as such term is defined in the various jurisdictions) only. The recipient of this document acknowledges that (1) no regulator or governmental authority in the Gulf Cooperation Council (“GCC”) or the Middle East has reviewed or approved this document or the substance contained within it, (2) this document is not for general circulation in the GCC or the Middle East and is provided on a confidential basis to the addressee only, (3) MetLife Investment Management is not licensed or regulated by any regulatory or governmental authority in the Middle East or the GCC, and (4) this document does not constitute or form part of any investment advice or solicitation of investment products in the GCC or Middle East or in any jurisdiction in which the provision of investment advice or any solicitation would be unlawful under the securities laws of such jurisdiction (and this document is therefore not construed as such).
For investors in Japan: This document is being distributed by MetLife Investment Management Japan, Ltd. (“MIM JAPAN”), a registered Financial Instruments Business Operator (“FIBO”) conducting Investment Advisory Business, Investment Management Business and Type II Financial Instruments Business under the registration entry “Director General of the Kanto Local Finance Bureau (Financial Instruments Business Operator) No. 2414” pursuant to the Financial Instruments and Exchange Act of Japan (“FIEA”), and a regular member of the Investment Management Association of Japan and the Type II Financial Instruments Firms Association of Japan. In its capacity as a discretionary investment manager registered under the FIEA, MIM JAPAN provides investment management services and also sub-delegates a part of its investment management authority to other foreign investment management entities within MIM in accordance with the FIEA. This document is only being provided to investors who are general employees' pension fund based in Japan, business owners who implement defined benefit corporate pension, etc. and Qualified Institutional Investors domiciled in Japan. It is the responsibility of each prospective investor to satisfy themselves as to full compliance with the applicable laws and regulations of any relevant territory, including obtaining any requisite governmental or other consent and observing any other formality presented in such territory. As fees to be borne by investors vary depending upon circumstances such as products, services, investment period and market conditions, the total amount nor the calculation methods cannot be disclosed in advance. All investments involve risks including the potential for loss of principle and past performance does not guarantee similar future results. Investors should obtain and read the prospectus and/or document set forth in Article 37-3 of Financial Instruments and Exchange Act carefully before making the investments.
For Investors in Hong Kong S.A.R.: MetLife Investment Management and PineBridge Investments operate through the following entities: MetLife Investments Asia Limited (“MIAL”), licensed by the Securities and Futures Commission (“SFC”) for Type 1 (dealing in securities), Type 4 (advising on securities) and Type 9 (asset management) regulated activities, PineBridge Investments Asia Limited licensed by the SFC for Type 1 (dealing in securities), Type 4 (advising on securities) and Type 9 (asset management) regulated activities, and PineBridge Investments Hong Kong Limited licensed by the SFC for Type 1 (dealing in securities) and Type 9 (asset management) regulated activities. Unless otherwise stated, none of the authors of this article, interviewees or referenced individuals are licensed by the SFC to carry on regulated activities in Hong Kong S.A.R. The information contained in this document is for information purposes only and it has not been reviewed by the Securities and Futures Commission. This document may also be distributed by certain PineBridge Investments affiliates acquired by MetLife Investment Management on December 30, 2025. For additional legal and regulatory disclosures including other cross border information, please refer to https://www.pinebridge.com/en/regulatory-disclosure.
For investors in Australia: This information is distributed by MIM LLC and is intended for “wholesale clients” as defined in section 761G of the Corporations Act 2001 (Cth) (the Act). MIM LLC exempt from the requirement to hold an Australian financial services license under the Act in respect of the financial services it provides to Australian clients. MIM LLC is regulated by the SEC under US law, which is different from Australian law.
For investors in the EEA: This document is being distributed by MetLife Investment Management Europe Limited (“MIMEL”), authorised and regulated by the Central Bank of Ireland (registered number: C451684), registered address 20 on Hatch, Lower Hatch Street, Dublin 2, Ireland. This document is approved by MIMEL as marketing communications for the purposes of the EU Directive 2014/65/EU on markets in financial instruments (“MiFID II”). Where MIMEL does not have an applicable cross-border licence, this document is only intended for, and may only be distributed on request to, investors in the EEA who qualify as a “professional client” as defined under MiFID II, as implemented in the relevant EEA jurisdiction. The investment strategies described herein are directly managed by delegate investment manager affiliates of MIMEL. Unless otherwise stated, none of the authors of this article, interviewees or referenced individuals are directly contracted with MIMEL or are regulated in Ireland. Unless otherwise stated, any industry awards referenced herein relate to the awards of affiliates of MIMEL and not to awards of MIMEL.