The leveraged finance market is currently grappling with an “AI inflection point,” where the early promise of greater efficiency is giving way to a more uncertain outlook, with potential AI-related pressures on revenues and margins. This shift has introduced a sense of anxiety as investors increasingly scrutinize the actual cost of adoption on an issuer-by-issuer basis. Behind this angst is the realization that AI may cannibalize existing business models and provide increased pricing transparency in certain industries that have long benefited from opacity. This tension is manifesting in the credit markets as a “sell first” mentality, especially as fundamental cracks begin to show, with default activity rising in the technology and services sectors.
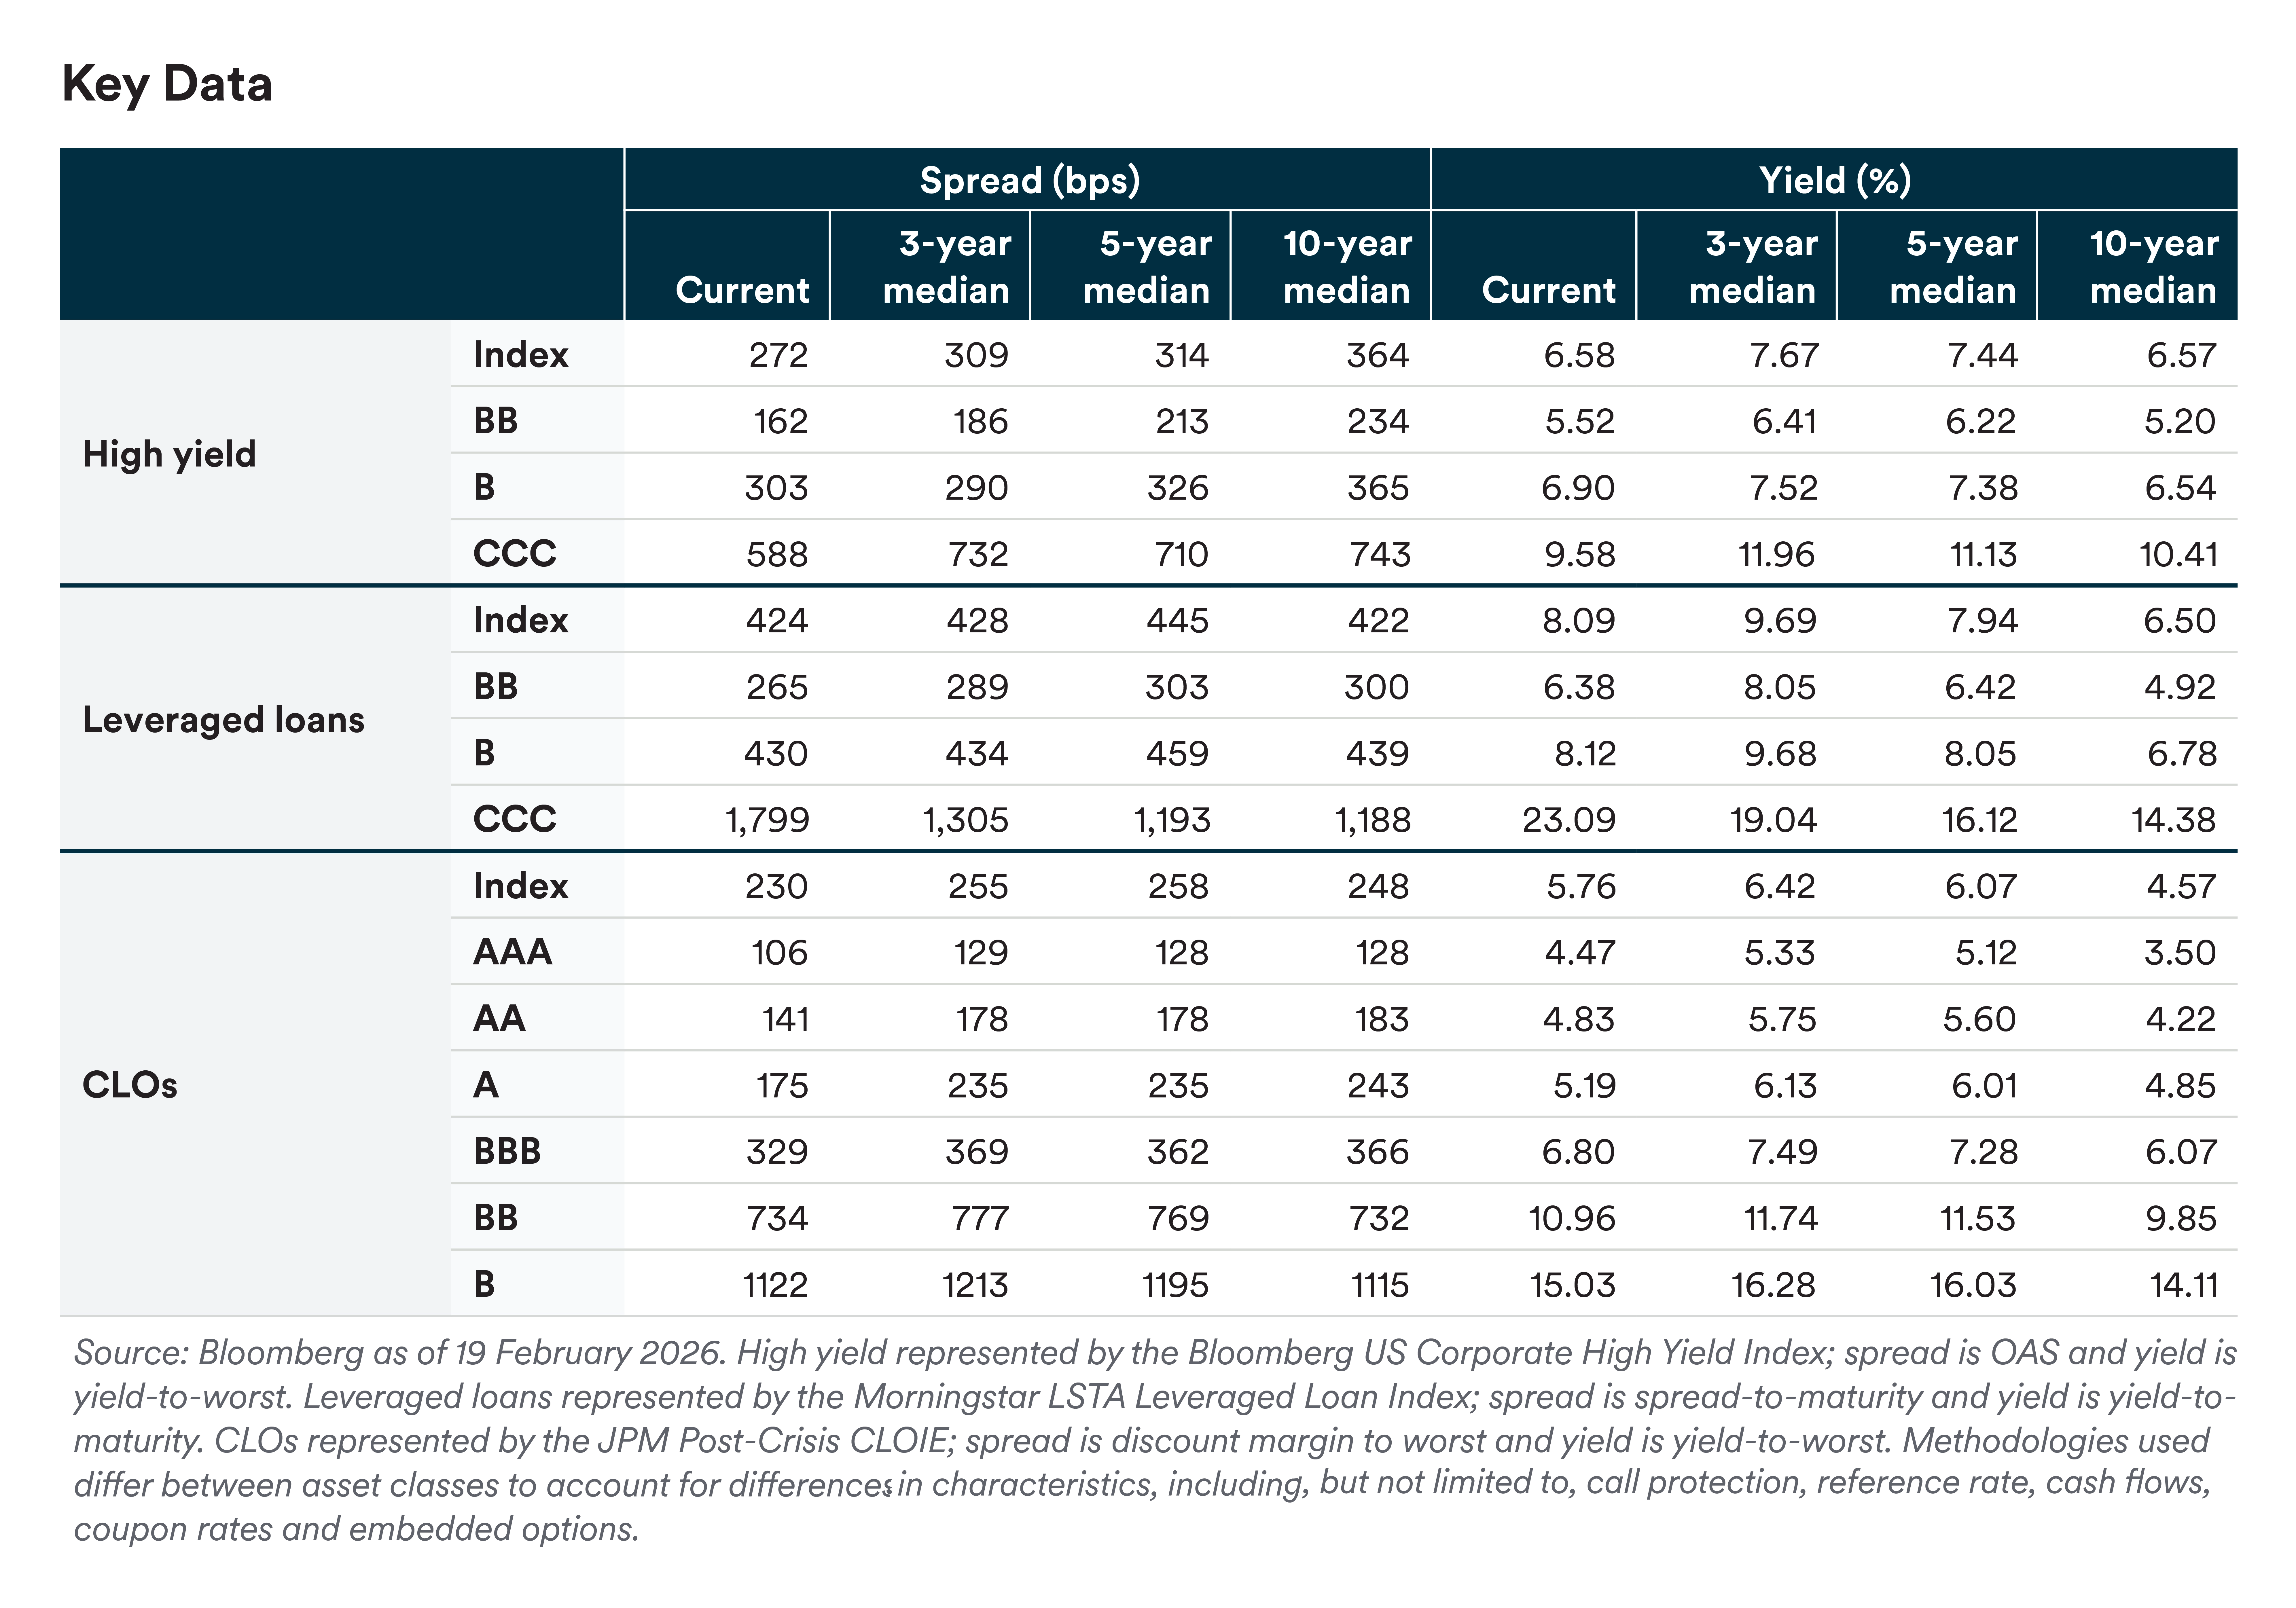
Despite these AI-related headwinds, the broader credit environment is supported by resilient macro factors and fundamental tailwinds. Revenue growth remains sustained across high yield (HY) and leveraged loan issuers, bolstered by a labor market that continues to show strength through decent job creation and manageable unemployment. The Fed’s easing stance combined with overall strong earnings from “AI ecosystem enablers” – such as tech hardware, capital goods, and utilities – have provided a necessary cushion. Furthermore, the overall high yield market continues to show resilience, with index-level spreads trading around 300 basis points (272 option-adjusted spread/298 spread-to-worst) and strong demand for new issuance. Sentiment in the loan market is not as strong given the relatively higher concentration of issuers in the software sector, but valuations are still trading well inside of longer-term averages.
Our outlook remains relatively constructive but heavily split between likely winners and losers. While the market is optimistic about hardware and power providers, fueled by datacenter buildouts, a cautious stance is warranted for software and business services companies that are most vulnerable to AI disruption. These sectors are seeing loan and bond prices come under pressure as investors reassess companies’ business models to account for potential obsolescence. Consequently, we favor higher-quality assets and moderate positioning, with a focus on navigating the volatility caused by subsector dispersion while watching for further signs of AI-led distress in lower-rated, smaller-cap issuers.
Overall, we expect positive, carry-based total returns for high yield bonds. While spreads have not widened relative to certain other credit markets (such as bank loans), we view relative valuations as reasonable given the lower concentration of technology issuers in the high yield market.
Thus far in 2026, markets have focused on the potentially negative intermediate- to long-term impact of AI technologies on a range of issuers, particularly those in the software and B2B services sectors. While we believe AI will affect many businesses, we view the breadth of related volatility as excessive. Last-12-months (LTM) par-weighted default rates rose slightly month-over-month through January to 1.97%/1.12% (with/ without distressed exchanges). Ratings activity was positive in January, with a par-weighted upgrade/downgrade ratio of 1.83 (1.13 by issuer), versus 1.27 (1.03 by issuer) in January 2025. (Default and ratings statistics per JPMorgan as of 2 February 2026.)
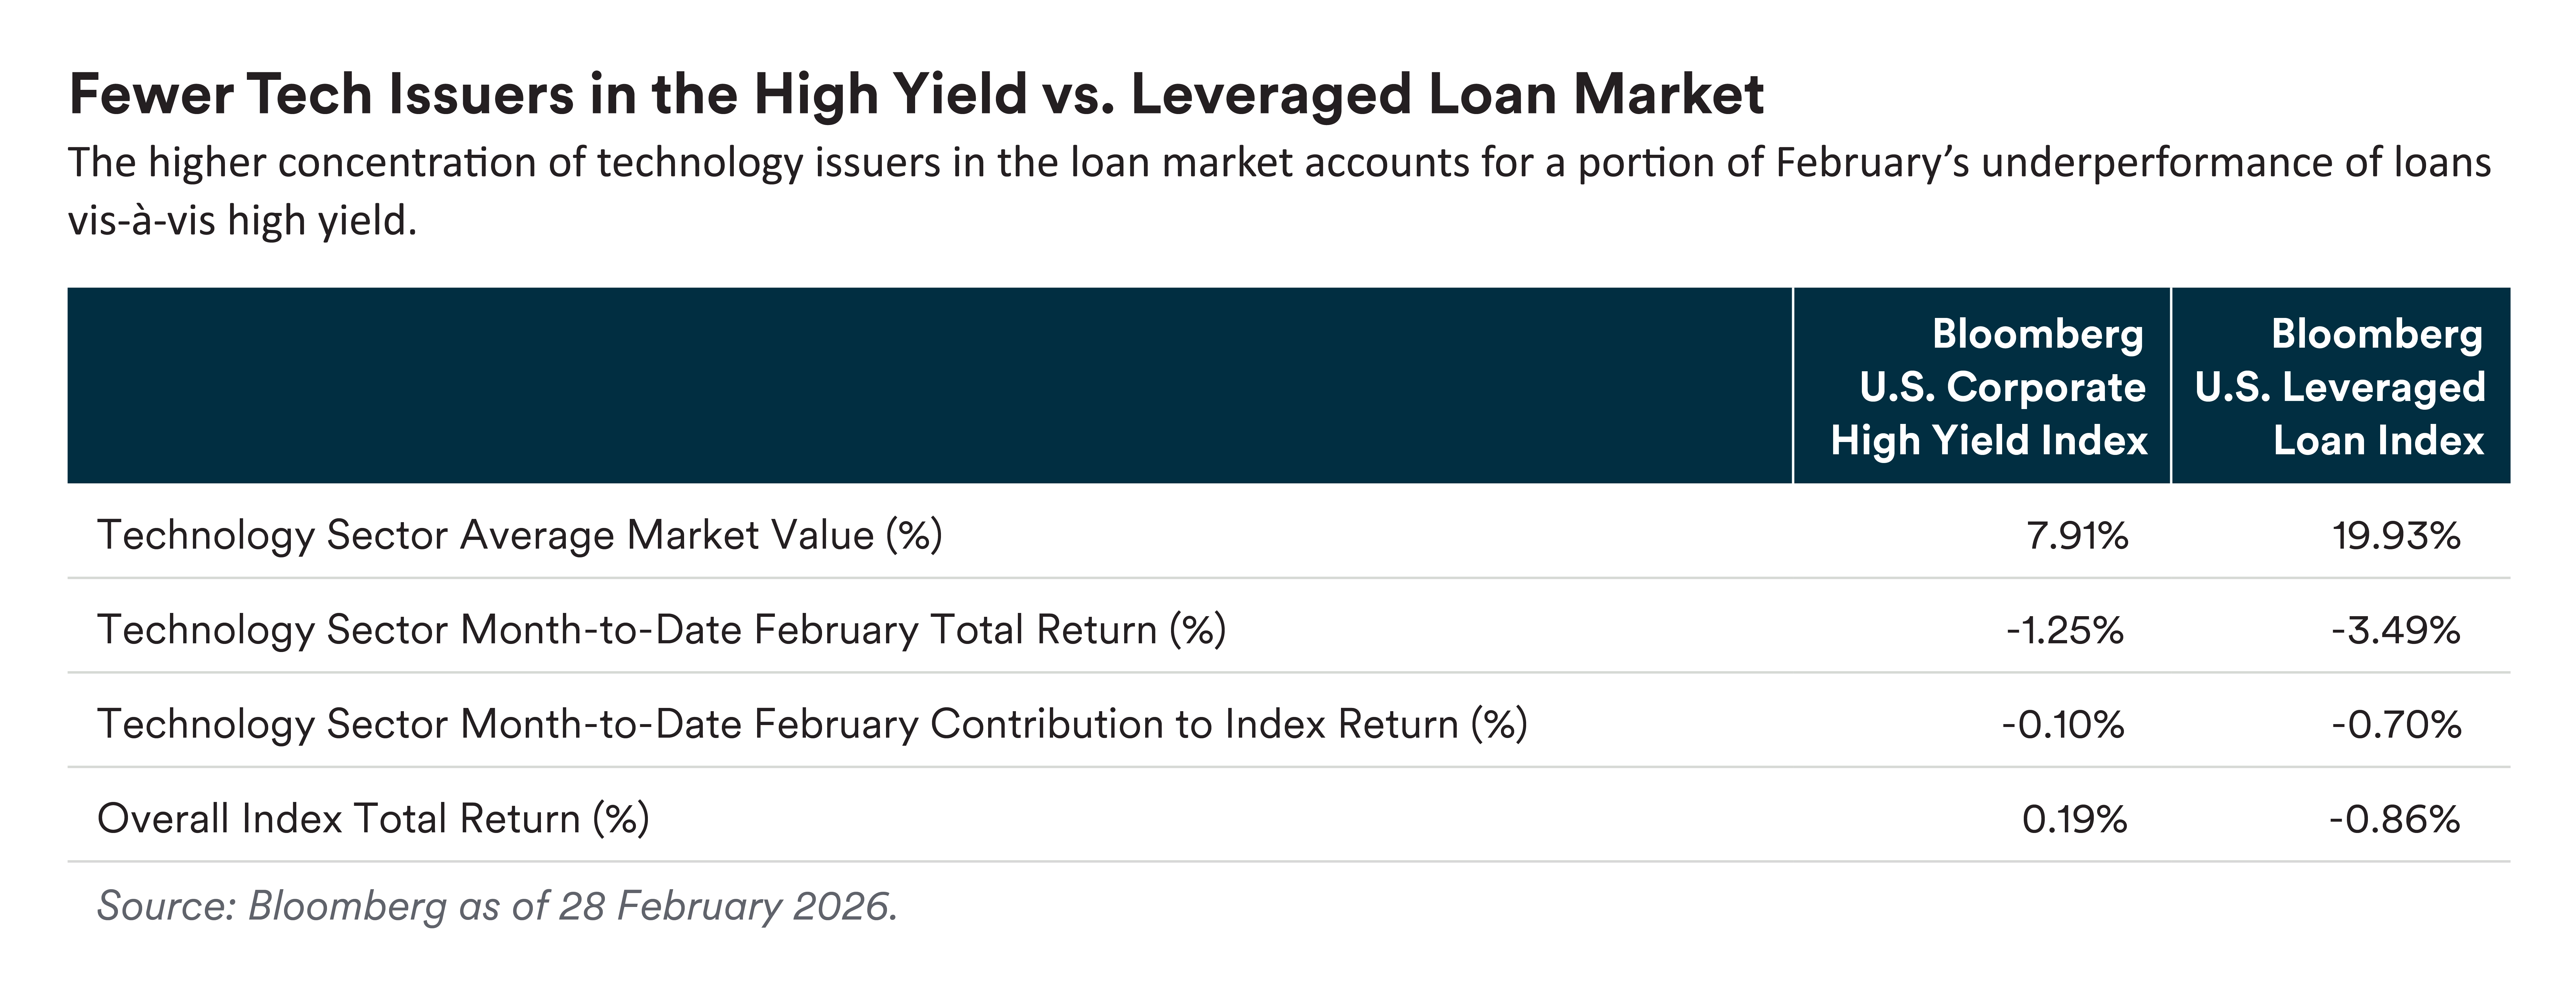
From a valuation standpoint, the Bloomberg US Corporate High Yield Index spread-to-worst is at 298 (BB 189, B 331, CCC 609), 9 basis points wider month-to-date (as of 17 February), while the yield to worst (YTW) is unchanged at 6.58%. Given the focus on AI disruption, technology spreads are now the widest in the benchmark, taking the crown from communications. The high yield market has held in better than the loan market given its lower concentration of tech issuers. We maintain our 2026 spread outlook, anticipating excess returns in line with or modestly below spreads. (All statistics per Bloomberg as of 17 February 2026.)
We don’t see much of a bull case for spreads beyond where they are now, while the bear case is a material slowing of the economy. US high yield new issuance totaled $30.0 billion in January, roughly in line with average 2024 and 2025 levels. Lower-quality issuance was high, at 14.6% of the total, versus 6.2% for 2023-2025. Fund flows were a headwind in January, at -$1.3 billion, the largest outflow since April 2025 (post-“Liberation Day”), and following strong flows of $18.9 billion for the full year. (All statistics per JPMorgan as of 2 February 2026.)
While current tight valuations can limit upside potential in fixed income in 2026, we believe high yield bonds remain an attractive asset class. All-in yields are adequately compensating investors for credit risk amid moderate default expectations. We view valuations as broadly fair in the context of our 2026 economic outlook, which would be supportive of reasonably tight valuations. With its more compelling yields, we view the belly of the high yield market – low-BB to mid-B rated bonds – as a sweet spot for investors. Overall, we expect positive, carry-based total returns for high yield bonds (but muted excess returns) and believe defaults could tick a bit higher in 2026, albeit from low current levels.
Current conditions in the leveraged loan market remain conducive to disciplined credit selection, though the majority of alpha may come from avoiding credits that are heading for distressed territory rather than picking those that just appear cheap.
Loan issuers continue to show solid fundamentals, with support from a stable macro backdrop. Strong capex spending from hyperscalers remains a key economic pillar, and this investment cycle – combined with a resilient labor market, with unemployment near 4.3% and steady payroll gains – is helping offset growing consumer pressures, such as slowing wage growth and rising delinquencies. Consumer spending and overall growth expectations should hold up barring a meaningful rise in layoffs.
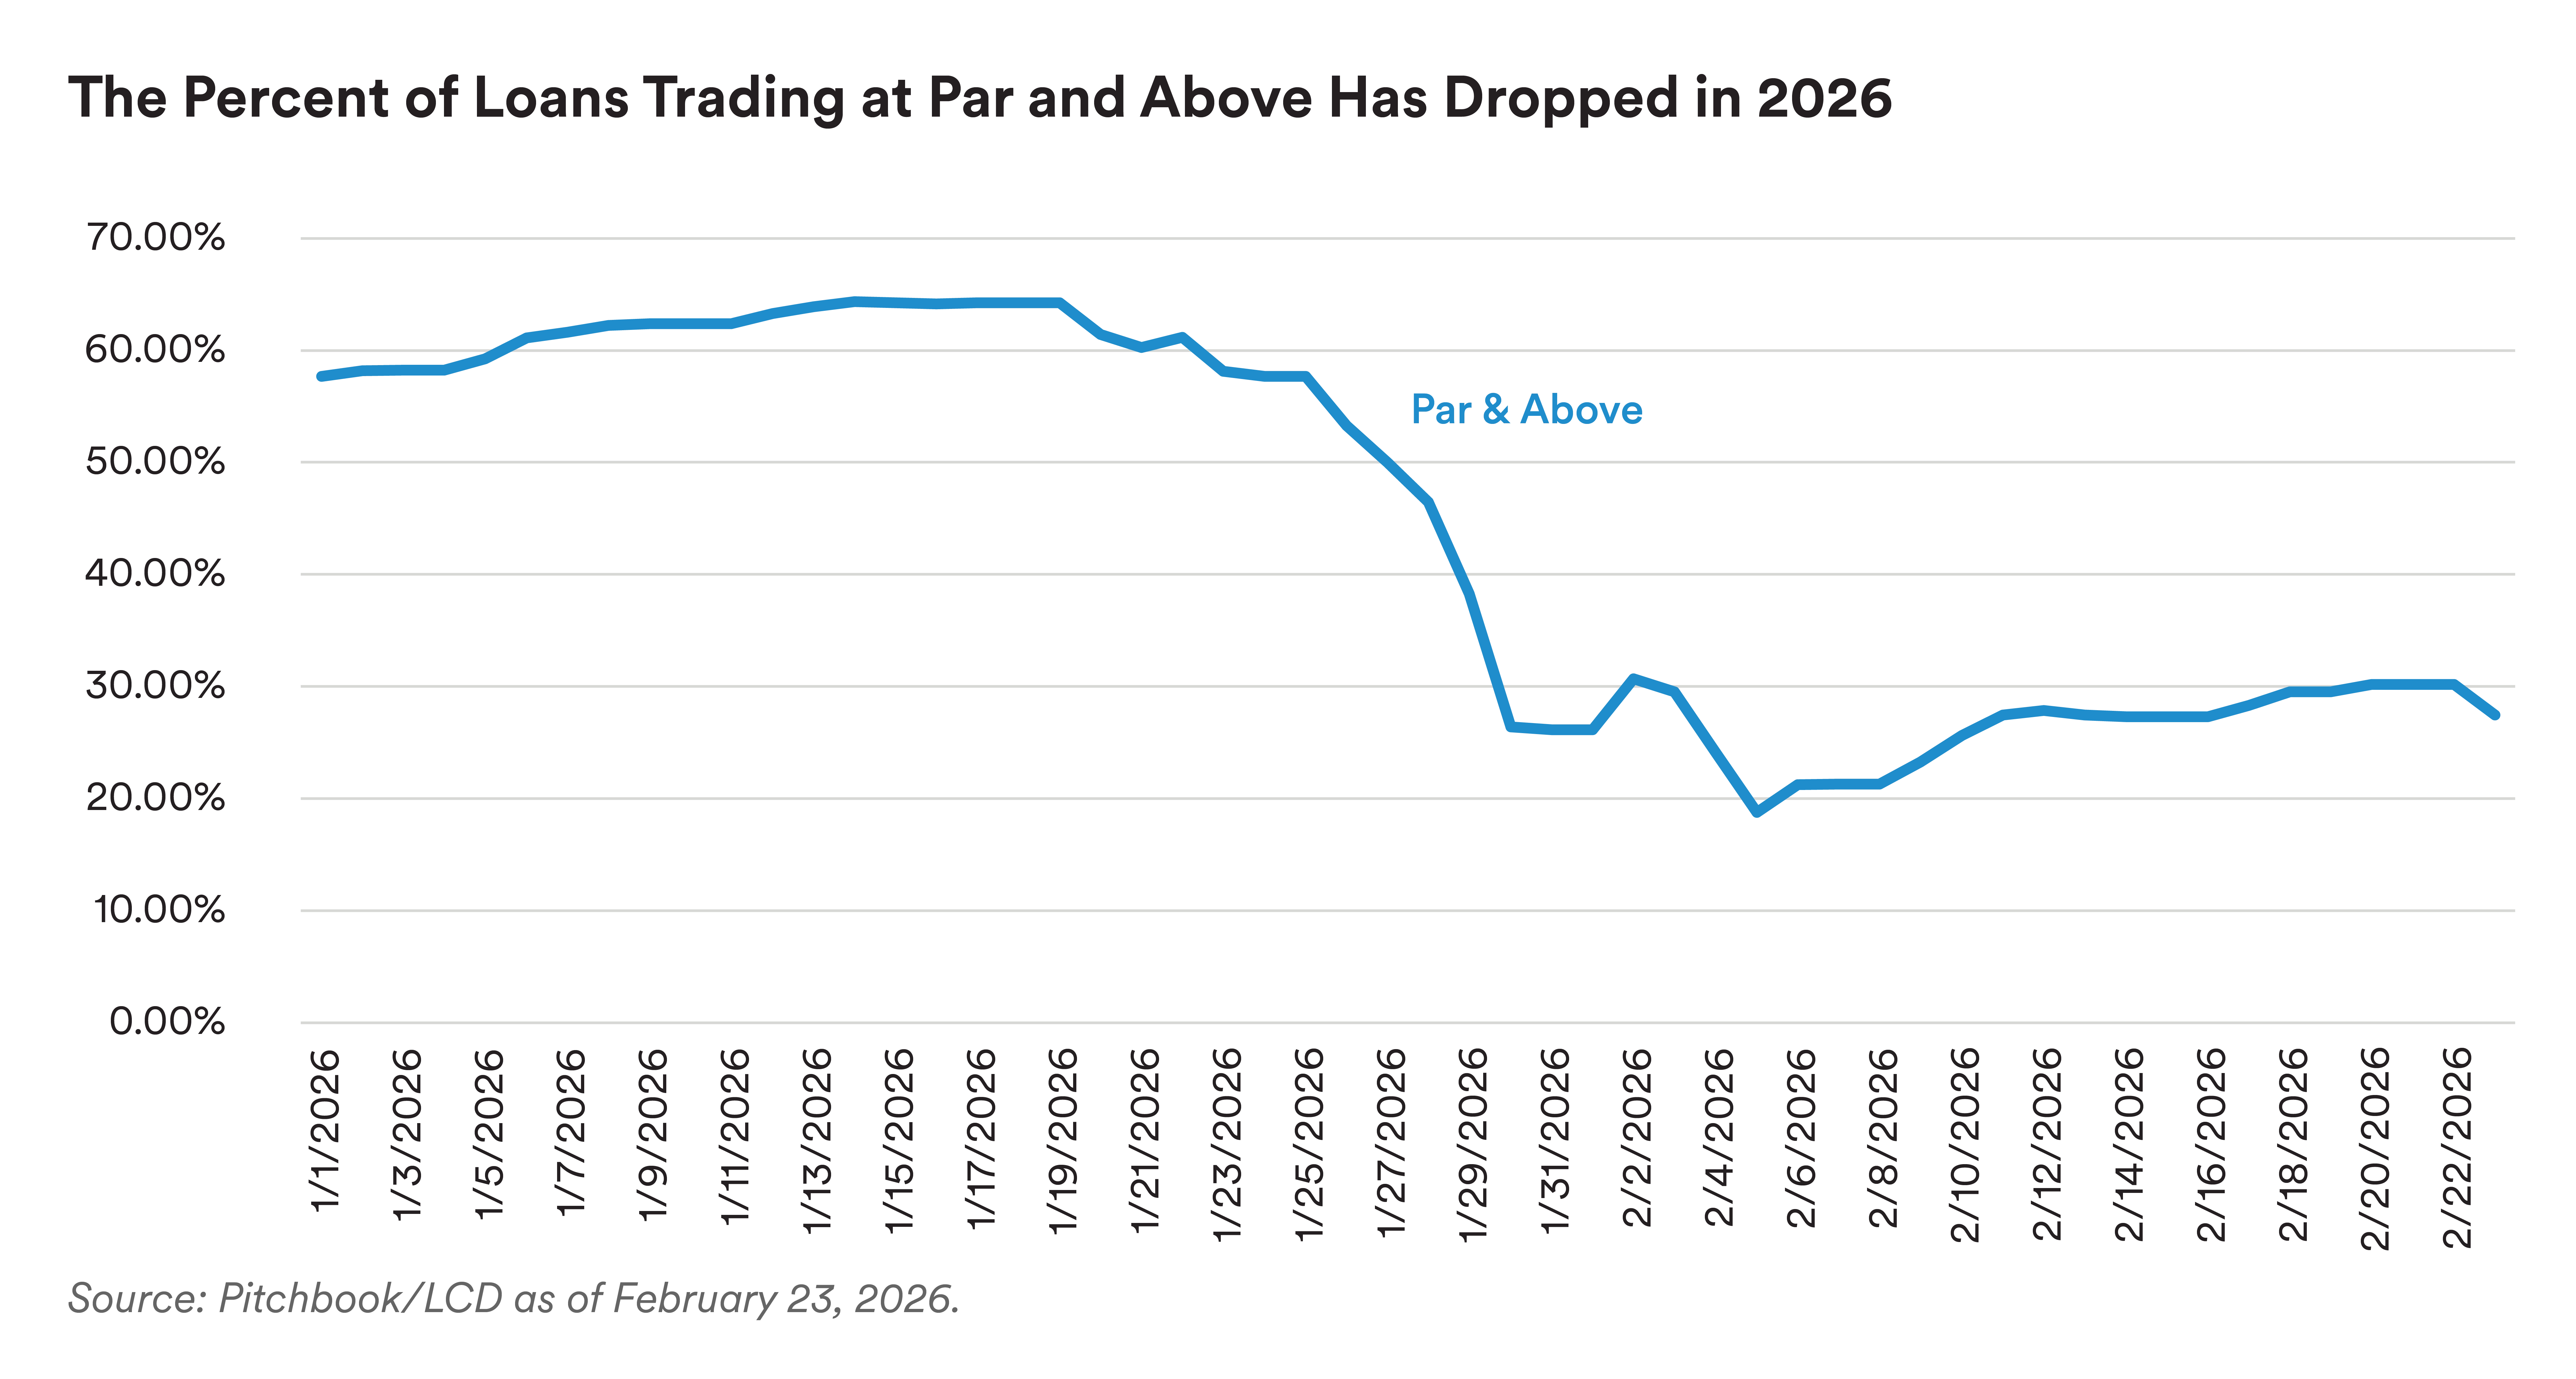
Despite modest, stable EBITDA growth and improving interest coverage ratios – with help from two rate cuts in late-2025 and ongoing repricing activity – market volatility has increased. Initial concerns about AI driven disruption in software have broadened to insurance brokers, logistics firms, and parts of commercial real estate, prompting investors to reassess business models and asset valuations. As a result, the share of the Morningstar Index trading at par or above has fallen sharply, from 67% in mid January to 30% as of 22 February (see chart). Selling pressure has been broad based, affecting even defensive names and creating opportunities for selective credit picking.
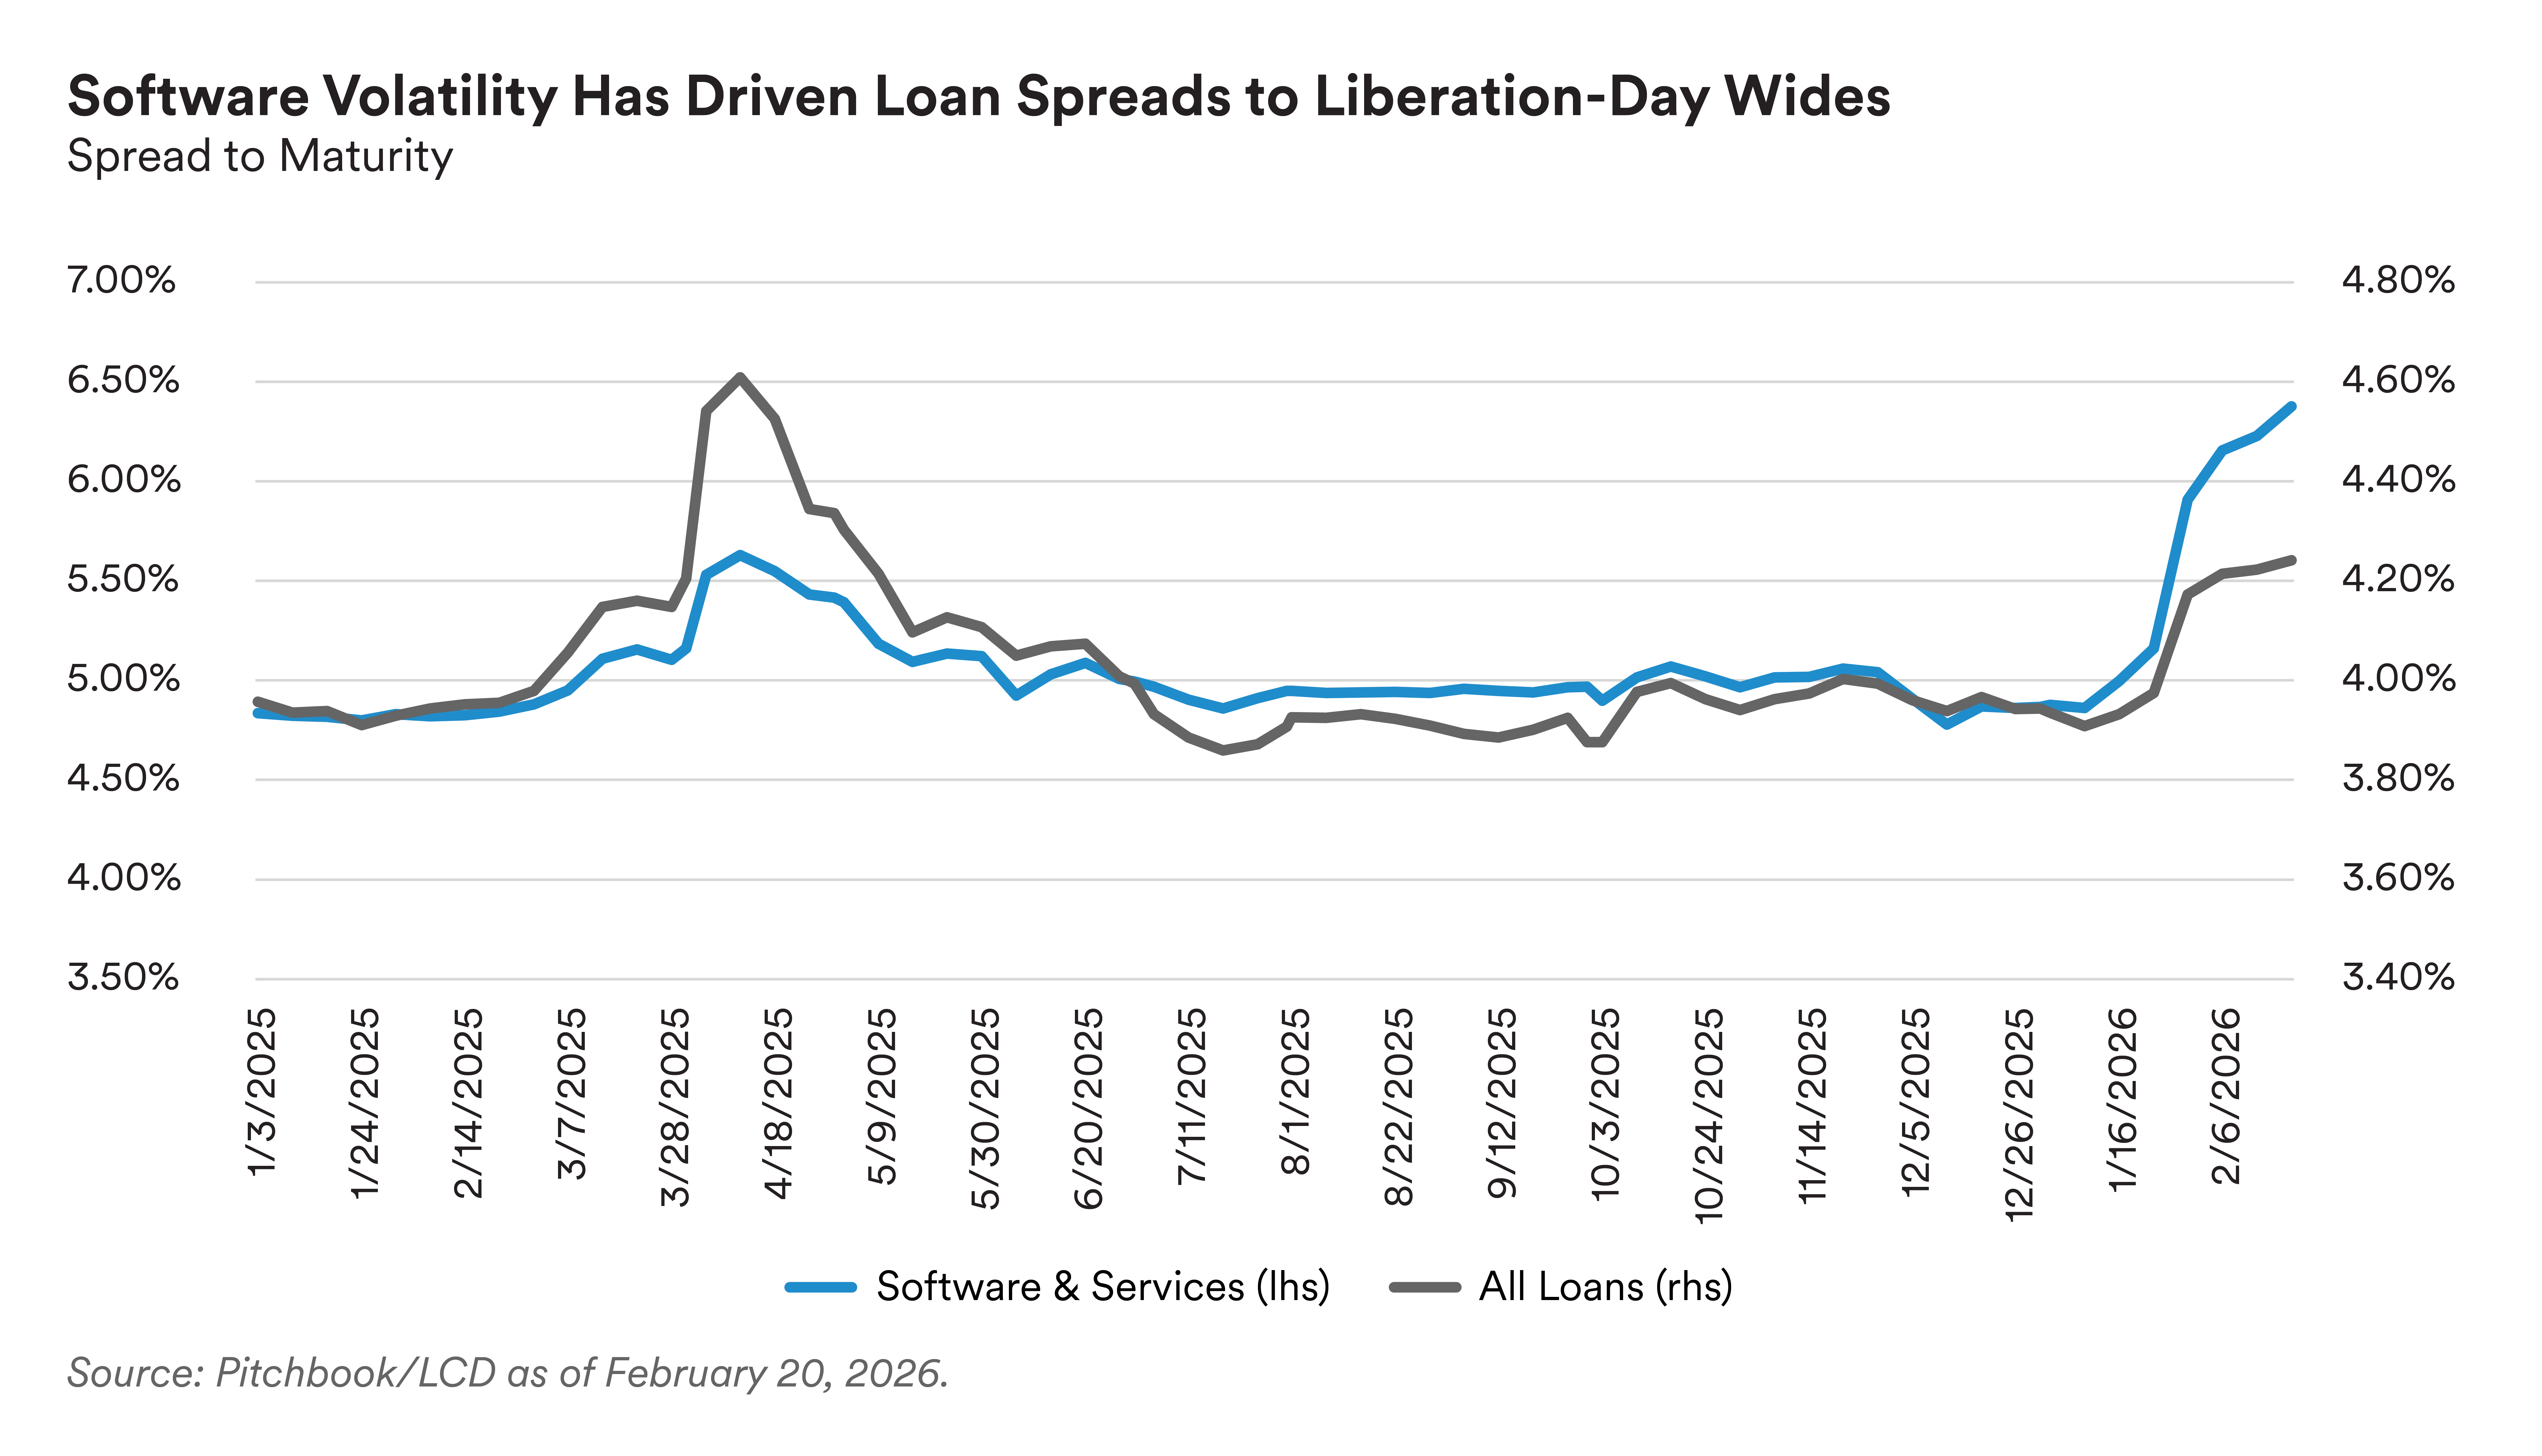
Technicals remain supportive as net loan supply continues to lag. Primary activity remains dominated by opportunistic repricings, while broader issuance has slowed due to AI related volatility. Repayments continue to exceed new supply, reducing outstanding loans and supporting demand for performing credits, particularly in sectors less exposed to AI disintermediation. However, conditions could turn more neutral if certain factors weigh on collateralized loan obligation (CLO) issuance – including a decline in CLO equity distributions, managers forced to realize losses in software, or rising defaults that pressure portfolio tests. Retail flows remain flat and are likely to track shifts in risk sentiment and rate cut expectations. Recent volatility has pushed loan spreads to the widest levels since just after “Liberation Day” in April 2025. Overall yields remain lower due to prior Fed cuts, but with reduced consensus on further easing, yields should stay relatively stable absent external shocks.
We believe CLOs have attractive total return potential relative to other equivalently rated fixed income assets. Despite recent softness driven by the selloff of loans in the software sector, the technical picture appears supportive given strong ETF and institutional demand and high redemption and amortization volumes. We expect to see a bifurcated market favoring CLO managers who focus on credit selection to mitigate downside risks.
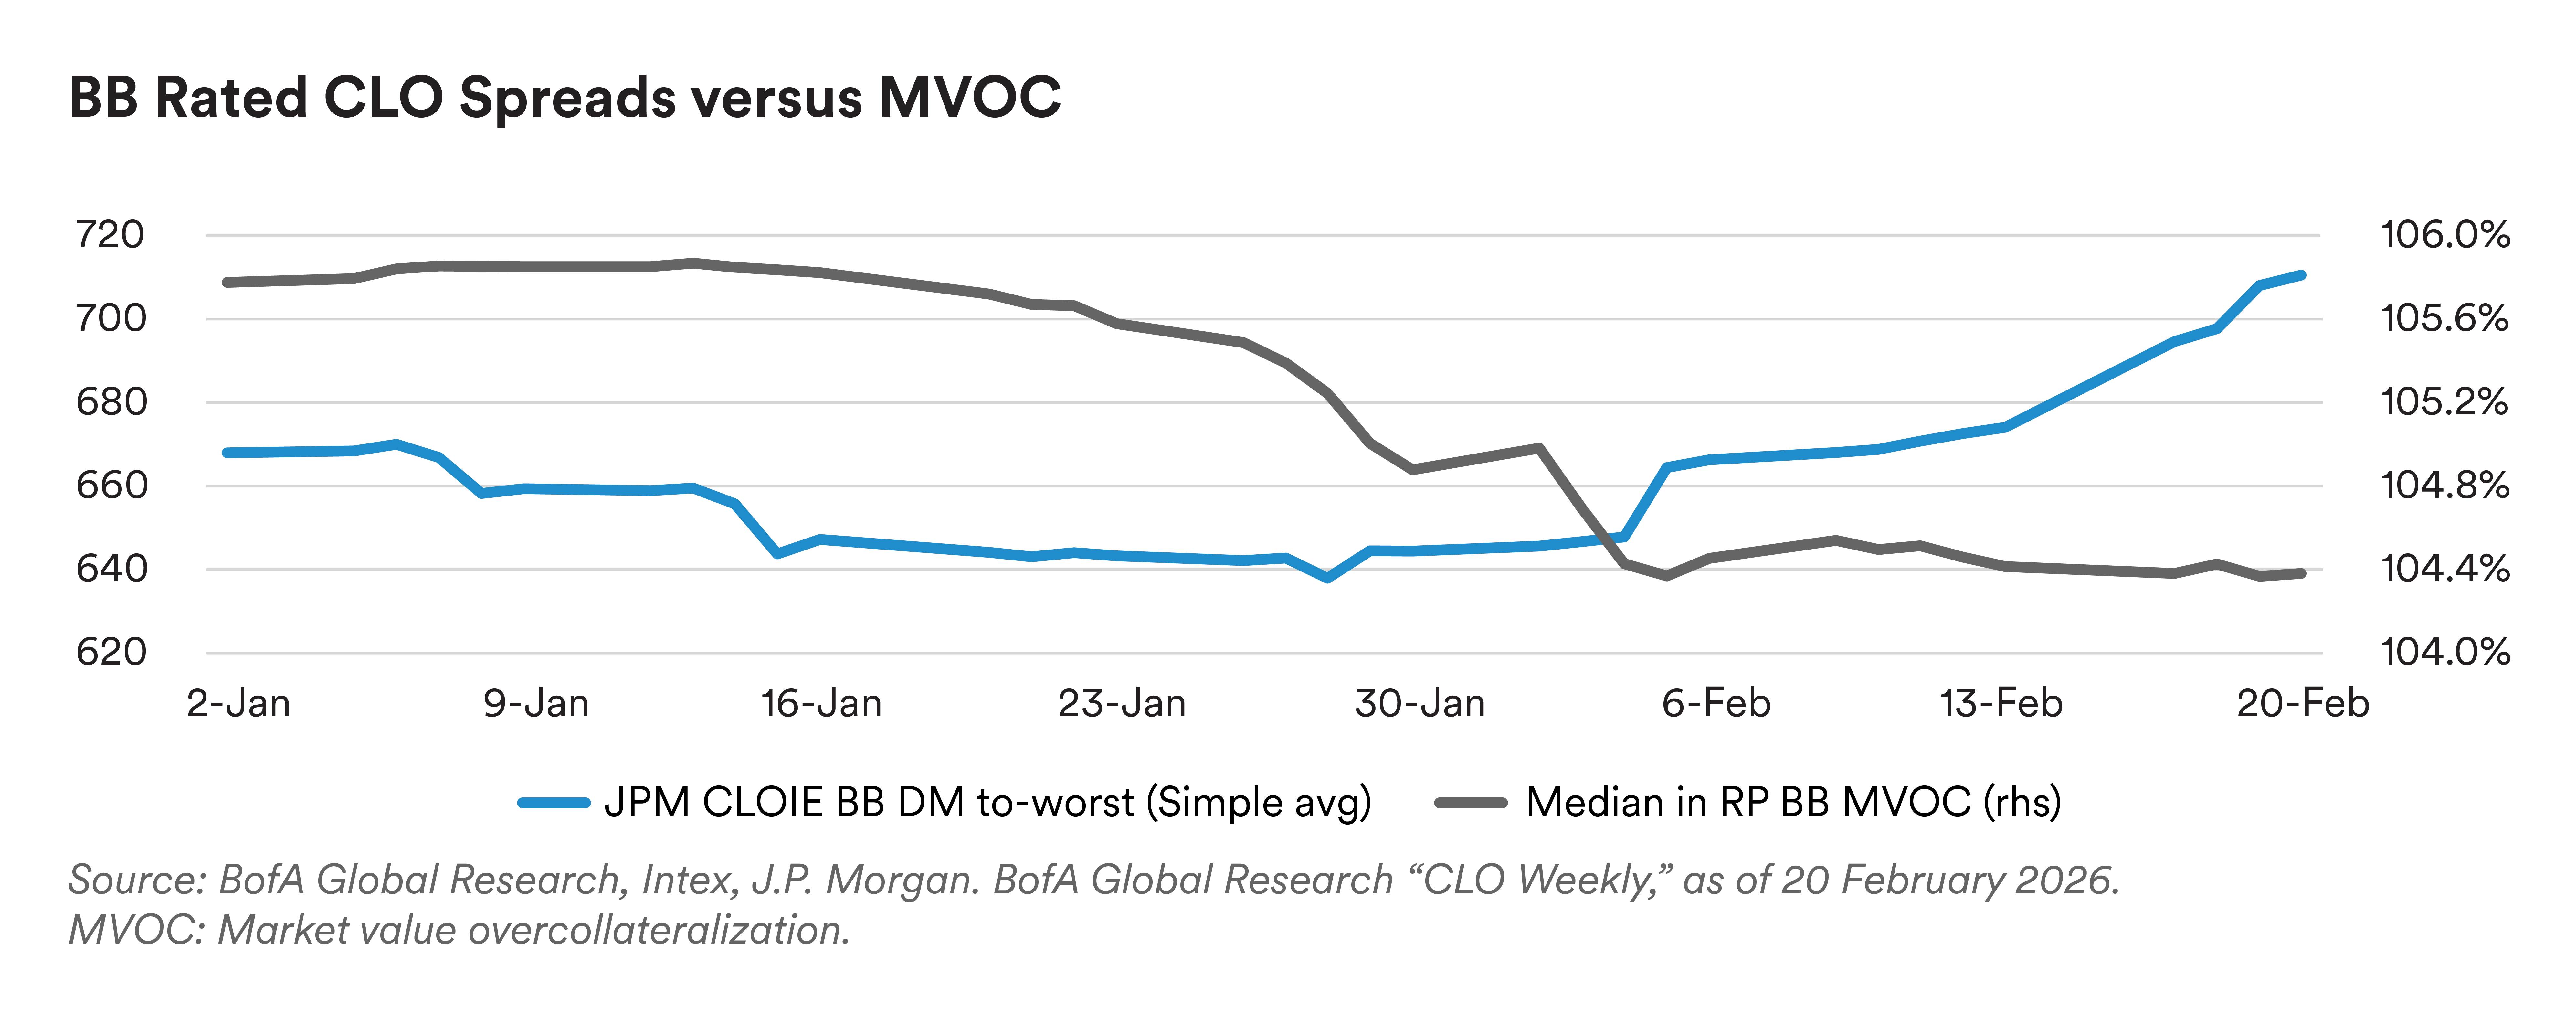
The recent selloff in software loans has created an environment where CLO investors are much more focused on tail risks in CLO portfolios, particularly exposure to AI risk. This has created additional bifurcation between tier 1 and tier 3 managers, along with a reluctance to invest in lower mezzanine tranches, especially for deals with lower market value overcollateralization (MVOC) cushions.
The software sector represents an average of 12.4% of US CLO collateral1 and is the highest-weighted sector of the loan market, at over 16% of the Morningstar LSTA Leveraged Loan Index. Given the high weighting of the software sector in CLOs and the broader loan market, CLOs have seen fundamentals deteriorate alongside the broad selloff. CLOs are not forced sellers during periods of increased volatility, but declining loan prices can increase haircuts on CCC and defaulted assets, leading to lower overcollateralization cushions and increasing the risk of test breaches. MVOCs for BB rated CLOs in their repayment periods have declined an average 1.2 points in 2026 to date, with individual manager results highly correlated to AI/software exposure.2
1 J.P. Morgan, “CLO: AI-ppetite for Disruption (Take Two),” as of 12 February 2026.
2 BofA Global Research, “CLO Weekly,” as of 13 February 2026.
On the surface, the selloff has improved the equity arbitrage, which was under significant pressure coming into 2026. An improving equity arb, in this case driven by loan spreads widening faster than CLO liability spreads, should increase a manager’s ability to issue a new CLO. Year-to-date, US CLO new issue volume totals $24.9 billion, compared to $24.7 billion over the same period last year.3 Meanwhile, refi/reset/reissue volumes have slowed year-over-year, with year-to-date volume of $34.0 billion trailing the $57.6 billion over the same period in 2025.4 Despite the better-looking equity arbitrage and ongoing issuance, the bifurcation in the loan market and demand for performing loans relative to more stressed names still makes ramping a new deal challenging.
Despite recent softness, we believe CLO tranches offer attractive total return potential relative to other equivalently rated fixed income assets. The technical picture appears supportive: CLO ETF inflows have driven total AUM to over $44 billion,5 institutional demand is strong, and redemption and amortization volumes remain high. However, tight valuations may argue for an incrementally more defensive stance.
Overall, we view the market this year as favoring CLO managers who avoid excessive concentration and rather focus on credit selection to mitigate downside risks. As a result, we view a nimble and robust bottom-up approach to security selection as paramount in 2026 given the dispersion in the loan market, in which certain CLO portfolios holding weaker credits may eventually experience impairments to the lowest-rated debt tranches. This could result in attractive opportunities more broadly to move down the capital stack.
3 J.P. Morgan, “CLO Weekly: 2026 YTD Issuance Package,” as of 23 February 2026.
4 J.P. Morgan, “CLO Weekly: 2026 YTD Issuance Package,” as of 23 February 2026.
5 J.P. Morgan, “CLO Weekly: 2026 YTD Issuance Package,” as of 23 February 2026.
About this Report: This is a quarterly publication which encapsulates insights of PineBridge Investments’ Leveraged Finance Team. Our global team of investment professionals convenes in a live forum to evaluate, debate and establish top-down guidance for the leveraged finance investment universe. Using our independent analysis and research, driven by our Fundamentals, Valuations and Technicals framework, we assess the pulse of high yield, leveraged loans and CLOs.
Disclaimer
MetLife Investment Management ("MIM"), which includes PineBridge Investments, is MetLife, Inc.'s institutional investment management business. MIM is a group of international companies that provides investment advice and markets asset management products and services to clients around the world. The various global teams referenced in this document, including portfolio managers, research analysts and traders are employed by the various legal entities that comprise MIM.
All investments involve risk, including possible loss of principal; no guarantee is made that investments will be profitable. This document is solely for informational purposes and does not constitute a recommendation regarding any investments or the provision of any investment advice, or constitute or form part of any advertisement of, offer for sale or subscription of, solicitation or invitation of any offer or recommendation to purchase or subscribe for any securities or investment advisory services. The views expressed herein are solely those of MIM and do not necessarily reflect, nor are they necessarily consistent with, the views held by, or the forecasts utilized by, the entities within the MetLife enterprise that provide insurance products, annuities and employee benefit programs. The information and opinions presented or contained in this document are provided as of the date it was written. It should be understood that subsequent developments may materially affect the information contained in this document, which none of MIM, its affiliates, advisors or representatives are under an obligation to update, revise or affirm. It is not MIM’s intention to provide, and you may not rely on this document as providing, a recommendation with respect to any particular investment strategy or investment. Affiliates of MIM may perform services for, solicit business from, hold long or short positions in, or otherwise be interested in the investments (including derivatives) of any company mentioned herein. Views may be based on third-party data that has not been independently verified. MIM does not approve of or endorse any republication of this material. This document may contain forward-looking statements, as well as predictions, projections and forecasts of the economy or economic trends of the markets, which are not necessarily indicative of the future. Any or all forward-looking statements, as well as those included in any other material discussed at the presentation, may turn out to be wrong.
The various global teams referenced in this document, including portfolio managers, research analysts and traders are employed by the various legal entities that comprise MIM.
All investments involve risks including the potential for loss of principle and past performance does not guarantee similar future results.
For investors the U.S.: This document is communicated by MetLife Investment Management, LLC (MIM, LLC), a U.S. Securities and Exchange Commission (SEC) registered investment adviser. Registration with the SEC does not imply a certain level of skill or that the SEC has endorsed the investment adviser.
For investors in the UK: This document is being distributed by MetLife Investment Management Limited (“MIML”), authorised and regulated by the UK Financial Conduct Authority (FCA reference number 623761), registered address One Angel Lane 8th Floor London EC4R 3AB United Kingdom. This document is approved by MIML as a financial promotion for distribution in the UK. This document is only intended for, and may only be distributed to, investors in the UK who qualify as a "professional client" as defined under the Markets in Financial Instruments Directive (2014/65/EU), as per the retained EU law version of the same in the UK.
For investors in the Middle East: This document is directed at and intended for institutional investors (as such term is defined in the various jurisdictions) only. The recipient of this document acknowledges that (1) no regulator or governmental authority in the Gulf Cooperation Council (“GCC”) or the Middle East has reviewed or approved this document or the substance contained within it, (2) this document is not for general circulation in the GCC or the Middle East and is provided on a confidential basis to the addressee only, (3) MetLife Investment Management is not licensed or regulated by any regulatory or governmental authority in the Middle East or the GCC, and (4) this document does not constitute or form part of any investment advice or solicitation of investment products in the GCC or Middle East or in any jurisdiction in which the provision of investment advice or any solicitation would be unlawful under the securities laws of such jurisdiction (and this document is therefore not construed as such).
For investors in Japan: This document is being distributed by MetLife Investment Management Japan, Ltd. (“MIM JAPAN”), a registered Financial Instruments Business Operator (“FIBO”) conducting Investment Advisory Business, Investment Management Business and Type II Financial Instruments Business under the registration entry “Director General of the Kanto Local Finance Bureau (Financial Instruments Business Operator) No. 2414” pursuant to the Financial Instruments and Exchange Act of Japan (“FIEA”), and a regular member of the Japan Investment Advisers Association and the Type II Financial Instruments Firms Association of Japan. In its capacity as a discretionary investment manager registered under the FIEA, MIM JAPAN provides investment management services and also sub-delegates a part of its investment management authority to other foreign investment management entities within MIM in accordance with the FIEA. This document is only being provided to investors who are general employees' pension fund based in Japan, business owners who implement defined benefit corporate pension, etc. and Qualified Institutional Investors domiciled in Japan. It is the responsibility of each prospective investor to satisfy themselves as to full compliance with the applicable laws and regulations of any relevant territory, including obtaining any requisite governmental or other consent and observing any other formality presented in such territory. As fees to be borne by investors vary depending upon circumstances such as products, services, investment period and market conditions, the total amount nor the calculation methods cannot be disclosed in advance. All investments involve risks including the potential for loss of principle and past performance does not guarantee similar future results. Investors should obtain and read the prospectus and/or document set forth in Article 37-3 of Financial Instruments and Exchange Act carefully before making the investments.
For Investors in Hong Kong S.A.R.: This document is being distributed by MetLife Investments Asia Limited (“MIAL”), licensed by the Securities and Futures Commission (“SFC”) for Type 1 (dealing in securities), Type 4 (advising on securities) and Type 9 (asset management) regulated activities in Hong Kong S.A.R. This document is intended for professional investors as defined in the Schedule 1 to the SFO and the Securities and Futures (Professional Investor) Rules only. Unless otherwise stated, none of the authors of this article, interviewees or referenced individuals are licensed by the SFC to carry on regulated activities in Hong Kong S.A.R. The information contained in this document is for information purposes only and it has not been reviewed by the Securities and Futures Commission.
For investors in Australia: This information is distributed by MIM LLC and is intended for “wholesale clients” as defined in section 761G of the Corporations Act 2001 (Cth) (the Act). MIM LLC exempt from the requirement to hold an Australian financial services license under the Act in respect of the financial services it provides to Australian clients. MIM LLC is regulated by the SEC under US law, which is different from Australian law.
For investors in the EEA: This document is being distributed by MetLife Investment Management Europe Limited (“MIMEL”), authorised and regulated by the Central Bank of Ireland (registered number: C451684), registered address 20 on Hatch, Lower Hatch Street, Dublin 2, Ireland. This document is approved by MIMEL as marketing communications for the purposes of the EU Directive 2014/65/EU on markets in financial instruments (“MiFID II”). Where MIMEL does not have an applicable cross-border licence, this document is only intended for, and may only be distributed on request to, investors in the EEA who qualify as a “professional client” as defined under MiFID II, as implemented in the relevant EEA jurisdiction. The investment strategies described herein are directly managed by delegate investment manager affiliates of MIMEL. Unless otherwise stated, none of the authors of this article, interviewees or referenced individuals are directly contracted with MIMEL or are regulated in Ireland. Unless otherwise stated, any industry awards referenced herein relate to the awards of affiliates of MIMEL and not to awards of MIMEL.