Fixed income markets delivered modest performance in the first half of the year, notwithstanding a volatile April that saw fixed income markets lose up to 2.5% before recovering in May and June.1 A rally in U.S. Treasury yields boosted total returns, although excess returns diverged across credit sectors. In the broadest sense, we witnessed higher quality credits decompress, while lower rated credits saw their spreads tighten relative to their higher-rated peers. Credit spreads, although they sit wider today, tightened to as low as 80 basis points over duration matched treasuries by the end of May, before a soft widening in June, ending the quarter 3 basis points wider. The Agg (Bloomberg U.S. Aggregate Index) recouped some of its year-to-date losses, but still ended the first half of the year 71 basis points lower than its starting value. Riskier fixed income assets, such as high-yield bonds, bank loans, and preferred securities, outpaced investment-grade corporates in the first six months of 2024. Although total returns for the Bloomberg U.S. Credit Index struggled in April due to rising treasury yields, excess returns were still positive. In May, the Credit Index benefited from a tailwind of declining rates, in addition to modest spread compression. However, June’s performance was weaker as spreads were pressured wider predominantly on the back of robust new-issuance combined with a political picture that may include further spending which we believe also pressured back-end rates. We maintain a constructive view on investment-grade corporate bonds, which offer attractive yields and moderate credit risk to institutional investors but remain cautious of late-cycle credit dynamics and consumer data showing signs of weakening.
On the macro front, the inflationary pressures that marked the beginning of the year lessened in the second quarter, with CPI coming in at 3.3% Y-o-Y, slightly below consensus estimates and on a downward trend. Excluding the volatile components of Energy and Food, Core CPI moderated to 3.4% Y-o-Y, the lowest level since 2021. The economic data also showed a downward revision of the 1Q GDP figure to 1.3% Q-o-Q, which triggered a significant rally in rates. The Federal Reserve (“the Fed”) remained cautious about the future path of interest rates, as it kept its policy stance unchanged at its latest meeting. In June, the Fed projected only one possible rate cut for 2024, down from three in March. The Fed stated that it needed “greater confidence” that inflation was moving towards its 2% target in a sustainable manner before easing policy. Currently, the market is pricing in just under two, twenty-five basis point cuts in the final months of 2024, a large shift from the six cuts expected at the end of 2023.
he U.S. 10-Year reached a peak of 4.71%, as yield movements were closely tied to the economic data surprises, before settling to levels around 4.22% today. The U.S. 2-year Note exhibited a similar pattern, increasing 41 basis points to 5.04% before ending June around 4.75% – still ~40 basis points above its starting point for the year. The 2s10s curve remained inverted by up to -36 basis points, despite occasional periods of steepening over the quarter, while 5s30s steepened to a positive 18 basis points. Credit curves whether 10s30s or 5s30s broadly steepened up to 6 basis points while short dated 3s/5s financials curves flattened.2
In our view, with credit nearly priced to perfection, the potential for outperformance relative to Treasuries is quite limited. And upon our review of fundamentals, we noticed mild deterioration in the first quarter, but still conclude fundamentals are broadly resilient in spite of tight financial conditions and a marginally weaker consumer. Overall at the index level, revenue contracted by nearly 5% while EBITDA grew 2.9% Q-o-Q improving EBITDA margin by 1.6% highlighting the fundamental resiliency of corporate profitability. Gross leverage ratios were broadly unchanged even with the glut of new issuance that came to market in the first quarter. At the same time, interest coverage slightly deteriorated by a one-tenth. More granularly, AA and better continued to diverge from lower-rated tranches in decreasing leverage ratios and increasing interest coverage. EBITDA margins for both AA and better and BBBs expanded while single-As saw a small degradation over the first quarter. However, the story of the quarter in credit is primarily on BBBs – more specifically, the cohorts’ spread compression year to-date as well as relative value. The BBB/A Industrial spread pickup is close to unchanged at 40bps – a spread that isn’t far off the tights relative to history. BBBs in 2024 have realized strong spread compression while single-A’s have underperformed. Furthermore, the overall spread between BBBs and BBs has also compressed to record low levels.

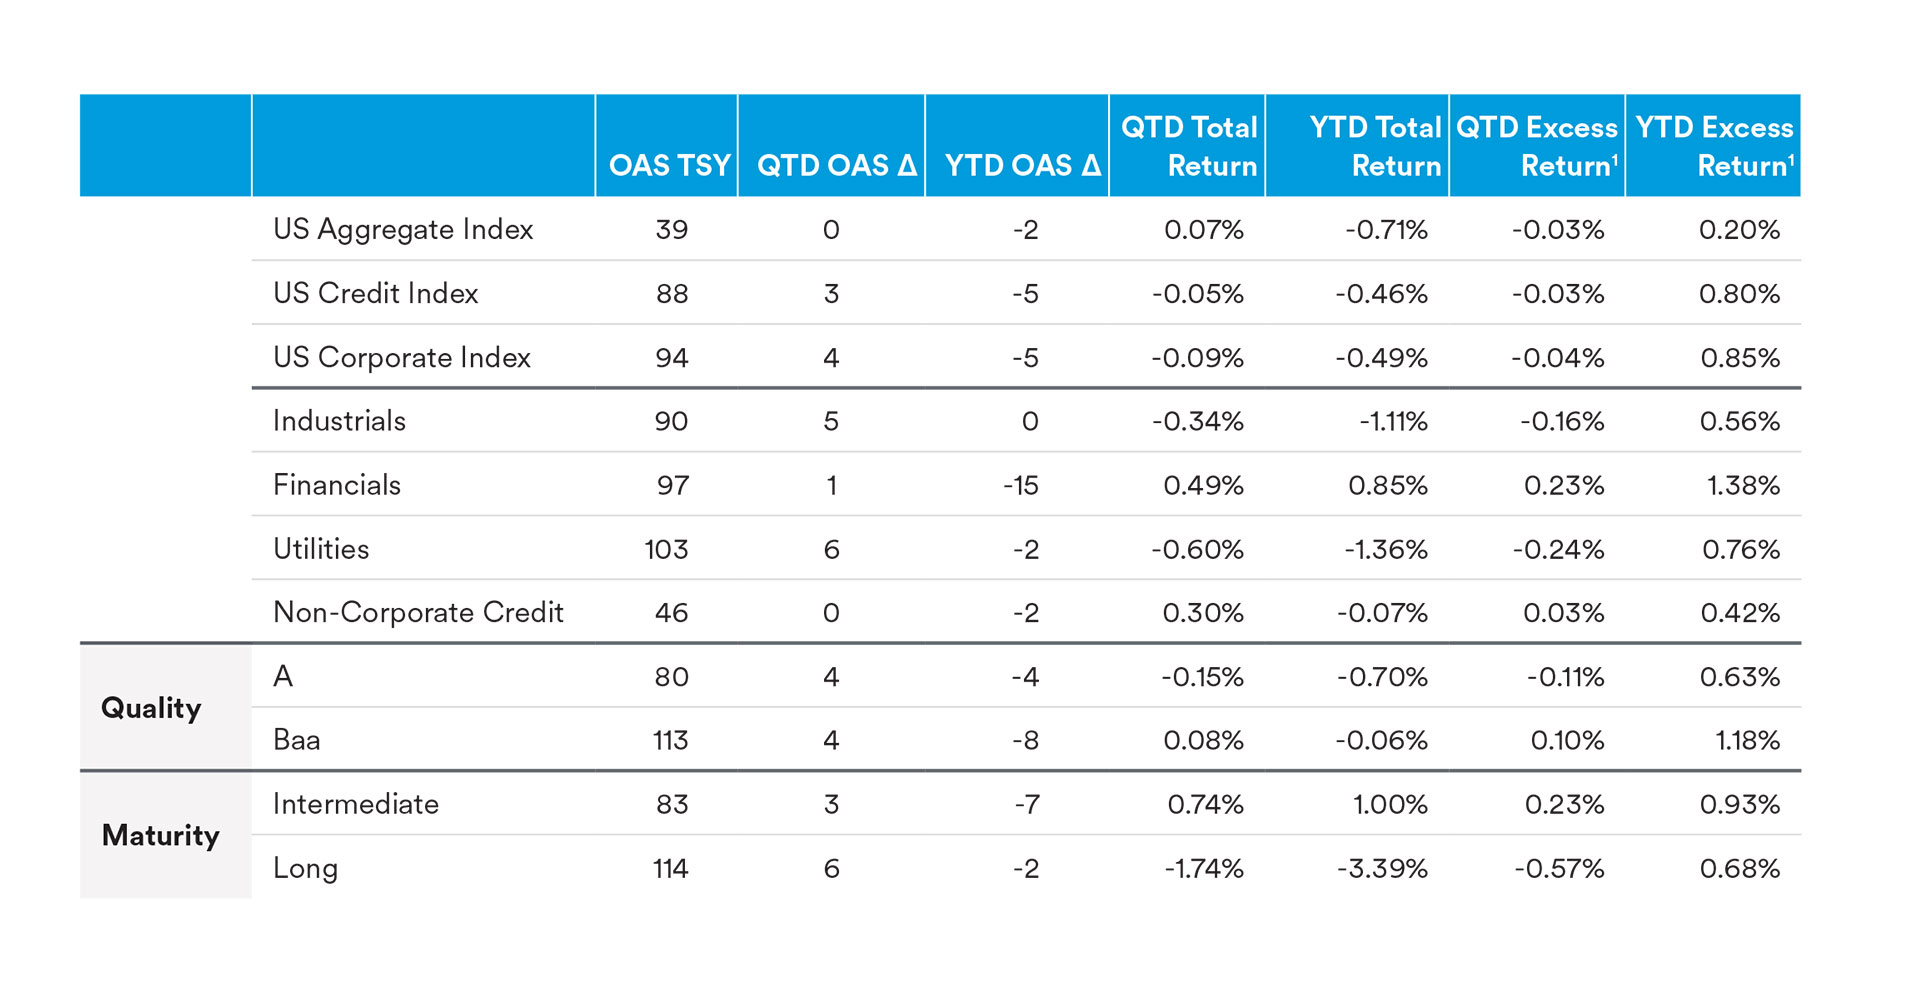
Performance wise, the Corporate index returned 85 basis points above duration matched Treasuries year-to-date despite shedding 4 basis points in excess return over the quarter. The OAS of the index reached a low of 85 basis points in May and decompressed 9 basis points into June before a brief rally to close the quarter. Across ratings cohorts, lower quality (BBB, 0.14% excess) outperformed single A (-0.12% excess) delivering 30 basis points in additional excess return over the higher quality components of the index. At the sector level, leaders were Home Construction (0.92% excess), Gaming (0.72% excess), Healthcare REITS (0.54% excess), Airlines(0.49% excess) and Tobacco (0.41% excess) for which larger contributions came from compression amongst lower rated (BBB) issuers benefiting from investors continuing to chase the all-in yields. Across sectors that lagged, Media and Entertainment issuer, Paramount, struggled following the Redstone family’s abrupt pause to M&A talks with SkyDance. In Restaurants, the sector was pulled lower on weakness from both McDonald’s Corp. as well as Starbucks which faced headwinds related to weaker consumer spending. Conversely, HealthCare REITS reaped strong gains lead by Healthpeak and Omega Healthcare despite weaker sentiment in commercial real estate overall. Airlines were also a stronger sector supported by robust bookings and expectations for a strong summer travel season. However, the top performing sectors in excess returns were the results of a catch-up in beta compression of low BBBs in smaller sectors that lagged earlier in the year.3


U.S. Corporate issuance over the first half of 2024 recorded the second highest amount of issuance on record just behind that of the first half of 2020. In our view, the $874 billion of high grade issuance represented issuer’s decisions to bring forward planned issuance for the year ahead of any volatile that could be introduced as the U.S. moves closer to elections as much as taking advantage of a relatively attractive funding environment where the demand for fixed income remains steadfast alongside narrow credit spreads in an issuer’s favor. Following the first quarter, Banks tapped markets for funding in April which trailed off throughout the quarter. In May and June, it was Industrials that issued the bulk of supply to help support general financing as well as M&A deals in the marketplace. Across the marketplace, some of the larger deals came from Boeing and Home-Depot both bringing $10bn respectively across the curve, CVS and Johnson & Johnson issuing $5bn and $4bn, respectively in May, and then Energy Transfer raising $3.5bn in June. Across capital structures, there was an uptick in issuance of hybrid capital structures as the senior-subordinated differentials compressed, which could be attributed as well to a methodology change from Moody’s regarding equity credit for junior dated subordinated debentures. By maturity, back-end supply has picked up in a big way with long-dated supply up 26% versus this same time last year. The average maturity of newly issued bonds in 2Q24 stood at 10.5yrs compared to 10.8yrs in 2Q23 and 10yrs in 2Q22.4


2Q 2024 Market Outlook—Corporate
Complacency in the market is reaching its zenith. Certainly the price action through the first half of the year has done to little to discourage that sentiment, with corporate spreads a mere 5 basis points tighter and total and excess returns bracketing zero. We increasingly spend time on the desk debating the prevailing technicals and the nuanced evolution of market dynamics, while the macro backdrop and credit fundamentals patiently await their return to prominence. We would argue the direction of change is more clearly headed that way, even if the pace of that shift at times feels glacial.
The U.S. economic picture has changed as data over the last quarter continued to surprise to the downside, which feels absent from the day-to-day focus on supply and demand credit market dynamics. Weakening consumer data and an uptick in unemployment, combined with rising subprime delinquencies, all point to a decelerating, if not contracting environment. We believe there is complacency around the economic outlook after the recession on the horizon failed to materialize for multiple quarters and many investors threw in the towel. Restrictive monetary policy has taken longer to bite the post-Covid world brimming with government support but in our opinion will continue to weigh on economic activity.
Such a picture is incongruent with generationally tight spread compensation over Treasuries in the credit market. A Fed cutting cycle (that seems closer than ever) threatens to dampen the technical support for credit by drawing in more corporate borrowing and hampering the yield sensitive buyer. Should that Fed cutting cycle come in response to macroeconomic weakness, we believe fundamentals will follow suit and lead to further credit underperformance. This would likely spell broad spread widening and a material decompression of spread relationships in an unwind of the recent commodity-like treatment of investment grade credit risk.
We have consistently posited in these missives that valuations at these levels offer an asymmetric risk/reward profile, though have admittedly been wrong (early?) on this call. We have also confessed a discomfort in accurately pegging the time frame for this call to come to fruition, and in turn have devoted significant real estate to detailing the various tools at our disposal that we could employ to generate alpha given the limited opportunity set. That opportunity set through the first half of 2024 could best be summed up in one word: compression.
Compression takes many forms, with the durability of each potentially being quite different in this environment. Selecting individual securities that are best positioned to outperform due to improving fundamentals and attractive valuations is central to what we do, and represents an area of the market where we believe we can drive value in any market environment.
From a sector level, we continue to believe that the Banking sector has room to compress relative to Industrials (despite significant outperformance already this year), whereas within Industrials, we prefer to position for decompression. We believe the outperformance of BBB Industrials may be long in the tooth, and see more value in defensive and less cyclical sectors at this point in the cycle, that in many cases are trading cheap due to elevated issuance. Another area that has our attention is compression amongst liquidity tiers. As less liquid credit is apt to underperform in a sell-off, we are identifying opportunities to upgrade our liquidity at tighter spread relationships. From a curve perspective, we still favor the front end which we believe is a conservative way to build a yield advantage. We also remain comfortable maintaining our underweight to the long end, though we are willing to gradually reduce that significant underweight in select credits that have unjustifiably steep curves. We are less enticed by adding yield via the high yield market, where we believe the spread pick relative to front end corporates to be quite unattractive. Just because interest rates have remained higher for longer than anticipated does not mean things will persist forever. We believe there is general fatigue in the market, from equities to spreads and the economy, that is driving a disregard for a myriad of risks surfacing. We are most acutely focused on how restrictive monetary policy affects the U.S. economy and could spell a fragile environment for credit spreads. This does not even begin to address the bubbling risks of a U.S. election, French politics, further weakness in Europe, a weaker Japanese Yen, mounting geopolitical tensions, a resurgence of regional banking risks or rolling real estate defaults (just to name a few). While the exact catalyst for spread widening remains unknown, we believe there are enough risks globally to warrant a defensive posture in portfolios against a near record tight environment. Market focus on yield instead of spread should continue to provide some security selection opportunities in the near term, but has also set up for materially negative excess return we feel is greatly underappreciated.
Endnotes
1 Bloomberg LP
2 Bank of America Merrill Lynch
3 Bloomberg
4 JP Morgan
Disclaimer
This material is intended solely for Institutional Investors, Qualified Investors and Professional Investors. This analysis is not intended for distribution with Retail Investors. This document has been prepared by MetLife Investment Management (“MIM”)1 solely for informational purposes and does not constitute a recommendation regarding any investments or the provision of any investment advice, or constitute or form part of any advertisement of, offer for sale or subscription of, solicitation or invitation of any offer or recommendation to purchase or subscribe for any securities or investment advisory services. The views expressed herein are solely those of MIM and do not necessarily reflect, nor are they necessarily consistent with, the views held by, or the forecasts utilized by, the entities within the MetLife enterprise that provide insurance products, annuities and employee benefit programs. The information and opinions presented or contained in this document are provided as of the date it was written. It should be understood that subsequent developments may materially affect the information contained in this document, which none of MIM, its affiliates, advisors or representatives are under an obligation to update, revise or affirm. It is not MIM’s intention to provide, and you may not rely on this document as providing, a recommendation with respect to any particular investment strategy or investment. Affiliates of MIM may perform services for, solicit business from, hold long or short positions in, or otherwise be interested in the investments (including derivatives) of any company mentioned herein. This document may contain forward-looking statements, as well as predictions, projections and forecasts of the economy or economic trends of the markets, which are not necessarily indicative of the future. Any or all forward-looking statements, as well as those included in any other material discussed at the presentation, may turn out to be wrong. All investments involve risks including the potential for loss of principle and past performance does not guarantee similar future results. Property is a specialist sector that may be less liquid and produce more volatile performance than an investment in other investment sectors. The value of capital and income will fluctuate as property values and rental income rise and fall. The valuation of property is generally a matter of the valuers’ opinion rather than fact. The amount raised when a property is sold may be less than the valuation. Furthermore, certain investments in mortgages, real estate or non-publicly traded securities and private debt instruments have a limited number of potential purchasers and sellers. This factor may have the effect of limiting the availability of these investments for purchase and may also limit the ability to sell such investments at their fair market value in response to changes in the economy or the financial markets.In the U.S. this document is communicated by MetLife Investment Management, LLC (MIM, LLC), a U.S. Securities Exchange Commission registered investment adviser. MIM, LLC is a subsidiary of MetLife, Inc. and part of MetLife Investment Management. Registration with the SEC does not imply a certain level of skill or that the SEC has endorsed the investment advisor.
For investors in the UK, this document is being distributed by MetLife Investment Management Limited (“MIML”), authorised and regulated by the UK Financial Conduct Authority (FCA reference number 623761), registered address One Angel Lane 8th Floor London EC4R 3AB United Kingdom. This document is approved by MIML as a financial promotion for distribution in the UK. This document is only intended for, and may only be distributed to, investors in the UK who qualify as a “professional client” as defined under the Markets in Financial Instruments Directive (2014/65/EU), as per the retained EU law version of the same in the UK.
For investors in the Middle East: This document is directed at and intended for institutional investors (as such term is defined in the various jurisdictions) only. The recipient of this document acknowledges that (1) no regulator or governmental authority in the Gulf Cooperation Council (“GCC”) or the Middle East has reviewed or approved this document or the substance contained within it, (2) this document is not for general circulation in the GCC or the Middle East and is provided on a confidential basis to the addressee only, (3) MetLife Investment Management is not licensed or regulated by any regulatory or governmental authority in the Middle East or the GCC, and (4) this document does not constitute or form part of any investment advice or solicitation of investment products in the GCC or Middle East or in any jurisdiction in which the provision of investment advice or any solicitation would be unlawful under the securities laws of such jurisdiction (and this document is therefore not construed as such).
For investors in Japan: This document is being distributed by MetLife Investment Management Japan, Ltd. (“MIM JAPAN”), a registered Financial Instruments Business Operator (“FIBO”) conducting Investment Advisory Business, Investment Management Business and Type II Financial Instruments Business under the registration entry “Director General of the Kanto Local Finance Bureau (Financial Instruments Business Operator) No. 2414” pursuant to the Financial Instruments and Exchange Act of Japan (“FIEA”), and a regular member of the Japan Investment Advisers Association and the Type II Financial Instruments Firms Association of Japan. In its capacity as a discretionary investment manager registered under the FIEA, MIM JAPAN provides investment management services and also sub�delegates a part of its investment management authority to other foreign investment management entities within MIM in accordance with the FIEA. This document is only being provided to investors who are general employees’ pension fund based in Japan, business owners who implement defined benefit corporate pension, etc. and Qualified Institutional Investors domiciled in Japan. It is the responsibility of each prospective investor to satisfy themselves as to full compliance with the applicable laws and regulations of any relevant territory, including obtaining any requisite governmental or other consent and observing any other formality presented in such territory. As fees to be borne by investors vary depending upon circumstances such as products, services, investment period and market conditions, the total amount nor the calculation methods cannot be disclosed in advance. All investments involve risks including the potential for loss of principle and past performance does not guarantee similar future results. Investors should obtain and read the prospectus and/or document set forth in Article 37-3 of Financial Instruments and Exchange Act carefully before making the investments.
For Investors in Hong Kong S.A.R.: This document is being issued by MetLife Investments Asia Limited (“MIAL”), a part of MIM, and it has not been reviewed by the Securities and Futures Commission of Hong Kong (“SFC”). MIAL is licensed by the Securities and Futures Commission for Type 1 (dealing in securities), Type 4 (advising on securities) and Type 9 (asset management) regulated activities.
For investors in Australia: This information is distributed by MIM LLC and is intended for “wholesale clients” as defined in section 761G of the Corporations Act 2001 (Cth) (the Act). MIM LLC exempt from the requirement to hold an Australian financial services license under the Act in respect of the financial services it provides to Australian clients. MIM LLC is regulated by the SEC under US law, which is different from Australian law.
MIMEL: For investors in the EEA, this document is being distributed by MetLife Investment Management Europe Limited (“MIMEL”), authorised and regulated by the Central Bank of Ireland (registered number: C451684), registered address 20 on Hatch, Lower Hatch Street, Dublin 2, Ireland. This document is approved by MIMEL as marketing communications for the purposes of the EU Directive 2014/65/EU on markets in financial instruments (“MiFID II”). Where MIMEL does not have an applicable cross-border licence, this document is only intended for, and may only be distributed on request to, investors in the EEA who qualify as a “professional client” as defined under MiFID II, as implemented in the relevant EEA jurisdiction. The investment strategies described herein are directly managed by delegate investment manager affiliates of MIMEL. Unless otherwise stated, none of the authors of this article, interviewees or referenced individuals are directly contracted with MIMEL or are regulated in Ireland. Unless otherwise stated, any industry awards referenced herein relate to the awards of affiliates of MIMEL and not to awards of MIMEL.1 MetLife Investment Management (“MIM”) is MetLife, Inc.’s institutional management business and the marketing name for subsidiaries of MetLife that provide investment management services to MetLife’s general account, separate accounts and/or unaffiliated/ third party investors, including: Metropolitan Life Insurance Company, MetLife Investment Management, LLC, MetLife Investment Management Limited, MetLife Investments Limited, MetLife Investments Asia Limited, MetLife Latin America Asesorias e Inversiones Limitada, MetLife Asset Management Corp. (Japan), and MIM I LLC, MetLife Investment Management Europe Limited and Affirmative Investment Management Partners Limited. L0824042699[exp0226][All States]